. 2020 Oct 26;10(26):12090-12110.
doi: 10.7150/thno.51573. eCollection 2020.

Theta-burst transcranial magnetic stimulation promotes stroke recovery by vascular protection and neovascularization

Affiliations

Theta-burst transcranial magnetic stimulation promotes stroke recovery by vascular protection and neovascularization

Xuemei Zong et al. Theranostics. .

Abstract

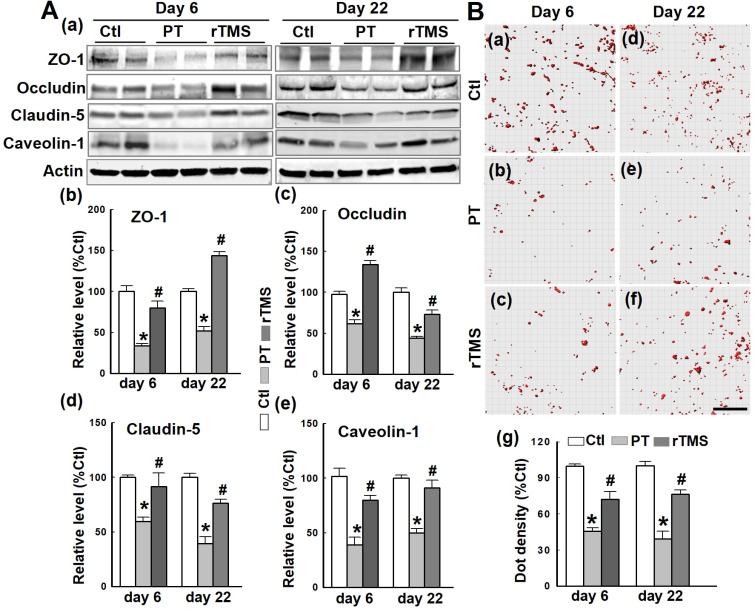
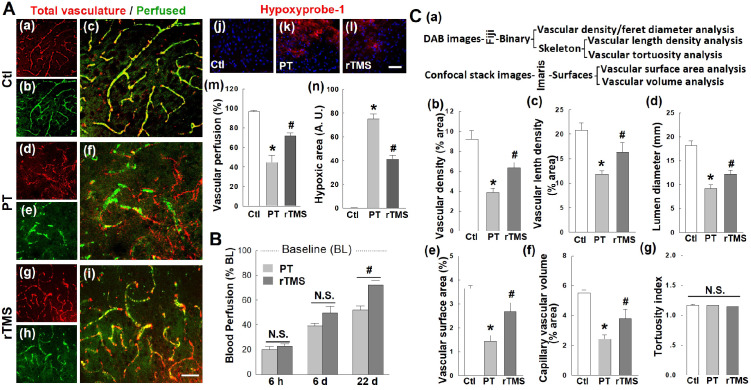
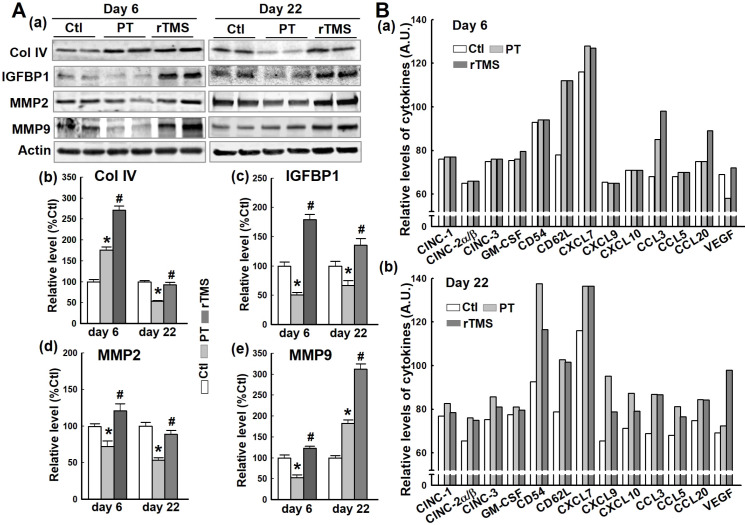
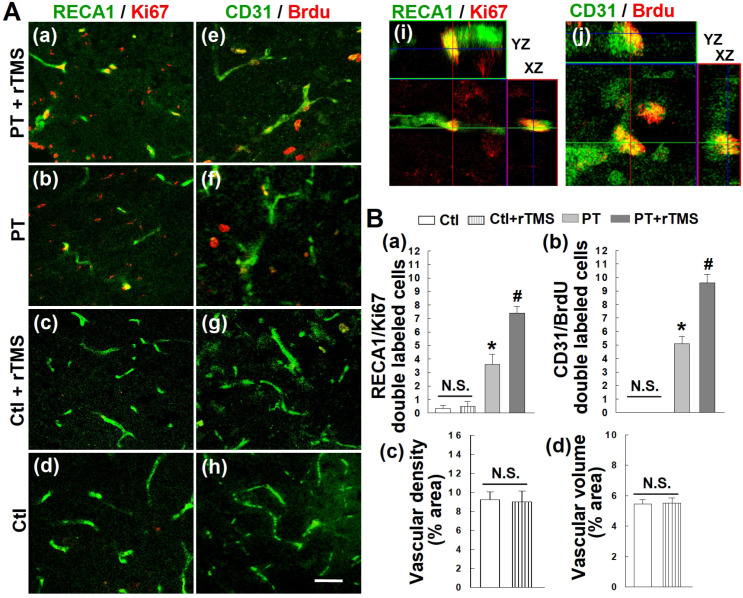
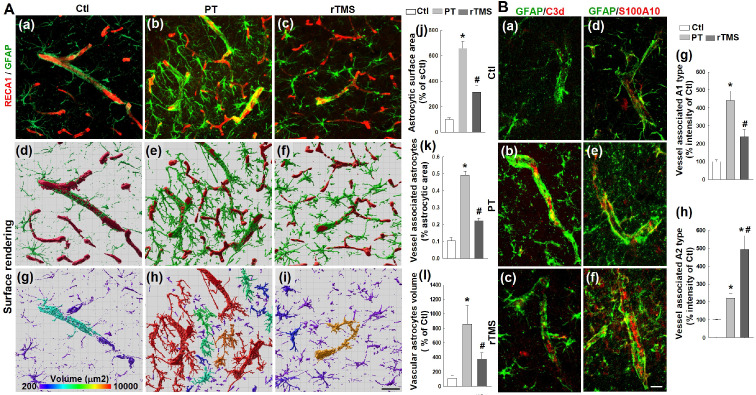
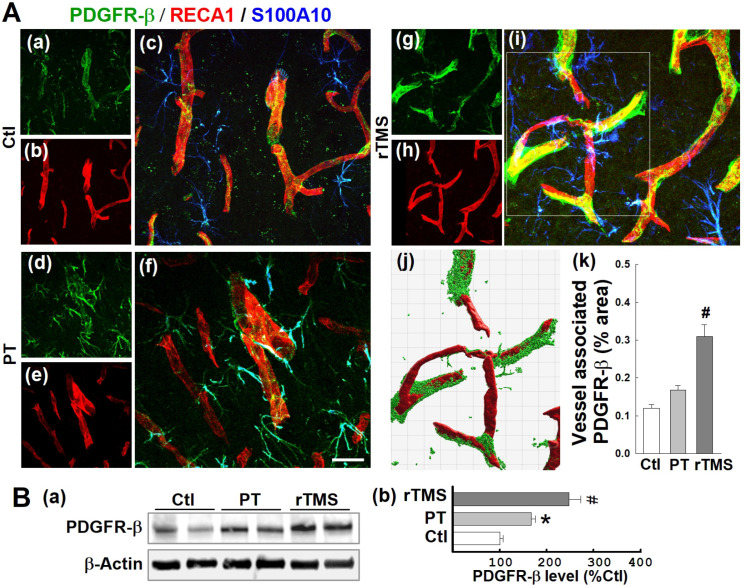
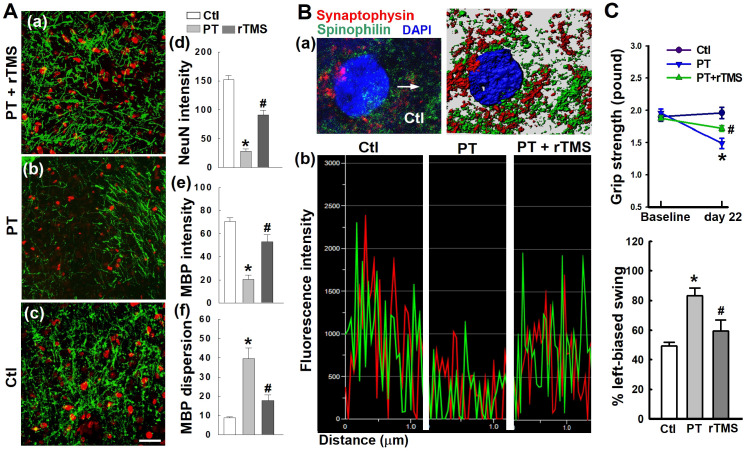
Rationale: The integrity and function of the blood-brain barrier (BBB) is compromised after stroke. The current study was performed to examine potential beneficial effects and underlying mechanisms of repetitive transcranial magnetic stimulation (rTMS) on angiogenesis and vascular protection, function, and repair following stroke, which are largely unknown. Methods: Using a rat photothrombotic (PT) stroke model, continuous theta-burst rTMS was administered once daily to the infarcted hemisphere for 5 min, beginning 3 h after PT stroke. This treatment was applied for 6 days. BBB integrity, blood flow, vascular associated proteins, angiogenesis, integrity of neuronal morphology and structure, and behavioral outcome were measured and analyzed at 6 and/or 22 days after PT stroke. Results: We report that rTMS significantly mitigated BBB permeabilization and preserved important BBB components ZO-1, claudin-5, occludin, and caveolin-1 from PT-induced degradation. Damage to vascular structure, morphology, and perfusion was ameliorated by rTMS, resulting in improved local tissue oxygenation. This was accompanied with robust protection of critical vascular components and upregulation of regulatory factors. A complex cytokine response was induced by PT, particularly at the late phase. Application of rTMS modulated this response, ameliorating levels of cytokines related to peripheral immune cell infiltration. Further investigation revealed that rTMS promoted and sustained post-ischemic angiogenesis long-term and reduced apoptosis of newborn and existing vascular endothelial cells. Application of rTMS also inhibited PT-induced excessive astrocyte-vasculature interactions and stimulated an A1 to A2 shift in vessel-associated astrocytes. Mechanistic studies revealed that rTMS dramatically increased levels of PDGFRβ associated with A2 astrocytes and their adjacent vasculature. As well, A2 astrocytes displayed marked amplification of the angiogenesis-related factors VEGF and TGFβ. PT induced a rise in vessel-associated expression of HIF-1α that was starkly intensified by rTMS treatment. Finally, rTMS preserved neuronal morphology, synaptic structure integrity and behavioral outcome. Conclusions: These results indicate that rTMS can exert powerful protective and restorative effects on the peri-infarct microvasculature after PT stroke by, in part, promoting HIF-1α signaling and shifting vessel-associated astrocytic polarization to the A2 phenotype. This study provides further support for the potent protective effects of rTMS in the context of ischemic stroke, and these findings implicate vascular repair and protection as an important underlying phenomenon.

Keywords: HIF-1α; Transcranial Magnetic Stimulation (rTMS); angiogenesis; ischemic stroke; vascular protection; vascular repair.


Conflict of interest statement

Competing Interests: The authors have declared that no competing interest exists.

Figures

Figure 1
Figure 1
rTMS treatment preserved blood-brain barrier (BBB) permeability induced by PT-stroke in the peri-infarct cortical region 6 days after PT stroke. (A) Rat brains without saline flush. Representative confocal microscopy images of IgG staining (red in a-i) and FITC-dextran signal (green) in the peri-infarct areas. Nuclei were counterstained with DAPI (blue). (B) FITC-dextran and Evans blue injected rats were transcardially flushed with ice-cold saline, and the brain sections were subjected to confocal imaging or DAB-stained image acquisition. Representative 3-D reconstruction (Bitplane Imaris software) of typical FITC-dextran leakage in PT animals (green in a,b), IgG leakage (brown in c-e) and Evans blue (red in f-h) are shown. Quantitative analyses of extravascular FITC fluorescence (i) and IgG intensity (j) were performed. Evans blue penetration into brain tissue following intravenous administration was also quantified using peri-infarct protein samples (k) as indicated in Methods. Magnification: 40×, scale bar: 50 µm. *P < 0.05 versus Ctl group, #P <0.05 versus PT group without rTMS treatment. Data are presented as means±SE (N = 5-8). A.U.: arbitrary unit.
Figure 2
Figure 2
rTMS treatment increased the expression of tight junction-associated proteins and scaffold protein, and promoted the interaction between ZO-1 and Claudin-5. (A) Western blotting and quantitative analyses of ZO-1, occludin and claudin-5, and the scaffold protein caveolin-1 using control (Ctl) and peri-infarct cortical proteins at day 6 and 22 following PT stroke. (B) Duo-Link II in situ PLA immunostaining (a-f) and quantification (g) of the interactions between ZO-1 and claudin-5 in Ctl brain and peri-infarct areas at day 6 and 22. Red spots representing the bindings were surface separated and analyzed using Imaris software. Magnification: 40×, scale bar: 50 µm. Data are means±SE from 4-6 independent animals per group. *P < 0.05 versus Ctl group, #P < 0.05 versus PT stroke group.
Figure 3
Figure 3
rTMS treatment improved microvascular perfusion, local reoxygenation, and morphometric parameters in peri-infarct region examined 22 days after PT stroke. (A) Labeling of RECA1 (a-i, red, represents total vasculature), FITC-dextran (green, represents perfused vasculature), and hypoxyprobe-1 probe (j-l, red, local oxygen gradient marker) in Ctl and peri-infarct regions. The percentage area of perfused vasculature compared to total vasculature (m), and hypoxic area (n) were quantitatively analyzed. (B) Regional blood flow at the surface of the infarcted area was also measured at three time points after stroke, using an Oxy-Lab Laser Doppler (see Methods). (C) Morphometric determination of the indicated vascular parameters in the peri-infarct zone 22 days after stroke. Schematic diagrams of techniques and software used for vessel quantification are shown in (a), and the comparative analyses are shown in (b-g). Magnification: 40×, scale bar: 50 µm. *P < 0.05 versus Ctl group, #P < 0.05 versus PT group without rTMS treatment. Data are presented as mean ± SE from 5-8 animals in each group.
Figure 4
Figure 4
Effects of rTMS treatment on the expression of vascular component and regulatory proteins, and cytokine levels at early and late stages following PT stroke. (A) Western blotting and quantitative analyses of the indicated proteins associated with vascular structure components and the regulation of the endothelial permeability barrier were performed, using protein samples from the peri-infarct brain region at day 6 and 22 after PT stroke (a-e). (B) Expression of the indicated cytokines in Ctl and peri-infarct brain proteins, at day 6 and 22, was examined using Proteome Profiler Rat Cytokine Array Kits (see Methods). Data are means±SE (N = 4-6 animals/group). *P < 0.05 versus Ctl group, #P < 0.05 versus PT stroke group.
Figure 5
Figure 5
rTMS treatment promoted post-ischemic angiogenesis, as observed on day 22 following PT stroke. (A) Representative confocal microscopy images of endothelial cell antigen markers RECA-1 (a-d, green) and CD31 (e-h, green), as well as proliferative cell markers Ki-67 (a-d, red) and Brdu (e-h, red) in Ctl and peri-infarct areas 22 days after PT stroke. Orthogonal images are represented in the x-z and y-z directions (i, j). (B) Counting studies of double positive cells of RECA1/Ki67 and BrdU/CD31 colabeling are shown in (a, b). Vascular density and volume between non-stroke Ctl and rTMS treated Ctl group showed no significant (N.S.) differences (c, d). Magnification: 40×, scale bar: 50 μm. Data represent mean±SE (N=5-8). *P < 0.05 versus Ctl group, #P < 0.05 versus PT stroke group without rTMS treatment.
Figure 6
Figure 6
rTMS treatment attenuated the apoptotic counts of existing and newborn endothelial cells in peri-infarct region examined at 6 and 22 days after PT stroke. (A) Representative confocal images of the peri-infract cortex in the PT group stained with RECA1 antibody (a-m, red), Ki67 antibody (d-h), BrdU antibody (i-m, blue) and TUNEL (a-m, green). Confocal orthogonal view of zoomed (inset) image is shown to the right of each panel, indicating the co-localization of RECA1, RECA1/Ki67, or RECA1/BrdU with TUNEL labeled cells. (B) The numbers of apoptosis of total endothelial cells (RECA1/TUNEL double labeled cells) and the newborn endothelial cells (RECA1/BrdU/TUNEL triple labeled cells) were counted and statistically analyzed. White scale bar: 20 μm, magnification: 40×. Data are presented as mean ± SE from 5-8 rats in each group. #P < 0.05 versus PT group without rTMS treatment.
Figure 7
Figure 7
rTMS treatment inhibited excessive astrocyte-vasculature interactions and induced vessel associated A1 to A2 switch of astrocytic phenotypes in the peri-infarct region examined at day 22 following PT stroke. (A) Representative confocal microscopy images showing GFAP staining (a-c,green) and RECA1 staining (a-c,red) within the peri-infarct cortex on day 22 after stroke. Images were further 3-D processed (projection and surface rendering of GFAP and RECA1) and analyzed with Bitplane Imaris (d-l), and the total astrocytic surface area (j), vessel associated astrocytic area (k) and different morphological volumes of astrocytes (l) are shown, respectively. (B) Representative double immunofluorescence staining and immunoactivity analyses of vessel associated C3d (a marker of the toxic A1 phenotype, a-c and g, red) and S100A10 (a marker of the protective A2 phenotype, d-f and h, red) in the peri-infarct brain regions 22 days after PT stroke. Magnification: 40×, scale bar: 50 μm. Data are presented as mean ± SE, n = 6-8 per group. *P < 0.05 versus Ctl, #P < 0.05 versus PT control group without rTMS treatment.
Figure 8
Figure 8
rTMS treatment elevated PDGFRb expression associated with microvasculature and in the A2-type astrocytes in peri-infarct region examined at day 22 after PT stroke. (A) Typical confocal microscopy images of PDGFRb (green), RECA1 (red) and S100A10 (blue, A2 phenotype marker) staining in the peri-infarct area 22 days following PT stroke (a-i). Using Imaris software, rTMS-treated group in the boxed region (i) was subjected to 3-D projection and surface rendering (j, green: PDGFRb, red: RECA1), and the vessel associated PDGFRb levels were analyzed and compared (k). (B) Representative Western blots (a) and quantitative analyses (b) of PDGFRb expression using protein samples from the peri-infarct brain region at day 22 after PT stroke. Magnification: 40×, scale bar: 50 μm. Data are presented as mean ± SE from 5-8 animals in each group. *P < 0.05 versus Ctl, #P < 0.05 versus PT control group without rTMS treatment.
Figure 9
Figure 9
rTMS treatment promoted post-ischemic vasculature expression of VEGF and TGFβ in A2-type astrocytes and the association with functional vasculature. (A) Confocal images of S100A10 (green, A2 phenotype marker) and VEGF (red) revealing vascular expression (f, i, white arrows) of VEGF in A2 type astrocytes (merged yellow color) in the peri-infarct area 22 days after stroke. Quantitative analysis of VEGF immunointensity in Ctl, PT and rTMS groups (a-i) was performed and are shown in (j). (B) Representative confocal images showing FITC-dextran perfused blood vessels surrounded by A2 astrocytic VEGF distribution (a-c, note merged purple color) in the rTMS group. Imaris-aided 3D reconstruction showing tight association of A2-type astrocytes and VEGF distribution along with functional micro-vessels (d,e). (C) Representative confocal microscopy of vasculature labeled with TGFβ (a-c, red) and S100A10 (a-c, green) in the post-ischemic peri-infarct areas with rTMS treatment. Western blotting and data analyses of TGFβ and VEGF using peri-infarct protein samples 22 days after PT stroke (d). Magnification: 40×, scale bar: 50 μm. Data represent mean±SE (N = 5-8 in A & B, and N = 4-6 in C). *P < 0.05 versus Ctl. #P <0.05 versus PT group without rTMS treatment.
Figure 10
Figure 10
rTMS treatment promoted vasculature expression of HIF-1α in the peri-infarct region examined at 22 days after PT stroke. (A) Typical confocal microscopy images of RECA1 (a-d, red) and HIF-1α (a-d, green) staining in the peri-infarct cortical area showing HIF-1α expression profiles. Orthogonal view of zoomed (small inset in c) image showed in the right panel (d) revealing that HIF-1α expression is localized in the vasculature. rTMS-treated group in the boxed region (large inset in c) was further processed using Imaris software, and HIF-1α spatial relationship with vasculature are shown in (e). The vessel associated HIF-1α levels from each group were analyzed and compared with the aid of Imaris software (f). (B) Western blotting (a) and quantitative analyses (b) of HIF-1α expression in the peri-infarct protein samples 22 days after stroke. Magnification: 40×, scale bar: 50 μm. Data are mean ± SE (N = 5-8 in A and N = 4-6 in B). *P < 0.05 versus Ctl, #P < 0.05 versus PT control group without rTMS treatment. (C) Schematic summary of the beneficial effects of rTMS therapy and the postulated underlying mechanisms of rTMS treatment in improving vascular protection, angiogenesis and finally, vascular function (see manuscript for detailed description).
Figure 11
Figure 11
rTMS treatment preserved neuronal morphology, synaptic structure integrity, and behavioral outcome 22 days after PT stroke. (A) Immunofluorescence staining of NeuN and myelin basic protein (MBP) was performed. Histological analysis showed rTMS increased staining for NeuN and MBP and decreased MBP dispersion in the peri-infarct area. (B) Representative fluorescence co-staining of the markers of presynaptic synaptophysin (red), dendritic spinophilin (green), and DAPI (blue), and a typical Imaris-rendered image in the peri-infarct area 22 days after PT stroke (a). Graphs represent fluorescence profiles displaying immunointensities and co-localization between the two stained pre/postsynaptic granules (b). (C) Functional performance of rats was measured by grip strength test and left-biased swing test 22 days after PT stroke (d). Magnification: 40×, scale bar: 50 μm. Data represent mean ± SE (N = 4-6 in A & B, and N = 6-8 in C). *P < 0.05 versus Ctl. #P <0.05 versus PT group without rTMS treatment.

Similar articles

Cited by

References

    1. Benjamin EJ, Muntner P, Alonso A, Bittencourt MS, Callaway CW, Carson AP. et al. Heart Disease and Stroke Statistics-2019 Update: A Report From the American Heart Association. Circulation. 2019;139:e56–e528. - PubMed
    1. Shu L, Chen B, Xu H, Wang G, Huang Y, Zhao Y. et al. Brain ischemic insult induces cofilin rod formation leading to synaptic dysfunction in neurons. J Cereb Blood Flow Metab. 2019;39:2181–95. - PMC - PubMed
    1. Derex L, Cho TH. Mechanical thrombectomy in acute ischemic stroke. Rev Neurol (Paris) 2017;173:106–13. - PubMed
    1. Akbar M, Essa MM, Daradkeh G, Abdelmegeed MA, Choi Y, Mahmood L. et al. Mitochondrial dysfunction and cell death in neurodegenerative diseases through nitroxidative stress. Brain Res. 2016;1637:34–55. - PMC - PubMed
    1. Hofmeijer J, van Putten MJ. Ischemic cerebral damage: an appraisal of synaptic failure. Stroke. 2012;43:607–15. - PubMed

Publication types