

Genome-Wide Gene Expression Profiles Analysis Reveal Novel Insights into Drought Stress in Foxtail Millet (Setaria italica L.)
- PMID: 33198267
- PMCID: PMC7696101
- DOI: 10.3390/ijms21228520
Genome-Wide Gene Expression Profiles Analysis Reveal Novel Insights into Drought Stress in Foxtail Millet (Setaria italica L.)
Abstract
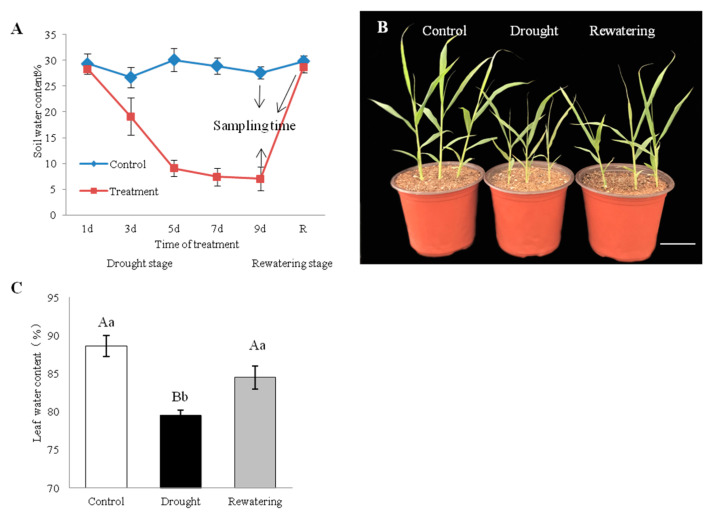
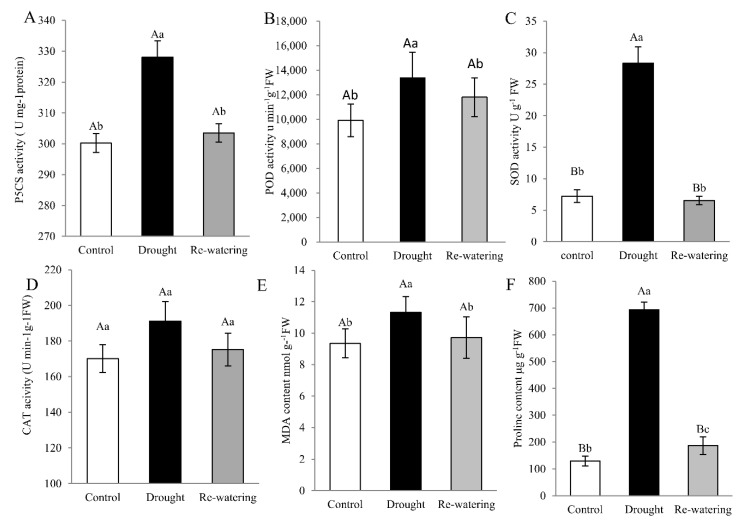
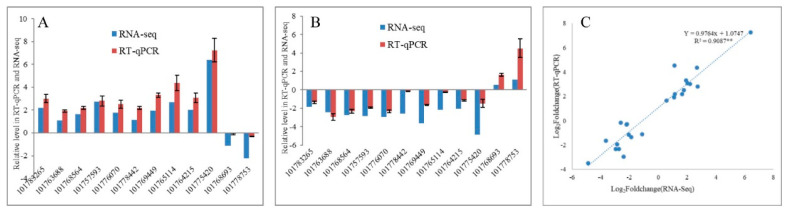
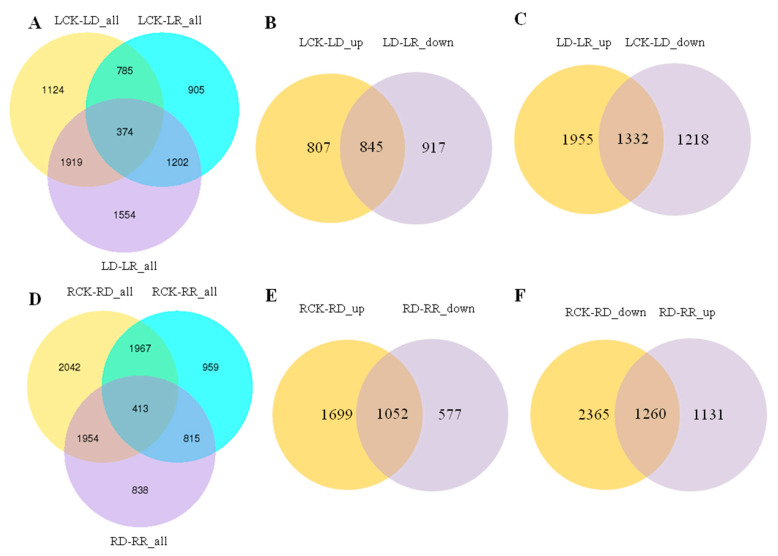
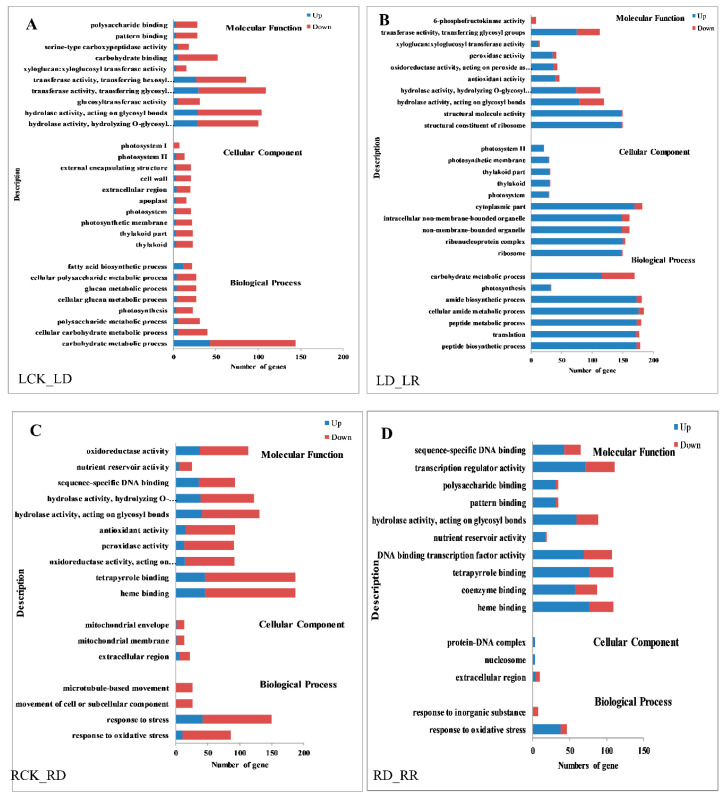
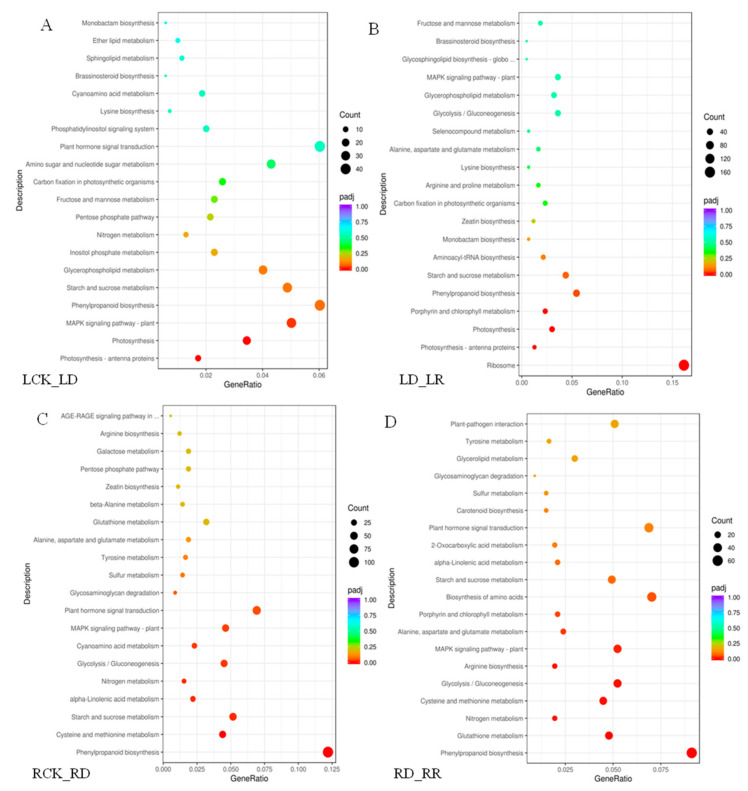
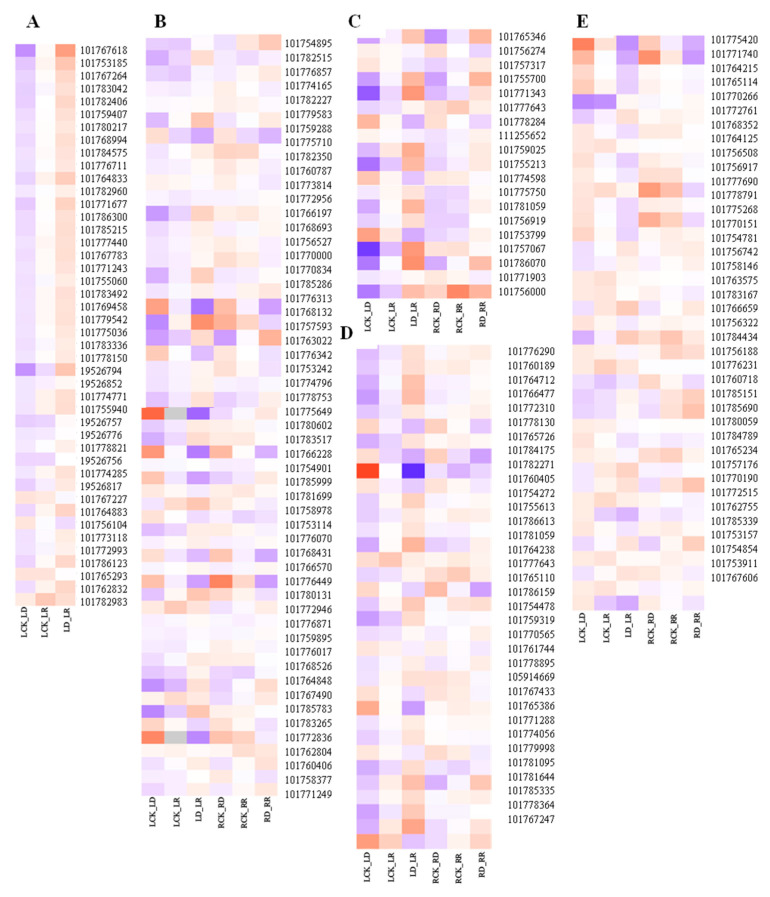
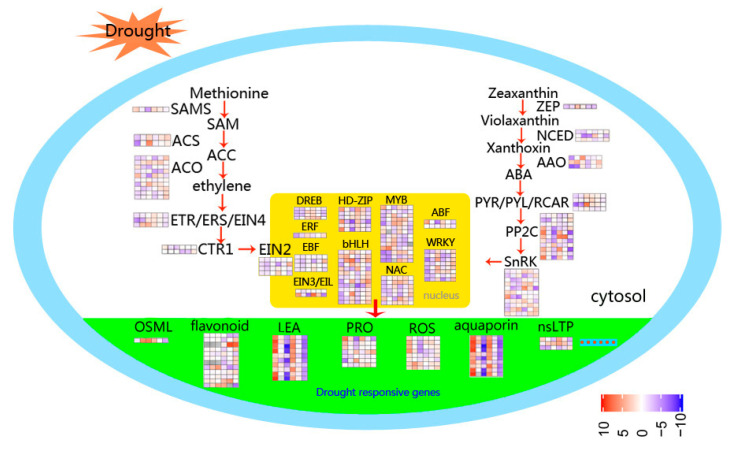
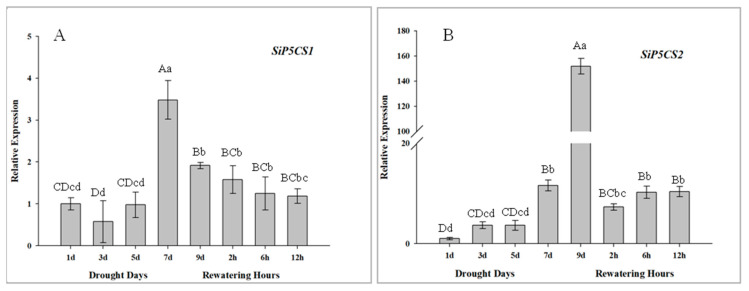
Foxtail millet (Setaria italica (L.) P. Beauv) is an important food and forage crop because of its health benefits and adaptation to drought stress; however, reports of transcriptomic analysis of genes responding to re-watering after drought stress in foxtail millet are rare. The present study evaluated physiological parameters, such as proline content, p5cs enzyme activity, anti-oxidation enzyme activities, and investigated gene expression patterns using RNA sequencing of the drought-tolerant foxtail millet variety (Jigu 16) treated with drought stress and rehydration. The results indicated that drought stress-responsive genes were related to many multiple metabolic processes, such as photosynthesis, signal transduction, phenylpropanoid biosynthesis, starch and sucrose metabolism, and osmotic adjustment. Furthermore, the Δ1-pyrroline-5-carboxylate synthetase genes, SiP5CS1 and SiP5CS2, were remarkably upregulated in foxtail millet under drought stress conditions. Foxtail millet can also recover well on rehydration after drought stress through gene regulation. Our data demonstrate that recovery on rehydration primarily involves proline metabolism, sugar metabolism, hormone signal transduction, water transport, and detoxification, plus reversal of the expression direction of most drought-responsive genes. Our results provided a detailed description of the comparative transcriptome response of foxtail millet variety Jigu 16 under drought and rehydration environments. Furthermore, we identify SiP5CS2 as an important gene likely involved in the drought tolerance of foxtail millet.
Keywords: P5CS genes; RNA sequencing; drought stress; foxtail millet; gene expression.
Conflict of interest statement
The authors declare no conflict of interest. The funders had no role in the design of the study; in the collection, analyses, or interpretation of data; in the writing of the manuscript, or in the decision to publish the results.
Figures
Similar articles
-
Physiological and Transcriptomic Analysis Provides Insights into Low Nitrogen Stress in Foxtail Millet (Setaria italica L.).Int J Mol Sci. 2023 Nov 14;24(22):16321. doi: 10.3390/ijms242216321. Int J Mol Sci. 2023. PMID: 38003509 Free PMC article.
-
Investigation of the ASR family in foxtail millet and the role of ASR1 in drought/oxidative stress tolerance.Plant Cell Rep. 2016 Jan;35(1):115-28. doi: 10.1007/s00299-015-1873-y. Epub 2015 Oct 6. Plant Cell Rep. 2016. PMID: 26441057
-
Transcriptome and metabolite analysis reveal the drought tolerance of foxtail millet significantly correlated with phenylpropanoids-related pathways during germination process under PEG stress.BMC Plant Biol. 2020 Jun 15;20(1):274. doi: 10.1186/s12870-020-02483-4. BMC Plant Biol. 2020. PMID: 32539796 Free PMC article.
-
Foxtail millet: a model crop for genetic and genomic studies in bioenergy grasses.Crit Rev Biotechnol. 2013 Sep;33(3):328-43. doi: 10.3109/07388551.2012.716809. Epub 2012 Sep 18. Crit Rev Biotechnol. 2013. PMID: 22985089 Review.
-
Adaptation of Foxtail Millet (Setaria italica L.) to Abiotic Stresses: A Special Perspective of Responses to Nitrogen and Phosphate Limitations.Front Plant Sci. 2020 Feb 28;11:187. doi: 10.3389/fpls.2020.00187. eCollection 2020. Front Plant Sci. 2020. PMID: 32184798 Free PMC article. Review.
Cited by
-
Transcriptome analysis and characteristics of drought resistance related genes in four varieties of foxtail millet [Setaria italica].Heliyon. 2024 Sep 19;10(18):e38083. doi: 10.1016/j.heliyon.2024.e38083. eCollection 2024 Sep 30. Heliyon. 2024. PMID: 39364255 Free PMC article.
-
Drought Responses in Poaceae: Exploring the Core Components of the ABA Signaling Pathway in Setaria italica and Setaria viridis.Plants (Basel). 2024 May 23;13(11):1451. doi: 10.3390/plants13111451. Plants (Basel). 2024. PMID: 38891260 Free PMC article.
-
Functional Characterization of the Stipa purpurea P5CS Gene under Drought Stress Conditions.Int J Mol Sci. 2021 Sep 4;22(17):9599. doi: 10.3390/ijms22179599. Int J Mol Sci. 2021. PMID: 34502515 Free PMC article.
-
Milletdb: a multi-omics database to accelerate the research of functional genomics and molecular breeding of millets.Plant Biotechnol J. 2023 Nov;21(11):2348-2357. doi: 10.1111/pbi.14136. Epub 2023 Aug 2. Plant Biotechnol J. 2023. PMID: 37530223 Free PMC article.
-
Physiological and Transcriptomic Analysis Provides Insights into Low Nitrogen Stress in Foxtail Millet (Setaria italica L.).Int J Mol Sci. 2023 Nov 14;24(22):16321. doi: 10.3390/ijms242216321. Int J Mol Sci. 2023. PMID: 38003509 Free PMC article.
References
-
- Gong Z., Xiong L., Shi H., Yang S., Zhu J.K. Plant abiotic stress response and nutrient use efficiency. Sci. China Life Sci. 2020;63:635–674. - PubMed
-
- Delauney A.J., Verma D.P.S. Proline biosynthesis and osmoregulation in plants. Plant J. 1993;4:215–223. doi: 10.1046/j.1365-313X.1993.04020215.x. - DOI
MeSH terms
Substances
Grants and funding
LinkOut - more resources
Full Text Sources
Miscellaneous
