. 2020 Oct 9:11:518949.
doi: 10.3389/fgene.2020.518949. eCollection 2020.

tRNA Fragments Populations Analysis in Mutants Affecting tRNAs Processing and tRNA Methylation

Affiliations

tRNA Fragments Populations Analysis in Mutants Affecting tRNAs Processing and tRNA Methylation

Anahi Molla-Herman et al. Front Genet. .

Abstract

tRNA fragments (tRFs) are a class of small non-coding RNAs (sncRNAs) derived from tRNAs. tRFs are highly abundant in many cell types including stem cells and cancer cells, and are found in all domains of life. Beyond translation control, tRFs have several functions ranging from transposon silencing to cell proliferation control. However, the analysis of tRFs presents specific challenges and their biogenesis is not well understood. They are very heterogeneous and highly modified by numerous post-transcriptional modifications. Here we describe a bioinformatic pipeline (tRFs-Galaxy) to study tRFs populations and shed light onto tRNA fragments biogenesis in Drosophila melanogaster. Indeed, we used small RNAs Illumina sequencing datasets extracted from wild type and mutant ovaries affecting two different highly conserved steps of tRNA biogenesis: 5'pre-tRNA processing (RNase-P subunit Rpp30) and tRNA 2'-O-methylation (dTrm7_34 and dTrm7_32). Using our pipeline, we show how defects in tRNA biogenesis affect nuclear and mitochondrial tRFs populations and other small non-coding RNAs biogenesis, such as small nucleolar RNAs (snoRNAs). This tRF analysis workflow will advance the current understanding of tRFs biogenesis, which is crucial to better comprehend tRFs roles and their implication in human pathology.

Keywords: Drosophila; Nm methylation; RNase P; oogenesis; tRFs; tRNA.


Figures

FIGURE 1
FIGURE 1
General workflow for tRNA fragments (tRFs) classes extraction: (A) tRNA processing and tRNA fragments are depicted. The 5′ tail of pre-tRNAs is cleaved by RNase P (blue arrowhead) and the 3′ tail is cleaved by RNase Z (green arrowhead). 5′ cleavage product is believed to be degraded whereas RNase Z cleavage product forms tRFs-1 (green line). Mature tRNAs (light gray line) is edited by the addition of 3′-tRFs motif (red dot). Several types of tRFs can be generated from mature RNAs, such as 5′-tRFs (light blue line), 3′-tRFs (dark blue line), and inner tRFs (i-tRFs) belonging to the anticodon region (dark gray lines). Spanner-tRFs can be formed before the addition of CCA from tRNA-precursors, spanning the CCA region (light brown line). Transcription associated (taRFs, orange line) can be formed from downstream regions of tRNAs. Longer tRNA halves are represented with light purple lines. (B) Galaxy-developed workflow for extraction of all tRFs classes, described in A. Alignments were done with SR_Bowtie tool for small RNA short reads (version 2.1.1) using two types of matching: Match on DNA as fast as possible or ¤ Match on DNA, multiple mappers. “Ref.” are the different genome references used for alignments in this pipeline: rRNA, snoRNA, tRNA-non-edited or tRNA-CCA-edited. For tRNA-non-edited reference construction, mature tRNAs (75 nt) were compared with tRNA-precursors (125 nt) to determine RNase P and RNase Z cleavage points. 25 nt were added upstream at 5′, and 80 nt downstream, right after the RNase Z cleavage point (25 + 75 + 80 = 180 nt approximately). For tRNA-CCA-edited reference construction, a CCA motif was added to the non-edited reference, precisely at the 3′CCA edition point (red dot). tRFs CCA or non-CCA can be treated separately or altogether (ALL-tRFs).
FIGURE 2
FIGURE 2
tRFs description in control Drosophila ovaries: (A) Small RNAs sequences from 15–29 nt were analyzed to distinguish different categories with the help of an annotation cascade tool in the following order: miRNA, ncRNA, intergenic, genes, TE (piRNA, siRNA), snoRNAs, tRFs-non-CCA or tRFs-CCA. The percentage of reads is shown in a pie-chart, which size reflects the bank’s depth (M = Millions of reads). (B) Nuclear and mitochondrial tRFs coverages of 15–29 nt tRFs were analyzed in white- control ovaries using scaling factors (see section “MATERIALS AND METHODS”). CCA edition point is shown with a red dot. The different types of tRFs are shown along the coverage profile from the beginning of the pre-tRNA molecule (TSS transcription start site) to the end of the extended edited genome reference (TES, transcription extended site). (C) General size distribution (15–29 nt) of normalized read counts corresponding to different categories of tRFs in white- control ovaries. Color-codes on the right are the same as in Figure 1B for tRFs categories. (D) Logo for the last 15 nt of white- tRFs sequences (all categories included, issued from fasta files). (E) Examples of tRFs readmap profiles in white- control ovaries originating from two different tRNAs. Red peaks reflect read counts (using scaling factors). The position of the peak along the edited tRNA reference genome reflects the beginning of the reads sequences. 0: beginning of the pre-tRNA. 100: position of RNase Z cleavage. 5′-tRFs are in light blue, 3′-tRFs are in dark blue, tRFs-1 are in green.
FIGURE 3
FIGURE 3
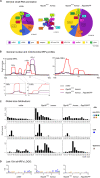
tRNA processing plays a role in nuclear and mitochondrial tRFs formation: (A) Small RNAs sequences (from 15–29 nt) were analyzed in different genotypes to distinguish categories with the help of an annotation cascade tool in the following order: miRNA, ncRNA, intergenic, genes, TE (piRNA, siRNA), snoRNAs, tRFs-non-CCA or tRFs-CCA. The percentage of reads for each genotype is shown in pie-charts, which size reflects the depth of each bank (M = Millions of reads). (B) Nuclear and mitochondrial tRFs coverages were analyzed in white- control and Rpp30 mutant ovaries using scaling factors (see section “MATERIALS AND METHODS”). Different tRFs are shown along the coverage profile from the beginning of the pre-tRNA molecule (TSS transcription start site) to the end of the extended edited reference genome (TES, transcription extended site). CCA edition point is shown with a red dot. 5′-tRFs and 3′-tRFs regions are zoomed in, for a better comparison between the genotypes. (C) General size distribution (15–29 nt) of normalized read counts corresponding to the different categories of tRFs in white- control and mutant ovaries. Color-codes on the right are the same as in Figure 1B for tRFs categories. (D) Logo for the last 15 nt tRFs sequences of white- control and mutant ovaries (all categories included, issued from fasta files containing all tRFs sequences).
FIGURE 4
FIGURE 4
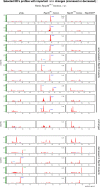
Rpp30 mutation leads to an increase of 5′-tRFs, an increase of 3′-tRFs and a decrease of tRFs-1. 16 tRFs readmap profiles as examples of the most increased or decreased tRFs from the ratio Rpp3018.2 homoz./white- (see in Supplementary Figure 2B) are shown for the different genotypes, using normalizing factors (see section “MATERIALS AND METHODS”). Since pre-tRNAs sequences are included in the tRNA reference genome, 5′-tRFs start at position 25 nt instead of position 0 nt. 3′-tRFs are located around the position 80 nt and tRFs-1 are located around position 100 nt (positions can vary depending on tRNA lengths and the presence of intron). Peaks determine the beginning of the reads sequences. tRFs are schematized in white- and Rpp3018.2 homozygous for better comparison: 5′-tRFs in light blue, 3′-tRFs in dark blue and tRFs-1 in green. Ratio’s values above 1 (upper pannels): tRFs increased in Rpp3018.2 mutants. Ratio’s values below 1 (lower panels): tRFs decreased in Rpp3018.2 mutants.
FIGURE 5
FIGURE 5
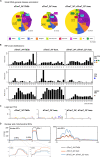
tRNAs methylation defects alter nuclear and mitochondrial tRFs formation: (A) Small RNAs sequences from 15–29 nt were analyzed in different genotypes to distinguish different categories with the help of an annotation cascade tool in the following order: miRNA, ncRNA, intergenic, genes, TE (piRNA, siRNA), snoRNAs, tRFs-non-CCA or tRFs-CCA. The percentages of reads from dTrm7_34 heterozygous, dTrm7_34 homozygous and dTrm7_34, dTrm7_32 double mutant ovaries are shown in pie-charts. The pie-charts size reflects the depth of the bank (M = Millions of reads). (B) General size distribution (15–29 nt) of normalized read counts corresponding to the different categories of tRFs in different genotypes using scaling factors (see section “MATERIALS AND METHODS”). Color-codes for the tRFs categories on the right are described in Figure 1B. (C) Logo for the last 15 nt tRFs sequences of control and mutant ovaries (all categories included, issued from fasta files). (D) Nuclear and mitochondrial tRFs coverages were analyzed in different genotypes using scaling factors (see section “MATERIALS AND METHODS”). Different types of tRFs are shown along the coverage profile from the beginning of pre-tRNA (TSS transcription start site) to the end of the extended edited reference genome (TES, transcription extended site). CCA edition point is shown with a red dot. 5′-tRFs and 3′-tRFs regions are zoomed in for better comparison between the genotypes.
FIGURE 6
FIGURE 6
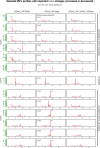
tRFs expression is altered in tRNA methylation mutants: 13 tRFs readmap profiles as examples of the most increased or decreased tRFs from the ratio dTrm7_34 homozygous/heterozygous (see in Supplementary Figure 4B) are shown for the different genotypes, using normalizing factors (see section “MATERIALS AND METHODS”). Since pre-tRNAs sequences are included in the tRNA reference genome, 5′-tRFs start at position 25 nt instead of position 0 nt. 3′-tRFs are located around the position 80 nt and tRFs-1 are located around position 100 nt, depending on tRNA lengths and the presence of intron. Peaks determine the beginning of the reads sequences. tRFs are schematized in dTrm7_34 homozygous and heterozygous mutants for better comparison: 5′-tRFs in light blue, 3′-tRFs in dark blue and tRFs-1 in green. Ratio’s values above 1 (lower panels): tRFs increased in dTrm7_34 homozygous mutants. Ratio’s values below 1 (upper panels): tRFs decreased in dTrm7_34 homozygous mutants.
FIGURE 7
FIGURE 7
tRNA processing and methylation defects impact on tRFs biogenesis: The main steps of tRNA processing are depicted. Cleavage sites for ribozymes RNase P and Z are indicated on a pre-tRNA molecule. Cleavage of the 3′ trailer forms tRFs-1 (green). Upon cleavage of the leader and trailer sequences and CCA addition (dark gray), yielding mature tRNAs, they can be cleaved at the D-loop, forming the tRFs 5′ (light blue) and at the T-loop, forming 3′-tRFs. 2′O-methylation sites for dTrm7_32 and dTrm7_34 are shown at the anticodon loop. Increase or decrease of different tRFs populations in mutants for tRNA processing or tRNA methylation are schematized with arrows of different sizes (↑, increased, ↓, decreased).

Similar articles

Cited by

References

    1. Akiyama Y., Kharel P., Abe T., Anderson P., Ivanov P. (2020). Isolation and initial structure-functional characterization of endogenous tRNA-derived stress-induced RNAs. RNA Biol. 17 1116–1124. 10.1080/15476286.2020.1732702 - DOI - PMC - PubMed
    1. Angelova M. T., Dimitrova D. G., Da Silva B., Marchand V., Jacquier C., Achour C., et al. (2020). tRNA 2′-O-methylation by a duo of TRM7/FTSJ1 proteins modulates small RNA silencing in Drosophila. Nucl. Acids Res. 48 2050–2072. - PMC - PubMed
    1. Angelova M. T., Dimitrova D. G., Dinges N., Lence T., Worpenberg L., Carré C., et al. (2018). The emerging field of epitranscriptomics in neurodevelopmental and neuronal disorders. Front. Bioeng. Biotech. 6:46 10.3389/fbioe.2018.00046 - DOI - PMC - PubMed
    1. Angrisani A., Tafer H., Stadler P. F., Furia M. (2015). Developmentally regulated expression and expression strategies of Drosophila snoRNAs. Insect. Biochem. Mol. Biol. 61 69–78. 10.1016/j.ibmb.2015.01.013 - DOI - PubMed
    1. Balatti V., Nigita G., Veneziano D., Drusco A., Stein G. S., Messier T. L., et al. (2017). tsRNA signatures in cancer. Proc. Natl. Acad. Sci. U.S.A. 114 8071–8076. - PMC - PubMed

LinkOut - more resources