. 2020 Oct 19:11:563320.
doi: 10.3389/fmicb.2020.563320. eCollection 2020.

Priming Astrocytes With HIV-Induced Reactive Oxygen Species Enhances Their Trypanosoma cruzi Infection

Affiliations

Priming Astrocytes With HIV-Induced Reactive Oxygen Species Enhances Their Trypanosoma cruzi Infection

Javier Urquiza et al. Front Microbiol. .

Abstract

Introduction: Trypanosoma cruzi is an intracellular protozoa and etiological agent that causes Chagas disease. Its presence among the immunocompromised HIV-infected individuals is relevant worldwide because of its impact on the central nervous system (CNS) causing severe meningoencephalitis. The HIV infection of astrocytes - the most abundant cells in the brain, where the parasite can also be hosted - being able to modify reactive oxygen species (ROS) could influence the parasite growth. In such interaction, extracellular vesicles (EVs) shed from trypomastigotes may alter the surrounding environment including its pro-oxidant status. Methods: We evaluated the interplay between both pathogens in human astrocytes and its consequences on the host cell pro-oxidant condition self-propitiated by the parasite - using its EVs - or by HIV infection. For this goal, we challenged cultured human primary astrocytes with both pathogens and the efficiency of infection and multiplication were measured by microscopy and flow cytometry and parasite DNA quantification. Mitochondrial and cellular ROS levels were measured by flow cytometry in the presence or not of scavengers with a concomitant evaluation of the cellular apoptosis level. Results: We observed that increased mitochondrial and cellular ROS production boosted significantly T. cruzi infection and multiplication in astrocytes. Such oxidative condition was promoted by free trypomastigotes-derived EVs as well as by HIV infection. Conclusions: The pathogenesis of the HIV-T. cruzi coinfection in astrocytes leads to an oxidative misbalance as a key mechanism, which exacerbates ROS generation and promotes positive feedback to parasite growth in the CNS.

Keywords: Trypanosoma cruzi; astrocytes; extracellular vesicles; human immunodeficiency virus; reactive oxygen species.


Figures

Figure 1
Figure 1
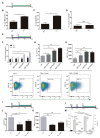
Effect of Trypanosoma cruzi infection on astrocyte ROS level and its consequences on parasite infection and multiplication. (A) Timeline of the Tc infection of cultured human astrocytes. Parameters were measured at T1 (orange arrow, 24 h after Tc exposure). (B) mROS level was measured by flow cytometry using MitoSOX in uninfected astrocytes – Ctrl – and Tc-infected astrocytes. (C) cROS level was measured by flow cytometry using DCFDA (assumed to be proportional to the concentration of hydrogen peroxide) in uninfected astrocytes – Ctrl – and Tc-infected astrocytes. (D) Cell death levels (positive staining for annexin-V and 7-AAD) in uninfected (Ctrl) and Tc-infected astrocytes analyzed by flow cytometry. (E) Timeline of the exposure of cultured astrocytes to tert-Butyl hydroperoxide (TBH; blue arrow) followed by Tc infection (green arrow, 1 h after TBH-exposure). Parameters were measured at T3 (orange arrow, 48 h after Tc exposure). (F) Cell death levels by flow cytometry (positive staining for annexin-V and 7-AAD) in unexposed (Ctrl) and TBH-exposed cells (at increasing concentrations as indicated), in non-infected (black columns) and Tc-infected (gray columns) astrocytes. (G) Tc-infection rate analysis in unexposed (Ctrl) and TBH-exposed cells (at increasing concentrations as indicated). Three representative dot plots representation are shown. For each diagram, a square depicted the percentage of Tc-infected cells (GFP-positive). (H) Tc-multiplication quantification by flow cytometry as mean fluorescence intensity (MFI, expressed in arbitrary units) in unexposed (Ctrl) and TBH-exposed cells (at increasing concentrations as indicated). (I) Timeline of the exposure of cultured astrocytes to ROS scavengers (MT: MitoTEMPO; AA: ascorbic acid; blue arrow) followed by Tc infection (green arrow, 18 h after scavengers exposure). Parameters were measured at T3 (orange arrow, 48 h after Tc exposure). (J) Tc-infection rate analysis in non-scavenged and scavenged (with MT, or AA) T. cruzi-infected cells. (K) Tc-multiplication quantification by flow cytometry as MFI in non-scavenged and scavenged (with MT, or AA) T. cruzi-infected cells. (L) Timeline of the exposure of cultured astrocytes to pro-oxidant condition (TBH, 100 μM during 1 h), ROS scavenging (AA: ascorbic acid), and Tc infection (green arrow, 18 h after AA exposure). Parameters were measured at T3 (orange arrow, 48 h after Tc exposure). (M) Astrocyte ROS level (% cell DCFDA+) and Tc infection rate (% cell Tc+) analysis in control and TBH-treated astrocytes, with and without scavenging (AA). Graphics are showing values obtained from three independent experiments. Data are given as the mean ± SD. NS (not significant), *p < 0.05, **p < 0.01, and ***p < 0.001.
Figure 2
Figure 2
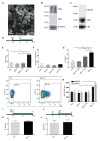
Effect of trypomastigotes-derived extracellular vesicles (EVs) in astrocytes ROS concentration and Trypanosoma cruzi infection. (A) Scanning electron microscopy (SEM) showing clusters of trypomastigotes-derived EVs formed by ultracentrifugation. The bar size is indicated. (B) Biochemical characterization of EVs purified from trypomastigotes by western blot to verify the presence of SAPA (shed acute-phase antigen) and Tc-TASV-C antigens and the absence of SR62 (T. cruzi cytoplasmic antigen). (C) Biochemical characterization of EVs purified from astrocytes. The presence of CD63, CD9, and absence of calnexin was determined by western blot from astrocyte-derived EVs. (D) Timeline of the EVs exposure (blue arrow) in cultured astrocytes followed by Tc infection (green arrow, 24 h after EVs exposure). Parameters were measured at T3 (orange arrow, 48 h after Tc exposure). (E) Tc-infection rate measured as GFP+ cells analysis in EVs non-exposed astrocytes followed by Tc infection (Tc), and EVs-exposed cells [EVs from normal astrocytes (EVs A), Tc-infected astrocytes (EVs A/Tc), and EVs from free trypomastigotes (EVs Tc)]. Two representative dot plots obtained by flow cytometry showing EVs non-exposed astrocytes (Ctrl, left panel) and EVs (from trypomastigotes) exposed-astrocytes (EVs-Tc, right panel). In each diagram, a square depicted the percentage of Tc-infected cells (GFP-positive). (F) Astrocyte death levels (measured as positive staining for annexin-V and 7-AAD) in EVs non-exposed astrocytes followed by Tc infection (Ctrl), and EVs-exposed cells [with EVs obtained from cell sources defined in item (E)]. (G) Tc-infection rate measured as GFP+ cells analysis in EVs from free trypomastigotes (EVs Tc) at dilutions 1/100 (0.06 μg/well), 1/10 (0.6 μg/well), and pure (6 μ/well). (H) Cellular and mitochondrial ROS level (using DCFDA – represented in gray columns and MitoTEMPO – represented in black columns, respectively) as MFI, in astrocytes (exposed to EVs from sources described in E). (I) Timeline of the EVs exposure (blue arrow) in cultured astrocytes simultaneously infected with Tc (green arrow). Parameters were measured at T2 (orange arrow, 48 h after Tc + EVs exposure). (J) Timeline of the cultured astrocytes infected with Tc (green arrow) and stimulated with EVs (blue arrow, 24 h after Tc exposure). Parameters were measured at T3 (orange arrow, 48 h after EVs exposure). (K) Tc-infection rate measured as GFP+ cells analysis in EVs non-exposed astrocytes but Tc-infected (Ctrl), and EVs from free trypomastigotes-exposed cells simultaneously with Tc infection. (L) Tc-infection rate measured as GFP+ cells in EVs non-exposed astrocytes but Tc-infected (Ctrl), and EVs from free trypomastigotes-exposed cells after infection with Tc. Graphics are showing values obtained from three independent experiments. Data are given as the mean ± SD Significant differences are indicated by *p < 0.05, **p < 0.01, and ***p < 0.001, respectively.
Figure 3
Figure 3
Effect of HIV infection of astrocytes on Trypanosoma cruzi infection and multiplication. (A) Timeline of the HIV (T0, blue arrow) and Tc (T2 green arrow, after 48 h of HIV exposure) infection of cultured human astrocytes. Parameters were measured at T3 (orange arrow, 24 h after Tc exposure). (B) Effect of HIV pre-infection of astrocytes on the Tc-infection rate measured by flow cytometry analysis as percentages of GFP+ cells. (C) Histogram example of the quantitative analysis of Tc-GFP positive cells proportion and MFI measured by flow cytometry. The x-axis represents the fluorescent signal intensity, and y-axis the normalized cell number expressed as a percentage of the maximum. (D) Relationship between the geometric mean of MFI of Tc-GFP positive cells in Tc infection (Tc), and astrocytes infected by HIV and superinfected by Tc (HIV/Tc). (E) Measurement of variation in the Tc DNA level (as fold change) by qPCR in astrocytes only infected by Tc (Tc), and in astrocytes infected by HIV at first and superinfected by Tc (HIV/Tc). (F) Measurement by flow cytometry of HIV (black), Tc (dark gray), and HIV + Tc (light gray)-infected astrocytes by determining the frequencies of HIV-GFP+, Tc-DsRED+, and HIV-GFP+/Tc-DsRED+ cells. (G) A representative dot plot diagram obtained by flow cytometry during Tc and/or HIV infection quantification of cultured astrocytes is shown. (H) Fluorescence microscopy showing Tc (Red: K98-Alexa fluor 647-labeled intracellular amastigotes) and/or HIV (Green: p24 FITC-labeled) infected-primary human astrocytes. Cell and parasite nucleus were stained by DAPI (blue). Graphics are showing values obtained from three independent experiments. Data are given as the mean ± SD Significant differences are indicated by *p < 0.05, **p < 0.01, and ***p < 0.001, respectively.
Figure 4
Figure 4
Role of HIV-induced ROS on Trypanosoma cruzi infection and multiplication in astrocytes. (A) Timeline of the HIV exposure (blue arrow) of cultured astrocytes followed by Tc infection (green arrow, 48 h after HIV exposure). Parameters were measured at T3 (orange arrow, 24 h after Tc exposure). (B) Cellular ROS levels (as a percentage of DCFDA-positive cells, on left y-axis) and HIV infection efficiency (measured by flow cytometry as a percentage of GFP-positive cells, on the right y-axis) using two different inoculums at T0 (+: 8 μg/ml, ++: 80 μg/ml of p24 antigen). (C) Tc-infection rate measured by flow cytometry analysis in HIV non-exposed (Tc) and HIV-exposed cells (at the two inoculums indicated as HIV+/Tc and HIV++/Tc). (D) Tc-multiplication quantification by flow cytometry as mean fluorescence intensity (MFI, expressed in arbitrary units) in HIV non-exposed (Tc) and HIV-exposed astrocytes (at the two inoculums indicated as HIV+/Tc and HIV++/Tc). (E) Timeline of the HIV exposure (blue arrow) of cultured astrocytes followed by scavenging (MT: MitoTEMPO; AA: ascorbic acid; violet arrow, 24 h after HIV exposure), and Tc infection (green arrow, 48 h after HIV exposure). Parameters were measured at T3 (orange arrow, 24 h after Tc exposure). (F) Tc-infection rate measured by flow cytometry analysis in HIV non-exposed astrocytes followed by Tc infection (Tc) and in HIV-exposed cells (at the two inoculums as indicated), then scavenged (with MT, or AA), and finally exposed to Tc. A control without pretreatment with scavengers is included (HIV + Tc). Graphics are showing values obtained from three independent experiments. Data are given as the mean ± SD Significant differences are indicated by *p < 0.05, **p < 0.01, and ***p < 0.001, respectively.
Figure 5
Figure 5
The infection and multiplication of Trypanosoma cruzi in astrocytes is influenced by reactive oxygen species (ROS) generated during its infection or by prior HIV exposure.

Similar articles

Cited by

References

    1. Aguiar P. H., Furtado C., Repoles B. M., Ribeiro G. A., Mendes I. C., Peloso E. F., et al. . (2013). Oxidative stress and DNA lesions: the role of 8-oxoguanine lesions in Trypanosoma cruzi cell viability. PLoS Negl. Trop. Dis. 7:e2279. 10.1371/journal.pntd.0002279, PMID: - DOI - PMC - PubMed
    1. Allen G. F., Toth R., James J., Ganley I. G. (2013). Loss of iron triggers PINK1/parkin-independent mitophagy. EMBO Rep. 14, 1127–1135. 10.1038/embor.2013.168, PMID: - DOI - PMC - PubMed
    1. Andersen H. H., Johnsen K. B., Moos T. (2014). Iron deposits in the chronically inflamed central nervous system and contributes to neurodegeneration. Cell. Mol. Life Sci. 71, 1607–1622. 10.1007/s00018-013-1509-8, PMID: - DOI - PMC - PubMed
    1. Arantes J. M., Pedrosa M. L., Martins H. R., Veloso V. M., de Lana M., Bahia M. T., et al. . (2007). Trypanosoma cruzi: treatment with the iron chelator desferrioxamine reduces parasitemia and mortality in experimentally infected mice. Exp. Parasitol. 117, 43–50. 10.1016/j.exppara.2007.03.006, PMID: - DOI - PubMed
    1. Barat C., Proust A., Deshiere A., Leboeuf M., Drouin J., Tremblay M. J. (2018). Astrocytes sustain long-term productive HIV-1 infection without establishment of reactivable viral latency. Glia 66, 1363–1381. 10.1002/glia.23310, PMID: - DOI - PubMed

LinkOut - more resources