. 2021 Feb;19(2):301-316.
doi: 10.1158/1541-7786.MCR-20-0314. Epub 2020 Nov 13.

SLX4IP Promotes Telomere Maintenance in Androgen Receptor-Independent Castration-Resistant Prostate Cancer through ALT-like Telomeric PML Localization

Affiliations

SLX4IP Promotes Telomere Maintenance in Androgen Receptor-Independent Castration-Resistant Prostate Cancer through ALT-like Telomeric PML Localization

Tawna L Mangosh et al. Mol Cancer Res. 2021 Feb.

Abstract

In advanced prostate cancer, resistance to androgen deprivation therapy is achieved through numerous mechanisms, including loss of the androgen receptor (AR) allowing for AR-independent growth. Therapeutic options are limited for AR-independent castration-resistant prostate cancer (CRPC), and defining mechanisms critical for survival is of utmost importance for targeting this lethal disease. Our studies focus on identifying telomere maintenance mechanism (TMM) hallmarks adopted by CRPC to promote survival. TMMs are responsible for telomere elongation to instill replicative immortality and prevent senescence, with the two TMM pathways available being telomerase and alternative lengthening of telomeres (ALT). Here, we show that AR-independent CRPC demonstrates an atypical ALT-like phenotype with variable telomerase expression and activity, whereas AR-dependent models lack discernible ALT hallmarks. In addition, AR-independent CRPC cells exhibited elevated levels of SLX4IP, a protein implicated in promoting ALT. SLX4IP overexpression in AR-dependent C4-2B cells promoted an ALT-like phenotype and telomere maintenance. SLX4IP knockdown in AR-independent DU145 and PC-3 cells led to ALT-like hallmark reduction, telomere shortening, and induction of senescence. In PC-3 xenografts, this effect translated to reduced tumor volume. Using an in vitro model of AR-independent progression, loss of AR in AR-dependent C4-2B cells promoted an atypical ALT-like phenotype in an SLX4IP-dependent manner. Insufficient SLX4IP expression diminished ALT-like hallmarks and resulted in accelerated telomere loss and senescence. IMPLICATIONS: This study demonstrates a unique reliance of AR-independent CRPC on SLX4IP-mediated ALT-like hallmarks and loss of these hallmarks induces telomere shortening and senescence, thereby impairing replicative immortality.


Figures

Figure 1.
Figure 1.
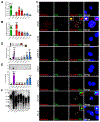
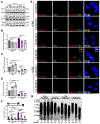
Identification of atypical ALT phenotype in AR-independent CRPC in vitro. Relative TERT mRNA expression (A) and telomerase activity (B) across CRPC cell lines. C4-2B, CWR-R1, and 22Rv1 retain AR expression (red) and DU145 and PC-3 exhibit AR loss (blue). ALT-positive U2OS (purple), telomerase-positive HCT116 (green), and telomerase-positive LAPC4 cells retaining AR expression (gray) were included as controls. All groups were compared with U2OS control. C, Representative IF-FISH images demonstrating the presence (arrowheads) or absence of PML (green) at telomeres (red) with zoom insets provided. Scale bar, 5 μm. D, Quantification of C for percent positive cells with at least one APB. Cells lacking APBs were quantified for ALT-like PML localization events. Representative foci are included defining these events. All groups were compared with HCT116 control. E, Representative dot blot demonstrating the presence of telomeric C-circles. Φ+ lane indicates reactions with Φ29 polymerase and Φ− lane indicates control reaction. Quantification of C-circle abundance, defined as the signal ratio of Φ+ to Φ− reaction is shown below. Dotted line at y = 2 indicates threshold suggesting ALT activity. All groups were compared with HCT116 control. F, TRF analysis demonstrating average telomere length across cell lines. Data represented as mean ± SD; n = 3 (*, P < 0.05; **, P < 0.01; ***, P < 0.001; ****, P < 0.0001). ns, not significant.
Figure 2.
Figure 2.
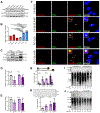
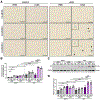
SLX4IP promotes ALT-like PML localization events in CRPC in vitro. A, ATRX and SLX4IP protein expression across CRPC cell lines. B, Quantification of SLX4IP expression in A. C, Confirmation of stable SLX4IP overexpression in C4-2B and PC-3 cells. EV, empty vector. Relative TERT mRNA expression (D) and telomerase activity (E) following stable SLX4IP overexpression in C4-2B and PC-3 cells. F, Representative IF-FISH images demonstrating the presence (arrowheads) or absence of PML (green) at telomeres (red), with zoom insets provided. Scale bar, 5 μm. G, Quantification of F for percent positive cells with at least one APB. Cells lacking typical APBs were quantified for ALT-like PML localization events. Representative foci are included defining these events. H, Representative dot blot demonstrating the presence of telomeric C-circles in C4-2B and PC-3 cells with SLX4IP overexpression. Φ+ lane indicates reactions with Φ29 polymerase and Φ− lane indicates control reaction. Telomerase-positive HCT116 (−) and ALT-positive WI-38 VA-13 (+) cells were included as controls. Quantification of C-circle abundance, defined as the signal ratio of Φ+ to Φ− reaction is shown below. Dotted line at y = 2 indicates threshold signal ratio suggesting ALT activity. TRF analysis demonstrating telomere length changes over 45 days in C4-2B (I) and PC-3 (J) cells overexpressing SLX4IP versus control. PD, calculated PDs. Data represented as mean ± SD; n = 3 (*, P < 0.05; **, P < 0.01; ***, P < 0.001; ****, P < 0.0001). ns, not significant.
Figure 3.
Figure 3.
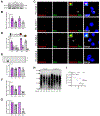
SLX4IP knockdown is accompanied by disappearance of ALT-like PML localization events and accelerated telomere shortening. A, Confirmation of stable SLX4IP knockdown using two shRNAs (KD.1 and KD.2) in PC-3 cells with scrambled shRNA control (NS) at the protein level. B, Quantification of A. C, Representative IF-FISH images demonstrating the presence (arrowheads) or absence of PML (green) at telomeres (red), with zoom insets provided. Scale bar, 5 μm. D, Quantification of C for percent positive cells with at least one APB. Cells lacking typical APBs were quantified for ALT-like PML localization events. Representative foci are included defining these events. E, Representative dot blot demonstrating the presence of telomeric C-circles. Φ+ lane indicates reactions with Φ29 polymerase and Φ− lane indicates control reaction. Telomerase-positive HCT116 (−) and ALT-positive U2OS (+) cells were included as controls. Quantification of C-circle abundance, defined as the signal ratio of Φ+ to Φ− reaction is shown below. Dotted line at y = 2 indicates threshold signal ratio suggesting ALT activity. Relative TERT mRNA expression (F) and telomerase activity (G) following stable SLX4IP knockdown in PC-3 cells. H, TRF analysis demonstrating telomere length changes over 45 days in PC-3 cells with SLX4IP knockdown (KD.1) versus control (NS.1). PD, Calculated PDs. I, Telomere length changes over time measured via PDs from H. Simple linear regression models are depicted by dotted lines and slopes reported as bp/PD. Hexagon data points represent 45-day timepoints. Data represented as mean + SD; n = 3 (*, P < 0.05; **, P < 0.01; ***, P < 0.001; ****, P < 0.0001). ns, not significant.
Figure 4.
Figure 4.
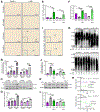
SLX4IP knockdown triggers accumulation of senescence-associated markers. A, Representative bright-field images demonstrating SA β-gal staining (arrowheads) for senescence in early- and late-passage PC-3 cells with stable knockdown of SLX4IP. Scale bar, 20 μm. B, Quantification of relative proportion of SA β-gal–positive cells in A. C, p21 expression following knockdown of SLX4IP in early- and late-passage PC-3 cells. D, Quantification of relative p21 expression in C. Confirmation of stable overexpression of telomerase in PC-3.KD.1 and KD.2 with SLX4IP knockdown via relative TERT mRNA expression (E) and telomerase activity (F). G, TRF analysis demonstrating telomere length changes over 45 days in PC-3 cells with SLX4IP knockdown (KD.1 and KD.2) and telomerase overexpression (+TELO). PD, calculated PDs. H, Telomere length changes over time measured via PDs from G. Simple linear regression models are depicted by dotted lines and slopes reported as bp/PD. Hexagon data points represent 45-day timepoints. I, Representative bright-field images demonstrating SA β-gal staining (arrowheads) for senescence in late-passage PC-3.KD.1 and KD.2 cells with telomerase overexpression. Scale bar, 20 μm. J, Quantification of relative proportion of SA β-gal–positive cells in I compared with controls. K, p21 expression in late-passage PC-3.KD.1 and KD.2 cells with telomerase overexpression. L, Quantification of relative p21 expression in K compared with controls. Data represented as mean ± SD; n = 3 (*, P < 0.05; **, P < 0.01; ***, P < 0.001; ****, P < 0.0001). ns, not significant.
Figure 5.
Figure 5.
SLX4IP knockdown in AR-independent CRPC leads to ALT-like hallmark loss, reduced tumor volume, and induction of senescent-associated markers in vivo. A, Representative IHC 40× images demonstrating SLX4IP, p21, Ki-67, active caspase-3, and hematoxylin and eosin (H&E) staining from PC-3.NS.1 and KD.1 xenograft sections. Scale bar, 60 μm. B, Quantification of p21 staining in A for percent p21-positive cells. C, Average tumor volume of PC-3.NS.1 (n = 12) and KD.1 (n = 10) on day 30. D, Representative IF-FISH images demonstrating the presence (arrowheads) or absence of PML (green) at telomeres (red), with zoom insets provided. Scale bar, 5 μm. E, Quantification of D for percent positive cells with at least one APB. Cells lacking typical APBs were quantified for ALT-like PML localization events. Representative foci are included defining these events. F, Relative telomerase activity following SLX4IP knockdown in PC-3 xenografts. G, Representative standard curve of telomerase-positive C4-2B xenograft using Q-TRAP protocol for F. RNase-treated C4-2B sample included as negative control. Data represented as mean ± SD (*, P < 0.05; **, P < 0.01; ***, P < 0.001; ****, P < 0.0001). ns, not significant.
Figure 6.
Figure 6.
Androgen deprivation triggers SLX4IP-dependent ALT-like PML localization events. A, Confirmation of stable SLX4IP knockdown using two shRNAs (KD.1 and KD.2) in C4-2B cells with scrambled shRNA control (NS) and confirmation of AR-independent transition via AR and ENO2 expression following growth in androgen-deprived conditions (+CSS) versus normal growth media (+FBS). B, Quantification of SLX4IP expression in A. Relative TERT mRNA expression (C) and telomerase activity (D) following SLX4IP knockdown in C4-2B cells grown in +FBS or +CSS. E, Representative IF-FISH images demonstrating the presence (arrowheads) or absence of PML (green) at telomeres (red), with zoom insets provided. Scale bar, 5 μm. F, Quantification of E for percent positive cells with at least one APB. Cells lacking typical APBs were quantified for ALT-like PML localization events. Representative foci are included defining these events. G, TRF analysis demonstrating telomere length changes in C42B cells with SLX4IP knockdown (KD.1 and KD.2) grown in +CSS versus C4-2B.NS grown in +CSS or +FBS. PD, calculated PDs. Data represented as mean ± SD; n = 3 (*, P < 0.05; **, P < 0.01; ***, P < 0.001; ****, P < 0.0001). ns, not significant.
Figure 7.
Figure 7.
SLX4IP knockdown triggers accumulation of senescence-associated markers following androgen deprivation. A, Representative bright-field images demonstrating SA β-gal staining (arrowheads) for senescence in early- and late-passage C4-2B cells with stable knockdown of SLX4IP grown in +CSS and +FBS. Scale bar, 20 μm. B, Quantification of relative proportion of SA β-gal–positive cells in A. C, Relative p21 expression in early- and late-passage C4-2B cells with stable knockdown of SLX4IP grown in +CSS and +FBS. D, Quantification of relative p21 expression in C. Data represented as mean ± SD; n = 3 (*, P < 0.05; **, P < 0.01; ***, P < 0.001; ***, P < 0.0001). ns, not significant.

Similar articles

Cited by

References

    1. Salonen AJ, Taari K, Ala-Opas M, Viitanen J, Lundstedt S, Tammela TLJ. The FinnProstate study VII: intermittent versus continuous androgen deprivation in patients with advanced prostate cancer. J Urol 2012;187:2074–81. - PubMed
    1. Beltran H, Tomlins S, Aparicio A, Arora V, Rickman D, Ayala G, et al. Aggressive variants of castration-resistant prostate cancer. Clin Cancer Res 2014;20:2846–50. - PMC - PubMed
    1. Mohler JL, Antonarakis ES, Armstrong AJ, D’Amico AV, Davis BJ, Dorff T, et al. Prostate cancer, version 2.2019. JNCCN J Natl Compr Cancer Netw 2019;17:479–505. - PubMed
    1. Ho Y, Dehm SM. Androgen receptor rearrangement and splicing variants in resistance to endocrine therapies in prostate cancer. Endocrinology 2017;158:1533–154. - PMC - PubMed
    1. Beltran H, Prandi D, Mosquera JM, Benelli M, Puca L, Cyrta J, et al. Divergent clonal evolution of castration-resistant neuroendocrine prostate cancer. Nat Med 2016;22:298–305. - PMC - PubMed

Publication types