. 2020 Dec 18;370(6523):eabc9359.
doi: 10.1126/science.abc9359. Epub 2020 Nov 12.

The ZSWIM8 ubiquitin ligase mediates target-directed microRNA degradation

Affiliations

The ZSWIM8 ubiquitin ligase mediates target-directed microRNA degradation

Charlie Y Shi et al. Science. .

Abstract

MicroRNAs (miRNAs) associate with Argonaute (AGO) proteins to direct widespread posttranscriptional gene repression. Although association with AGO typically protects miRNAs from nucleases, extensive pairing to some unusual target RNAs can trigger miRNA degradation. We found that this target-directed miRNA degradation (TDMD) required the ZSWIM8 Cullin-RING E3 ubiquitin ligase. This and other findings support a mechanistic model of TDMD in which target-directed proteolysis of AGO by the ubiquitin-proteasome pathway exposes the miRNA for degradation. Moreover, loss-of-function studies indicated that the ZSWIM8 Cullin-RING ligase accelerates degradation of numerous miRNAs in cells of mammals, flies, and nematodes, thereby specifying the half-lives of most short-lived miRNAs. These results elucidate the mechanism of TDMD and expand its inferred role in shaping miRNA levels in bilaterian animals.


Conflict of interest statement

Competing interests: D.P.B. has equity in Alnylam Pharmaceuticals, where he is a co-founder and advisor. The other authors declare no competing interests.

Figures

Fig. 1.
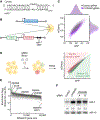
Fig. 1.. A CRISPRi screen identifies ZSWIM8 as a regulator of miR-7.
(A) The extensive complementary between Cyrano and miR-7. Vertical lines indicate Watson–Crick complementarity, excluding the first nucleotide of the miRNA, which is not available for pairing (1). (B) The engineered K562 cell line used to perform the CRISPRi screen. To generate this line, two constructs were stably integrated into the genome. One expressed KRAB-dCas9, and the other expressed GFP and mCherry reporter mRNAs from a bidirectional promoter. The mCherry mRNA had two sites in its 3′ UTR that were designed to be susceptible to miR-7–directed slicing. (C) Flow cytometry of cells in (B) transduced with lentiviral constructs expressing either a non-targeting control gRNA or an gRNA targeting CYRANO for knockdown. (D) Schematic of the genome-wide CRISPRi screen. Cells in (B) were transduced with a lentiviral CRISPRi gRNA library, cultured, and sorted with respect to their mCherry:GFP ratios, collecting cells with ratios in the top 5% and bottom 5% of all cells. The abundances of gRNAs in these two populations were then determined by high-throughput sequencing. (E) Results of the screen. Aggregate gRNA enrichment in cells with mCherry:GFP ratios in the bottom 5% compared to that in cells with ratios in the top 5% is plotted as function of MAGeCK rank. (F) The influence of ZSWIM8 on miR-7 accumulation. Shown is a representative RNA blot measuring miR-7 and miR-16 levels in an independently derived K562i line expressing either a non-targeting control gRNA, a gRNA targeting CYRANO, or one of two gRNAs (A and B) targeting ZSWIM8 for CRISPRi-mediated knockdown. miR-7 levels were normalized to those of miR-16, and mean levels relative to that observed for the non-targeting control are shown. n = 3 biological replicates.
Fig. 2.
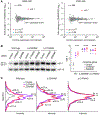
Fig. 2.. ZSWIM8 is required for target-directed miR-7 degradation, acting downstream of CYRANO.
(A) The influence of CYRANO and ZSWIM8 on miRNA levels in K562i cells. Shown are fold changes in mean miRNA levels observed upon CRISPRi-mediated knockdown of either CYRANO (left) or ZSWIM8 (right). Relative miRNA levels measured by sRNA-seq after knockdown were compared with those observed after expressing a control gRNA (n = 3 biological replicates). The point for the miRNA that significantly changed (adjusted p value < 10−7, as determined by DESeq2) is indicated (red), as is the point for its passenger strand (blue). (B) Genetic interaction between CYRANO and ZSWIM8. On the left is an RNA blot measuring miR-7 and miR-16 levels in clonal K562i lines in which the indicated gene had been knocked out (wild-type, Δ CYRANO, and Δ ZSWIM8; table S1A) and either a non-targeting control gRNA, a gRNA targeting CYRANO, or a gRNA targeting ZSWIM8 (gRNA B) was expressed for CRISPRi-mediated knockdown (fig. S2C). On the right are the results of quantification of this blot (squares), measuring miR-7 normalized to miR-16, plotted together with results from two additional biological replicates, each performed with independent control or knockout clonal lines (circles and triangles; means, horizontal lines). All values were normalized to the loading control (miR-16), then to hybridization standards, and finally to the mean of WT expressing the control gRNA. Statistical significance of fold changes between cells expressing targeting and control gRNAs within the same genetic background are indicated (**, p < 0.005; ns, not significant, two-tailed paired ratio t-test). (C) The influence of CYRANO and ZSWIM8 on miR-7 length variation. Plotted are intensity values (arbitrary units) as a function of gel migration (arbitrary units) measured by line densitometry of RNA blots in (B) and its biological replicate. Peaks correspond to lengths of miR-7 isoforms, as indicated (arrowheads). Shaded areas denote 95% confidence intervals across biological replicates (n = 2).
Fig. 3.
Fig. 3.. ZSWIM8 is generally required for TDMD and limits accumulation of many miRNAs in diverse species.
(A) The requirement of ZSWIM8 for HSUR1-directed miR-27a degradation. The RNA blot measures levels of the indicated RNAs in BJAB cells stably expressing either HSUR1, mutant HSUR1, or empty vector—each also expressing Cas9 and either one of three control gRNAs (A–C) or one of three gRNAs targeting ZSWIM8 (A–C) for polyclonal knockout (table S1B). The plot shows relative levels of miR-27 after normalizing to that of miR-20 and then to the mean level of cells expressing empty vector (EV) and control gRNAs (means, horizontal lines; ****, p < 0.0001, two-way ANOVA followed by Bonferroni’s multiple-comparisons test). (B) The influence of ZSWIM8 on miRNA levels in cells from diverse species, as measured by sRNA-seq. Plotted are fold changes in miRNA levels observed upon polyclonal knockout of Zswim8 in MEFs and induced mouse neurons, and clonal knockout of the Zswim8 ortholog in Drosophila S2 cells (table S1). miRNA fold changes with significance exceeding the indicated p-value threshold are red, and fold changes for their corresponding passenger strands are blue. miR-29b in MEFs and miR-7a in induced neurons each had two quantifiable passenger strands, whereas some other miRNAs did not have a passenger strand that exceeded our threshold for accurate quantification (Data S2). Adjusted p values were determined by DESeq2. n = 3, 2, and 3 biological replicates for MEFs, induced mouse neurons, and S2 cells, respectively. Each replicate was performed with independent knockout and control lines (table S1A). (C) The asymmetric influence of ZSWIM8 on miRNA guide and passenger strands. Shown are the miRNA fold changes highlighted in (B), each paired with the fold change of its passenger strand(s). Unpaired points correspond to miRNAs for which passenger strands did not exceed the threshold for reliable quantification.
Fig. 4.
Fig. 4.. TDMD explains the instability of most short-lived miRNAs.
(A) The relationship between miRNA half-life and ZSWIM8 sensitivity. For each miRNA guide strand reliably quantified in contact-inhibited MEFs (left) or Drosophila S2 cells (right), its half-life in wild-type cells (4, 5) is plotted as function of the fold change in its mean level observed upon loss of ZSWIM8, as quantified in Fig. 3B. If both strands of a miRNA duplex accumulated to similar levels (within 5-fold of each other in Zswim8 knockout cells), implying that both strands commonly served as guide strands, then both strands were included in the analysis, with points indicated (+ instead of •). Points for ZSWIM8-sensitive miRNAs are colored red, as in Fig. 3B, and the line is the least-squares fit to these points (r2, coefficient of determination; p value indicated). (B) The influence of ZSWIM8 on miRNA decay. At the top is an RNA blot measuring miR-503, miR-322, and let-7f levels in NIH 3T3 polyclonal lines expressing Cas9 and either a non-targeting control gRNA (wild-type) or a Zswim8-targeting gRNA (table S1B). Serum was re-introduced to serum-starved cultures, and samples were taken at the indicated times. Plotted below are miR-503 and miR-322 levels in wild-type and Δ Zswim8 cells (gray and red, respectively), after normalization to the loading control (let-7f) and the 0 h timepoint of each cell line. Lines show the least-squares fit to the data (shading, 95% confidence interval), with apparent half-lives (t1/2 values) derived from the fit also indicated. n = 1 biological replicate.
Fig. 5.
Fig. 5.. The E3 model of TDMD and its interplay with TDTT.
(A) The domain structure and conservation of human ZSWIM8. Annotated are the SWIM domain and known interaction motifs (44, 49, 50), predicted structural order and disorder (58), and relative amino acid conservation (arbitrary units) (59). (B) Schematic of the E3 model of TDMD and its interplay with TDTT (B, ELOB; C, ELOC; E2, Ubiquitin-conjugating enzyme; RING, RING-finger protein; Ub, ubiquitin). See main text for description.
Fig. 6.
Fig. 6.. Additional support for the E3 model of TDMD.
(A) The influence of ELOB and ELOC on miR-7 levels in K562i cells. Shown is an RNA blot measuring miR-7 and miR-16 levels in cells expressing either a non-targeting control gRNA or a gRNA targeting either CYRANO, ELOB, or ELOC for CRISPRi-mediated knockdown (fig. S5A). Omitted irrelevant lanes are marked by black lines. Otherwise, as in Fig. 1F. (B) Importance of the ubiquitin–proteasome system and the Cullin–RING ligase activity to TDMD. Shown are analyses of RNA blots that measured miR-7 and miR-16 levels after inhibitor treatment of either wild-type (gray) or knockout (Δ ZSWIM8, red) clonal K562i lines (table S1A). For each time point of each biological replicate, the signal for miR-7 was normalized to that of miR-16 and then to the miR-7 signal at 0 h. Lines show the least-squares fit to the results of each treatment (**, p < 0.001; ns, not significant). MG-132 inhibits the 26S proteasome; MLN4924 inhibits Nedd8-activating enzyme (NAE); TAK-243 inhibits ubiquitin-activating enzyme (UAE/E1). n = 2 biological replicates.
Fig. 7.
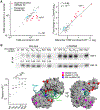
Fig. 7.. Evidence for AGO polyubiquitination.
(A) A physical association between TDMD substrates and polyubiquitinated proteins in S2 cells. On the left are enrichments of miRNAs co-purifying with polyubiquitinated proteins, as measured by sRNA-seq of TUBE pulldown and input samples. Results are shown for all miRNAs passing the threshold required for reliable quantification, which included nine ZSWIM8-sensitive miRNAs (red) and three of their passenger strands (blue), plotting mean enrichment in a clonal CG34401-knockout S2 line (Δ Zswim8) as a function of mean enrichment in an analogously derived clonal wild-type line (WT) (table S1A). n = 3 biological replicates. On the right is the relationship between Zswim8 sensitivity and the mean enrichment observed in TUBE pulldowns from wild-type cells (WT) divided by that observed from Δ Zswim8 cells (Δ). The line shows the least-squares fit to all data (r2, coefficient of determination; p value indicated). (B) The importance of AGO2 surface lysines for TDMD. On top is an RNA blot measuring miR-7 and miR-16 levels in immunoprecipitations from either wild-type or Δ ZSWIM8 K562i clonal cell lines (table S1A) expressing the indicated 3XHA-tagged protein (∅, HA-tagged GFP; WT, HA-tagged AGO2; RX, AGO2 variant with lysine-to-arginine substitutions described in the text). For each AGO2 variant, the ratio of miR-7:miR-16 observed in a clonal wild-type cell line was normalized to the mean of that observed in three clonal Δ ZSWIM8 cell lines, and these normalized ratios are shown within each wild-type lane and plotted at the bottom left (squares). Circles and triangles show results of replicates performed with two other clonal lines (means, horizontal lines; *, p < 0.05; **, p < 0.01; ***, p < 0.001; ns, not significant, 2-way ANOVA followed by Tukey’s multiple-comparisons test). At the bottom right is human AGO2 in the TDMD conformation (PDB ID: 6MDZ, (8)), highlighting cluster 5, cluster 6, and unsubstituted lysines. The miRNA (green), TDMD trigger (teal), and AGO domains (N, PAZ, MID, and PIWI) are indicated.

Comment in

Similar articles

Cited by

References

    1. Bartel DP, Metazoan MicroRNAs. Cell 173, 20–51 (2018). - PMC - PubMed
    1. Jonas S, Izaurralde E, Towards a molecular understanding of microRNA-mediated gene silencing. Nat Rev Genet 16, 421–433 (2015). - PubMed
    1. Friedman RC, Farh KK-H, Burge CB, Bartel DP, Most mammalian mRNAs are conserved targets of microRNAs. Genome Res 19, 92–105 (2009). - PMC - PubMed
    1. Kingston ER, Bartel DP, Global analyses of the dynamics of mammalian microRNA metabolism. Genome Res 29, 1777–1790 (2019). - PMC - PubMed
    1. Reichholf B et al., Time-Resolved Small RNA Sequencing Unravels the Molecular Principles of MicroRNA Homeostasis. Mol Cell 75, 756–768.e757 (2019). - PMC - PubMed

Publication types

MeSH terms