. 2021 Jan 22;128(2):246-261.
doi: 10.1161/CIRCRESAHA.120.317452. Epub 2020 Nov 13.

Intracellular β1-Adrenergic Receptors and Organic Cation Transporter 3 Mediate Phospholamban Phosphorylation to Enhance Cardiac Contractility

Affiliations

Intracellular β1-Adrenergic Receptors and Organic Cation Transporter 3 Mediate Phospholamban Phosphorylation to Enhance Cardiac Contractility

Ying Wang et al. Circ Res. .

Abstract

Rationale: β1ARs (β1-adrenoceptors) exist at intracellular membranes and OCT3 (organic cation transporter 3) mediates norepinephrine entry into cardiomyocytes. However, the functional role of intracellular β1AR in cardiac contractility remains to be elucidated.

Objective: Test localization and function of intracellular β1AR on cardiac contractility.

Methods and results: Membrane fractionation, super-resolution imaging, proximity ligation, coimmunoprecipitation, and single-molecule pull-down demonstrated a pool of β1ARs in mouse hearts that were associated with sarco/endoplasmic reticulum Ca2+-ATPase at the sarcoplasmic reticulum (SR). Local PKA (protein kinase A) activation was measured using a PKA biosensor targeted at either the plasma membrane (PM) or SR. Compared with wild-type, myocytes lacking OCT3 (OCT3-KO [OCT3 knockout]) responded identically to the membrane-permeant βAR agonist isoproterenol in PKA activation at both PM and SR. The same was true at the PM for membrane-impermeant norepinephrine, but the SR response to norepinephrine was suppressed in OCT3-KO myocytes. This differential effect was recapitulated in phosphorylation of the SR-pump regulator phospholamban. Similarly, OCT3-KO selectively suppressed calcium transients and contraction responses to norepinephrine but not isoproterenol. Furthermore, sotalol, a membrane-impermeant βAR-blocker, suppressed isoproterenol-induced PKA activation at the PM but permitted PKA activation at the SR, phospholamban phosphorylation, and contractility. Moreover, pretreatment with sotalol in OCT3-KO myocytes prevented norepinephrine-induced PKA activation at both PM and the SR and contractility.

Conclusions: Functional β1ARs exists at the SR and is critical for PKA-mediated phosphorylation of phospholamban and cardiac contractility upon catecholamine stimulation. Activation of these intracellular β1ARs requires catecholamine transport via OCT3.

Keywords: catecholamine; intracellular membrane; norepinephrine; phospholamban; phosphorylation.


Figures
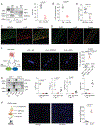
Figure 1.
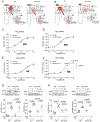
Figure 1.. Intracellular β1AR associates with SERCA2 but not RyR2 in hearts and isolated mouse adult ventricular cardiomyocytes (AVMs).
(A) WT and β1AR-KO mouse heart lysates were fractionated to assess cellular distribution of β1AR. Representative blots and the percentages of β1AR in the plasma membrane (PM) and intracellular membrane fractions (non-PM) over the total β1AR in WT and β1AR-KO mouse hearts. Data are shown in mean ± S.E.M. N = 9 mice. p values were obtained by student t-test. (B) β1AR densities in the PM and non-PM fractions of WT mouse hearts were determined by quantitative radioligand binding assay. Data are shown in mean ± S.E.M. N = 6 mice. p values were obtained by student t-test. (C-D) Representative confocal images showing distribution of β1AR, SERCA2, and RyR2 in isolated mouse AVMs. β1AR was overexpressed in AVMs by infection with recombinant adenovirus. Scale bar = 5 μm. (E) The overlap between staining from confocal images was evaluated by Pearson’s correlation coefficient using ImageJ. Data are shown in mean ± S.E.M; AVM (in the parenthesis) and mouse numbers are indicated in the figure. p value was obtained by t-test. (F) Schematic of in situ proximity ligation assay (PLA), exemplary fluorescence images (the whole cell images are in Online Figure II) and quantification of PLA signals after labeling with antibodies against β1AR and IgG, β1AR and SERCA2, and β1AR and RyR2 in AVMs, respectively. Positive PLA signal (red), DAPI (blue). Scale bar = 5 μm. Data are shown in mean ± S.E.M; AVM (in the parenthesis) and mouse numbers are indicated. p values were obtained by one-way ANOVA followed by Tukey multiple comparison test. (G) Representative images and quantitative assessment of PLB, SERCA2 and RyR2 coimmunoprecipitated with β1AR in WT mouse hearts. A.U. = arbitrary unit is defined as the ratio of intensity of proteins over inputs. Data are shown in mean ± S.E.M. (N = 5); p values were obtained by student t-test; (H) Schematic of SiMPull assay and representative images of SiMPull assay after endogenous β1AR, SERCA2 complex were pulled down with anti-β1AR or control IgG antibodies. The images were quantified using MATLAB. Scale bar = 5 μm. Data are shown in mean ± S.E.M. N = 5 mice. p values were obtained by t-test.
Figure 2.
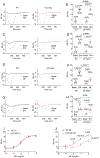
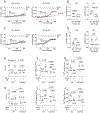
Figure 2.. Differential local regulation of NE-induced β1AR/PKA activities in WT and OCT3KO AVMs.
(A-B) Schematics of local activation of β1AR-induced PKA activity at subcellular locations and detection using FRET based biosensors (plasma membrane, PM-AKAR3 and sarcoplasmic reticulum, SR-AKAR3) in WT and OCT3KO AVMs. Isoproterenol (ISO), norepinephrine (NE). FRET assay was analyzed with F/F0 of YFP/CFP ratio. (C-D) Concentration-response curves of changes in YFP/CFP ratio after ISO stimulation in WT and OCT3KO AVMs expressing PM-AKAR3 or SR-AKAR3. Data were from 6 WT and 6 OCT3KO mice. (E-F) Concentration-response curves of changes in YFP/CFP ratio after NE stimulation in WT and OCT3KO AVMs expressing PM-AKAR3 or SR-AKAR3. Data were from 8 WT and 7 OCT3KO mice. Data are shown in mean ± S.E.M. p values were obtained by two-way ANOVA with Tukey’s multiple comparison test when comparing WT to OCT3-KO. (G-H) Detection of phosphorylation of phospholamban (PLB) at serine 16 and phosphorylation of phospholemman (PLM) at serine 63 in mouse AVMs after stimulation with 100 nmol/L ISO or 100 nmol/L NE. Data are shown in mean ± S.E.M. (N = 5). A.U. (arbitrary unit) is defined as the ratio of intensity of phosphorylated proteins over intensity of total proteins. p values were obtained by two-way ANOVA with Tukey’s multiple comparison test.
Figure 3.
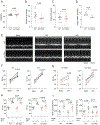
Figure 3.. Deletion of Organic Catecholamine Transporter3 (OCT3) attenuates stimulation of myocyte contractility with norepinephrine and epinephrine.
(A-B) Representative traces show sarcomere shortening (SS) before (close line) and after (dash line) stimulation with ISO (100 nmol/L) in the WT and OCT3KO mouse AVMs. The peak SS were quantified. (C-D) Representative traces show FS before (close line) and after (dash line) the application of dobutamine (Dob, 1μmol/L) in WT and OCT3KO AVMs. The peak SS were quantified. (E-F) Representative traces show SS before (close line) and after (dash line) the application of norepinephrine (NE, 100 nmol/L) in WT and OCT3KO AVMs. The peak SS were quantified. (G-H) Representative traces show SS before (close line) and after (dash line) the application of epinephrine (EPI, 100 nmol/L) in WT and OCT3KO AVMs. The peak SS were quantified. For panel A-H, data are shown in mean ± S.E.M. AVM (in the parenthesis) and animal numbers are indicated. p values were obtained by two-way ANOVA analysis followed with Tukey’s multiple comparison test. (I-J) Dose response curves of SS in AVMs after stimulation with ISO (7 WT and 7 OCT3-KO mice) or NE (6 WT and 8 OCT3-KO mice). p values were obtained by two-way ANOVA with Tukey’s multiple comparison test when comparing OCT3-KO to WT.
Figure 4.
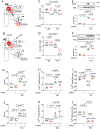
Figure 4.. Inhibition of organic catecholamine transporters reduces norepinephrine-promoted SR-localized β1AR signal and myocardial contractility.
(A-B) Schematics show detection of β1AR-induced PKA activity at different subcellular locations with and without OCT3 inhibitor corticosterone (CORTI). (C-D) Rat AVMs expressing PM-AKAR3 or SR-AKAR3 FRET biosensor were pretreated with CORTI (1 μmol/L) before stimulation with NE (100 nmol/L) or ISO (100 nmol/L). FRET was analyzed as F/F0 of YFP/CFP ratio. Data show the maximal increases in YFP/CFP ratios in mean ± S.E.M. AVM (in the parenthesis) and rat numbers are indicated. p values were obtained by One-way ANOVA with Tukey’s multiple comparison test. (E-F) Representative immunoblot detection and quantification of phosphorylated serine 16 (pPLB) and total PLB in rat AVMs. Cells were treated with 5-minute incubation with ISO (100 nmol/L) or NE (100 nmol/L) in the absence and presence of CORTI pretreatment. A.U. (arbitrary units) is defined as the ratio of intensity of phosphorylated proteins over intensity of total proteins. Data are shown in mean ± S.E.M. (N = 3). p values were obtained by One-way ANOVA with Tukey’s multiple comparison test. (G-L) Rat AVMs were loaded with Ca2+ indicator, 5 μmol/L Fluo-4 AM and pretreated with CORTI (1 μmol/L) before stimulation with NE (100 nmol/L) or ISO (100 nmol/L). Sarcomere shortening (SS) and calcium transient amplitude and tau were recorded with 1Hz pacing. Data are shown in mean ± S.E.M. AVM (in the parenthesis) and animal numbers are indicated in figures. p values were obtained by One-way ANOVA with Tukey’s multiple comparison test.
Figure 5.
Figure 5.. Activation of β1AR in the SR is essential for maximal stimulated contractility in AVMs.
(A-C) Schematics show detection of β1AR-induced PKA activity at different subcellular locations (PM and SR) with FRET based biosensors in the presence of membrane impermeant β-blocker sotalol (SOTA) or the membrane permeant β-blocker propranolol (PROP). (D, E) Rat AVMs expressing PM-AKAR3 or SR-AKAR3 were stimulated with 100 nmol/L ISO with or without 5-mintue pretreatment of 25 μmol/L SOTA (blue) or 1 μmol/L PROP (red). Representative time courses show FRET response of PM-AKAR3 or SR-AKAR3 in AVMs. FRET was analyzed as F/F0 of YFP/CFP ratio. Data are shown in mean ± S.E.M. AVM (in the parenthesis) and rat numbers are indicated. p values were obtained by one-way ANOVA analysis with Tukey’s multiple comparison test. (F, G) Dose-dependent inhibition curves of PROP or SOTA on ISO-induced increases in FRET responses in AVMs expressing PM-AKAR3 or SR-AKAR3. Data show YFP/CFP ratios normalized against the maximal increases induced by ISO in the absence of β-blocker (N = 5 rats). p values were obtained by two-way ANOVA analysis followed by Tukey’s multiple comparison test when compared to OCT3-KO. (PM-AKAR3: PROP, IC50 = 7.399×10⁻⁸ mol/L, SR-AKAR3: PROP, IC50 = 9.92×10⁻⁸ mol/L; PM-AKAR3: SOTA, IC50 = 2.216×10⁻⁶ mol/L; SR-AKAR3, STOA, IC50 = 2.149×10⁻⁵ mol/L). (H-J) Rat AVMs were incubated with Ca2+ indicator (5 μM Fluo-4 AM) before 1Hz pacing. After pretreatment with SOTA (25 μmol/L) or PROP (1 μmol/L), sarcomere shortening (SS) and calcium transient were recorded before and after stimulation with 100 nmol/L ISO. The peak SS, amplitude of Ca2+ transient, and rate of Ca2+ decay (Tau) are shown as mean ± S.E.M. Animal numbers and cell numbers are indicated in figures. p values were obtained by one-way ANOVA analysis with Tukey’s multiple comparison test.
Figure 6.
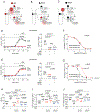
Figure 6.. Activation of β1AR at the SR promotes myocyte calcium cycling and contractility.
(A, B) WT and OCT3KO AVMs were used to express PM-AKAR3 or SR-AKAR3 biosensors. FRET was analyzed as F/F0 of YFP/CFP ratio. Representative curves and maximal changes show subcellular PKA FRET responses to NE (100 nmol/L) stimulation in AVMs pretreated with sotalol (SOTA, 25 μmol/L). Animal numbers and cell numbers (in the parenthesis) are indicated. p values were obtained by two-way ANOVA analysis followed with Tukey’s multiple comparison test when compared to OCT3-KO. (C, D) WT and OCT3KO mouse AVMs were used to express PM-AKAR3 or SR-AKAR3 biosensors. Representative curves and maximal changes show subcellular PKA FRET responses to ISO (100 nmol/L) stimulation in AVMs pretreated with sotalol (SOTA, 25 μmol/L). Animal numbers and cell numbers (in the parenthesis) are indicated. p values were obtained by two-way ANOVA analysis followed with Tukey’s multiple comparison test when compared to OCT3-KO. (E-G) AVMs from WT and OCT3 hearts were stimulated with NE (100 nmol/L) in the presence of SOTA (25 μmol/L) pretreatment. Data show maximal changes in sarcomere shortening (SS), Ca2+ transient amplitude, and rate of Ca2+ decay (Tau) as mean ± S.E.M. Animal numbers and cell numbers (in the parenthesis) are indicated in figures. p values were obtained by two-way ANOVA analysis with Tukey’s multiple comparison test. (H-J) AVMs from WT and OCT3 hearts were stimulated with ISO (100 nmol/L) in the presence of SOTA (25 μmol/L) pretreatment. Data show maximal changes in SS, Ca2+ transient amplitude, and Tau as mean ± S.E.M. Animal numbers and cell numbers (in the parenthesis) are indicated. p values were obtained by two-way ANOVA analysis with Tukey’s multiple comparison test.
Figure 7.
Figure 7.. Deletion of OCT3 reduces catecholamine uptake, cAMP signal and inotropic response in response to adrenergic stimulation of mouse hearts.
(A) Heart weight/body weight ratio (HW/BW %) in WT and OCT3-KO mice. Data are shown as mean ± S.E.M. (N = 8). p values were obtained by student t-test. (B, C) Quantitative determination of endogenous NE in cardiac tissues and the plasma. Data are shown as mean ± S.E.M. (N = 8). p values were obtained by student t-test. (D) Quantitative determination of cAMP levels in cardiac tissues. Data are shown as mean ± S.E.M. (N = 4). p values were obtained by student t-test. (E) Representative echocardiographic images of WT (N = 7) and OCT3KO (N = 6) mice at baseline and after intraperitoneal injection of 10 μg/kg isoproterenol (ISO) or epinephrine (EPI). (F-I) Cardiac ejection fraction (EF) of individual mice before and after intraperitoneal injection of ISO or EPI in WT (N = 7) and OCT3KO (N = 6). Quantification of EF and heart rate (HR) in WT and OCT3KO mice before and after injection with ISO or EPI. Data are shown as mean ± S.E.M. p values were obtained by two-way ANOVA analysis with Tukey’s multiple comparison test.

Similar articles

Cited by

References

    1. Boivin B, Lavoie C, Vaniotis G, Baragli A, Villeneuve LR, Ethier N, Trieu P, Allen BG and Hebert TE. Functional beta-adrenergic receptor signalling on nuclear membranes in adult rat and mouse ventricular cardiomyocytes. Cardiovasc Res. 2006;71:69–78. - PubMed
    1. Wright CD, Chen Q, Baye NL, Huang Y, Healy CL, Kasinathan S and O’Connell TD. Nuclear alpha1-adrenergic receptors signal activated ERK localization to caveolae in adult cardiac myocytes. Circ Res. 2008;103:992–1000. - PMC - PubMed
    1. Escobales N, Nunez RE and Javadov S. Mitochondrial angiotensin receptors and cardioprotective pathways. Am J Physiol Heart Circ Physiol. 2019;316:H1426–H1438. - PMC - PubMed
    1. Ibarra C, Vicencio JM, Estrada M, Lin Y, Rocco P, Rebellato P, Munoz JP, Garcia-Prieto J, Quest AF, Chiong M, Davidson SM, Bulatovic I, Grinnemo KH, Larsson O, Szabadkai G, Uhlen P, Jaimovich E and Lavandero S. Local control of nuclear calcium signaling in cardiac myocytes by perinuclear microdomains of sarcolemmal insulin-like growth factor 1 receptors. Circ Res. 2013;112:236–45. - PubMed
    1. Benard G, Massa F, Puente N, Lourenco J, Bellocchio L, Soria-Gomez E, Matias I, Delamarre A, Metna-Laurent M, Cannich A, Hebert-Chatelain E, Mulle C, Ortega-Gutierrez S, Martin-Fontecha M, Klugmann M, Guggenhuber S, Lutz B, Gertsch J, Chaouloff F, Lopez-Rodriguez ML, Grandes P, Rossignol R and Marsicano G. Mitochondrial CB(1) receptors regulate neuronal energy metabolism. Nature neuroscience. 2012;15:558–64. - PubMed

Publication types

MeSH terms

Substances