Chemoradiation impairs myofiber hypertrophic growth in a pediatric tumor model
- PMID: 33177579
- PMCID: PMC7659015
- DOI: 10.1038/s41598-020-75913-w
Chemoradiation impairs myofiber hypertrophic growth in a pediatric tumor model
Abstract
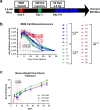
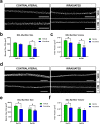
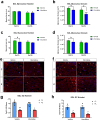
Pediatric cancer treatment often involves chemotherapy and radiation, where off-target effects can include skeletal muscle decline. The effect of such treatments on juvenile skeletal muscle growth has yet to be investigated. We employed a small animal irradiator to administer fractionated hindlimb irradiation to juvenile mice bearing implanted rhabdomyosarcoma (RMS) tumors. Hindlimb-targeted irradiation (3 × 8.2 Gy) of 4-week-old mice successfully eliminated RMS tumors implanted one week prior. After establishment of this preclinical model, a cohort of tumor-bearing mice were injected with the chemotherapeutic drug, vincristine, alone or in combination with fractionated irradiation (5 × 4.8 Gy). Single myofiber analysis of fast-contracting extensor digitorum longus (EDL) and slow-contracting soleus (SOL) muscles was conducted 3 weeks post-treatment. Although a reduction in myofiber size was apparent, EDL and SOL myonuclear number were differentially affected by juvenile irradiation and/or vincristine treatment. In contrast, a decrease in myonuclear domain (myofiber volume/myonucleus) was observed regardless of muscle or treatment. Thus, inhibition of myofiber hypertrophic growth is a consistent feature of pediatric cancer treatment.
Conflict of interest statement
The authors declare no competing interests.
Figures


Similar articles
-
Prepubertal skeletal muscle growth requires Pax7-expressing satellite cell-derived myonuclear contribution.Development. 2018 Oct 25;145(20):dev167197. doi: 10.1242/dev.167197. Development. 2018. PMID: 30305290 Free PMC article.
-
Hindlimb immobilization applied to 21-day-old mdx mice prevents the occurrence of muscle degeneration.J Appl Physiol (1985). 1999 Mar;86(3):924-31. doi: 10.1152/jappl.1999.86.3.924. J Appl Physiol (1985). 1999. PMID: 10066706
-
Proteomic analysis revealed different responses to hypergravity of soleus and extensor digitorum longus muscles in mice.J Proteomics. 2020 Apr 15;217:103686. doi: 10.1016/j.jprot.2020.103686. Epub 2020 Feb 12. J Proteomics. 2020. PMID: 32061808
-
Potent oncolytic activity of multimutated herpes simplex virus G207 in combination with vincristine against human rhabdomyosarcoma.Cancer Res. 2003 Apr 1;63(7):1508-14. Cancer Res. 2003. PMID: 12670897
-
Skeletal myofiber VEGF regulates contraction-induced perfusion and exercise capacity but not muscle capillarity in adult mice.Am J Physiol Regul Integr Comp Physiol. 2016 Jul 1;311(1):R192-9. doi: 10.1152/ajpregu.00533.2015. Epub 2016 May 25. Am J Physiol Regul Integr Comp Physiol. 2016. PMID: 27225953 Free PMC article.
Cited by
-
Muscle-specific functional deficits and lifelong fibrosis in response to paediatric radiotherapy and tumour elimination.J Cachexia Sarcopenia Muscle. 2022 Feb;13(1):296-310. doi: 10.1002/jcsm.12902. Epub 2022 Jan 8. J Cachexia Sarcopenia Muscle. 2022. PMID: 34997696 Free PMC article.
-
Radiation induces long-term muscle fibrosis and promotes a fibrotic phenotype in fibro-adipogenic progenitors.J Cachexia Sarcopenia Muscle. 2023 Oct;14(5):2335-2349. doi: 10.1002/jcsm.13320. Epub 2023 Sep 6. J Cachexia Sarcopenia Muscle. 2023. PMID: 37671686 Free PMC article.
-
Decline of DNA damage response along with myogenic differentiation.Life Sci Alliance. 2023 Nov 22;7(2):e202302279. doi: 10.26508/lsa.202302279. Print 2024 Feb. Life Sci Alliance. 2023. PMID: 37993260 Free PMC article.
-
Contemporary preclinical mouse models for pediatric rhabdomyosarcoma: from bedside to bench to bedside.Front Oncol. 2024 Feb 2;14:1333129. doi: 10.3389/fonc.2024.1333129. eCollection 2024. Front Oncol. 2024. PMID: 38371622 Free PMC article.
-
Endurance exercise attenuates juvenile irradiation-induced skeletal muscle functional decline and mitochondrial stress.Skelet Muscle. 2022 Apr 12;12(1):8. doi: 10.1186/s13395-022-00291-y. Skelet Muscle. 2022. PMID: 35414122 Free PMC article.
References
-
- Henderson, T. O., Ness, K. K. & Cohen, H. J. Accelerated aging among cancer survivors: from pediatrics to geriatrics. American Society of Clinical Oncology educational book / ASCO. American Society of Clinical Oncology. Meeting, e423–430, doi:10.14694/EdBook_AM.2014.34.e423 (2014). - PubMed
Publication types
MeSH terms
Substances
Grants and funding
LinkOut - more resources
Full Text Sources

