. 2020 Dec 15;205(12):3277-3290.
doi: 10.4049/jimmunol.1901429. Epub 2020 Nov 11.

Screening of a Panel of Low Molecular Weight Compounds That Inhibit Synovial Fibroblast Invasion in Rheumatoid Arthritis

Affiliations

Screening of a Panel of Low Molecular Weight Compounds That Inhibit Synovial Fibroblast Invasion in Rheumatoid Arthritis

Tomoko Sugiura et al. J Immunol. .

Abstract

Increased invasion of synovial fibroblasts and their involvement in cartilage damage are characteristic phenotypes of rheumatoid arthritis (RA). To identify low molecular weight compounds that suppress synovial fibroblast invasion, a panel of inhibitors (n = 330) was initially screened using a real-time cell analysis system for human synovial fibroblasts that were enzymatically isolated from surgical samples of RA patients. To evaluate the effects of the inhibitors identified in the screen, synovial fibroblast migration was measured using a wound-healing assay, and phosphorylation of intracellular signaling molecules was determined by immunoblots. Several candidate inhibitors were identified in the screen, including inhibitors against platelet-derived growth factor receptor (PDGFR), Akt, PI3K, and glycogen kinase synthetase 3 (GSK-3). These inhibitors strongly suppressed synovial fibroblast migration after 72 h and downregulated phosphorylation of Akt (Ser473) at 48 h. When the inhibitors were removed from the culture conditions, both migration and phosphorylated Akt (Ser473) levels were restored. Furthermore, all the categories of inhibitors except for PDGFR inhibitor IV decreased cell proliferation as well as IL-6 production in synovial fibroblasts. Interestingly, GSK-3 inhibitors increased anti-inflammatory cytokine IL-10 production but suppressed IL-23 production from LPS-primed macrophages obtained from healthy donors. In conclusion, blocking PDGFR, PI3K, or GSK-3 could have therapeutic value as an RA treatment that targets the invasion/migration of synovial fibroblasts.


Conflict of interest statement

The authors have no financial conflicts of interest.

Figures

FIGURE 1.
FIGURE 1.
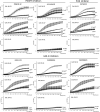
Invasion of SFs assayed by RTCA on the xCELLigence System. (A) Tubulin and actin filament inhibitors completely suppressed SF invasion. SFs from patient RA-S3 were seeded in the upper chamber of a CIM-Plate 16 precoated with Matrigel in serum-free DMEM. To the lower chamber, media containing 10% FCS and 5 μM inhibitors or DMSO were added. During the assay, the impedance value of each well was automatically recorded by the xCELLigence System and expressed as a C.I. value. Open circles indicate the DMSO control and closed squares indicate each inhibitor. Results for vinblastine sulfate, nocodazole, paclitaxel, and cytochalasin D were used as positive controls of suppressed invasion and are depicted as mean ± SD from two wells processed in parallel. (B) The degree of suppression by inhibitors is defined as (++, strongly suppressed), (+, suppressed) or (−, not suppressed). C.I. values of each inhibitor from duplicated wells were compared with those of DMSO control at 12 and 18 h after the initiation of the assay. SU11652, a PDGFR inhibitor, suppressed C.I. values by 11% at 12 h and 26% at 18 h compared with DMSO control; both of them reached statistically significant levels. Therefore, SU11652 was defined as (++). Cdk2/9 inhibitor, a CDK inhibitor, significantly suppressed C.I. values at 12 h after the initiation of the assay only; therefore, it was defined as (+). Cdk4 inhibitor, a CDK inhibitor, was defined as (−), as it showed no suppressive effects compared with DMSO control at either of the two time points. *p < 0.05 compared with control DMSO, Mann–Whitney U test. N.S., not significant.
FIGURE 2.
FIGURE 2.
Dose dependency of PDGFR, PI3K, or GSK-3 inhibitors in RTCA was determined on different lines of SFs from two RA patients (RA-S3 and RA-S7) and one OA patient (OA-S1). Experiments were performed in triplicate, and data represent the mean ± SD from three wells processed in parallel. Differences in C.I. values between the DMSO control and the different concentrations of inhibitors were analyzed at the end point of the assay. There were dose dependencies for each inhibitor in RA-S3 and RA-S7 but not for CHIR99021 in RA-S3. In OA-S1, 5 μM of GSK-3 inhibitor IX showed significant suppression. Open circles indicate the DMSO control, and closed squares and triangles indicate the different concentrations of each inhibitor as labeled. *p < 0.05, **p < 0.01, compared with control DMSO, Student t test.
FIGURE 3.
FIGURE 3.
The PDGFR, PI3K, and GSK-3 inhibitors decrease migration of RA SFs by spot spheroid assay. Modified spot spheroid assay of SFs. A mixture of SFs from RA patients and Matrigel was pipetted as a single spot in a 24-well culture dish. Each well was filled with 10% FCS–DMEM in the presence of PDGFR inhibitor (PDGFRi) IV (0.2–5 μM), crenolanib (0.04–1 μM), ZSTK474 (0.04–1 μM), GSK-3 inhibitor (GSK-3i) IX (0.2–5 μM), LY2090314 (0.04–1 μM), CHIR99021 (0.1–2.5 μM), or the control (DMSO). Cell movement was imaged after 72 h using a confocal microscope at an original magnification ×40. Representative light micrographs of SFs from RA patients (RA-S3) are shown.
FIGURE 4.
FIGURE 4.
The PDGFR, PI3K, and GSK-3 inhibitors decrease migration of RA SFs by wound-healing assay. (A) Wounds were made on the surface of confluent cells cultured in six-well dishes using a small pipette tip. After washing, cells were cultured in 10% FCS–DMEM supplemented with 1 or 5 μM GSK-3i IX or DMSO. Light microscopy images were taken 0, 24, 48, and 72 h after wounding at original magnification ×4. Representative light micrographs of SFs from RA patients (RA-S3) are shown. (B) Semiquantitative analysis of the effects of inhibitors on wound-healing. Migration of SFs into the wound area was semiquantified by measuring the average width of the wound at three locations. SFs were wounded and incubated with PDGFR inhibitor (PDGFRi) IV (10 or 50 nM), crenolanib (40 nM or 2 μM), ZSTK474 (1 or 5 μM), GSK-3i IX (1 or 5 μM), LY2090314 (20 or 100 nM), CHIR99021 (1 or 5 μM), or DMSO (control). Measurement of wounds at time 0 was designated as 100% open and used to calculate the percentage of closure for all wounds in all conditions. A closed square indicates DMSO control, and open and closed circles indicate the different concentrations of each inhibitor as labeled. Data are represented as mean ± SEM. *p < 0.05, compared with control DMSO (n = 3 measurements), Student t test.
FIGURE 5.
FIGURE 5.
Semiquantitative analysis of the effects of the removal of the inhibitors on wound-healing assays. Wounded SFs were incubated for an initial 24 h with each inhibitor at concentrations sufficient for suppressing migration (50 nM PDGFR inhibitor [PDGFRi] IV, 2 μM crenolanib, 5 μM ZSTK474, 5 μM GSK-3i IX, 100 nM LY2090314, and 5 μM CHIR99021). The media were then exchanged with 10% FCS–DMEM (removal [R]) or remained with inhibitors (with) for another 72 h. At the end of this incubation, the difference in wound distance between the two different culture conditions was compared for each inhibitor. Closed squares indicate the DMSO control. Open and closed circles indicate different conditions under inhibitors (with) or (R) of inhibitors, respectively. Data are represented as mean ± SEM. *p < 0.05 (n = 3 measurements), Student t test.
FIGURE 6.
FIGURE 6.
Inhibitors of PDGFR, PI3K, and GSK-3 modulate Akt and GSK-3β phosphorylation in RA SFs. SFs were cultured with or without PDGFR inhibitor (PDGFRi) IV, crenolanib, ZSTK474, GSK-3 inhibitor (GSK-3i) IX, LY2090314, or CHIR99021 for 0, 6, 24, and 48 h, then total protein was extracted and evaluated by Western blot for phosphorylated Akt (Ser437), total Akt, p–GSK-3β (Ser9), p–GSK-3β (Tyr216), total GSK-3β, p-glycogen synthase-1 (Ser641), and total glycogen synthase-1. A representative blot from independent experiments is depicted in the panels (n = 3 RA SF lines). To quantify the effect of the inhibitors on protein phosphorylation, Western blot densitometry was performed. The ratio of p-Akt to total Akt, p–GSK-3β to total GSK-3β, and p-glycogen synthase-1 to glycogen synthase-1 were calculated and expressed at time 0 as 1. Data are represented as mean ± SEM (n = 3 independent experiments) from a representative patient, RA-S3. *p < 0.05 compared with time 0, nonparametric Mann–Whitney U test. GS, glycogen synthase-1.
FIGURE 7.
FIGURE 7.
Recovery of phosphorylated Akt (Ser473) and GSK-3β (Ser9 and Tyr217) after inhibitor removal. SFs were incubated with 0.2 μM PDGFR inhibitor (PDGFRi) IV, 1 μM crenolanib, 1 μM ZSTK474, 5 μM GSK-3i IX, 0.5 μM LY2090314, or 2.5 μM CHIR99021 for 24 h and then media were either exchanged for 10% FCS–DMEM or maintained in the inhibitor media for a subsequent 24 h. Cells were then lysed with SDS sample buffer and used for immunoblotting to evaluate Akt (Ser473) or GSK-3β (both Ser9 and Tyr216) phosphorylation. A representative blot (RA-S3) from independent three experiments is depicted in the panels. Western blot densitometry was performed to evaluate the recovery of phosphorylated Akt or GSK-3β levels by removing the inhibitors, and data are expressed as DMSO control as 1. Removal (R) was compared with the inhibitor (+) for each condition. Data are represented as mean ± SEM (n = 3 independent experiments). *p < 0.05, R compared with continuous exposure to the inhibitors (+), nonparametric Mann–Whitney U test.
FIGURE 8.
FIGURE 8.
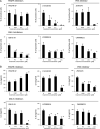
Inhibitors of PDGFR, PI3K, and GSK-3 suppressed both SF proliferation and IL-6 production. (A) The effects of inhibitors on SF proliferation. SFs were cultured for 48 h in media containing different concentrations of inhibitors of PDGFR, PI3K, and GSK-3 or the DMSO control. A final concentration of 10 μM EdU was then added to the cells and incubated for another 12 h. EdU-labeled cells were normalized to the total number of Hoechst-stained cells of the microscope field. Data are represented as the proportion of EdU-positive cells. All the inhibitors decreased EdU incorporation in a dose-dependent manner, except for PDGFR inhibitor (PDGFRi) IV. Data are represented as mean ± SEM (n = 3 RA SF lines). *p < 0.05 compared with DMSO control, nonparametric Mann–Whitney U test. (B) The effects of inhibitors on IL-6 production in SFs. SFs were incubated for 48 h with different concentrations of inhibitors or DMSO as the control, and the concentrations of IL-6 in the culture supernatants were measured by ELISA. The PDGFRi had little effect on IL-6 production, whereas the PI3K and GSK-3 inhibitors significantly decreased IL-6 production in a dose-dependent manner. Data are represented as mean ± SEM (n = 3 RA SF lines. *p < 0.05 compared with the DMSO control, nonparametric Mann–Whitney U test.
FIGURE 9.
FIGURE 9.
The effects of GSK-3 inhibitors on IL-23 and IL-10 production in monocyte-derived macrophages. Macrophages derived from peripheral monocytes were incubated in media containing different concentrations of GSK-3 inhibitors or DMSO. After 30 min, 50 ng/ml LPS was added to each well in triplicate and cultured for another 48 h. At the end of the culture period, supernatants were collected, and the concentrations of IL-23 and IL-10 were measured by ELISA. The GSK-3 inhibitors decreased IL-23 production and increased IL-10 production in LPS-primed macrophages in a dose-dependent manner. Data are represented as mean ± SEM (n = 3 healthy donors). *p < 0.05 compared with the DMSO control in LPS-primed macrophages, nonparametric Mann–Whitney U test.

Similar articles

Cited by

References

    1. Cooper N. J. 2000. Economic burden of rheumatoid arthritis: a systematic review. Rheumatology (Oxford) 39: 28–33. - PubMed
    1. Bartok B., Firestein G. S. 2010. Fibroblast-like synoviocytes: key effector cells in rheumatoid arthritis. Immunol. Rev. 233: 233–255. - PMC - PubMed
    1. Lafyatis R., Remmers E. F., Roberts A. B., Yocum D. E., Sporn M. B., Wilder R. L. 1989. Anchorage-independent growth of synoviocytes from arthritic and normal joints. Stimulation by exogenous platelet-derived growth factor and inhibition by transforming growth factor-beta and retinoids. J. Clin. Invest. 83: 1267–1276. - PMC - PubMed
    1. Hammaker D., Sweeney S., Firestein G. S. 2003. Signal transduction networks in rheumatoid arthritis. Ann. Rheum. Dis. 62(Suppl. 2): ii86–ii89. - PMC - PubMed
    1. Harigai M., Hara M., Kawamoto M., Kawaguchi Y., Sugiura T., Tanaka M., Nakagawa M., Ichida H., Takagi K., Higami-Ohsako S., et al. 2004. Amplification of the synovial inflammatory response through activation of mitogen-activated protein kinases and nuclear factor kappaB using ligation of CD40 on CD14+ synovial cells from patients with rheumatoid arthritis. Arthritis Rheum. 50: 2167–2177. - PubMed

Publication types

Substances