. 2021 Feb;70(2):436-448.
doi: 10.2337/db20-0454. Epub 2020 Nov 9.

Pancreatic β-Cell-Specific Deletion of VPS41 Causes Diabetes Due to Defects in Insulin Secretion

Affiliations

Pancreatic β-Cell-Specific Deletion of VPS41 Causes Diabetes Due to Defects in Insulin Secretion

Christian H Burns et al. Diabetes. 2021 Feb.

Abstract

Insulin secretory granules (SGs) mediate the regulated secretion of insulin, which is essential for glucose homeostasis. The basic machinery responsible for this regulated exocytosis consists of specific proteins present both at the plasma membrane and on insulin SGs. The protein composition of insulin SGs thus dictates their release properties, yet the mechanisms controlling insulin SG formation, which determine this molecular composition, remain poorly understood. VPS41, a component of the endolysosomal tethering homotypic fusion and vacuole protein sorting (HOPS) complex, was recently identified as a cytosolic factor involved in the formation of neuroendocrine and neuronal granules. We now find that VPS41 is required for insulin SG biogenesis and regulated insulin secretion. Loss of VPS41 in pancreatic β-cells leads to a reduction in insulin SG number, changes in their transmembrane protein composition, and defects in granule-regulated exocytosis. Exploring a human point mutation, identified in patients with neurological but no endocrine defects, we show that the effect on SG formation is independent of HOPS complex formation. Finally, we report that mice with a deletion of VPS41 specifically in β-cells develop diabetes due to severe depletion of insulin SG content and a defect in insulin secretion. In sum, our data demonstrate that VPS41 contributes to glucose homeostasis and metabolism.


Figures

Figure 1
Figure 1
A: Representative Western blots showing the levels of VPS41 in WT, VPS41 KO, and HA-VPS41 rescue INS-1 cells. B: Total cellular insulin levels under basal conditions determined by ELISA. C: Basal and stimulated insulin secretion from KO and rescue INS-1 determined by ELISA. D: Insulin secretion relative to cellular insulin stores. E: Fold-stimulated insulin secretion over basal insulin secretion. Data indicate mean ± SEM; n = 3. *P < 0.05, **P < 0.01, ***P < 0.001, secretion data analyzed by one-way ANOVA.
Figure 2
Figure 2
A: Representative Western blot showing the levels of VPS41 in WT, VPS41 KO, and HA-VPS41S284P rescue INS-1 cells. B: Representative images of indicated cells incubated with EGF–Alexa 647 before or after a short (15-min) or long (90-min) chase. C: Total cellular insulin levels of KO and HA-VPS41S284P rescue INS-1 cells under basal conditions determined by ELISA. D: Basal and stimulated insulin secretion from KO and HA-VPS41S284P rescue INS-1 cells determined by ELISA. E: Insulin secretion relative to cellular insulin stores. F: Fold-stimulated insulin secretion over basal insulin secretion. Data indicate mean ± SEM; n = 3. *P < 0.05, **P < 0.01, ****P < 0.001, secretion data analyzed by one-way ANOVA. Scale bar, 10 μm.
Figure 3
Figure 3
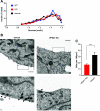
A: Postnuclear supernatants obtained from WT, VPS41 KO, and HA-VPS41 rescue INS-1 cells were separated by equilibrium sedimentation through 0.6–1.6 mol/L sucrose. Fractions were collected from the top of the gradient. Insulin levels were determined by ELISA in each fraction. The graph indicates the percentage of total gradient insulin from one experiment. Similar results were obtained in an additional independent experiment. B: Representative thin-section EM images of VPS41 KO and rescue INS-1 cells. Arrowheads point at SGs. Scale bars, 1 μm. C: Quantification of total SGs per cell normalized to the area of the cell. Data indicate mean ± SEM; n = 45 cells for KO and 18 cells for rescue. ***P < 0.001.
Figure 4
Figure 4
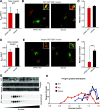
A: TGN rate constants of NPY-GFP-SBP from VPS41 KO and HA-VPS41 rescue INS-1 cells after induction of cargo wave via biotin addition. Data indicate mean ± SEM; n = 9 cells for rescue and n = 5 cells for KO, two independent transfections. B: Representative images of NPY-GFP-SBP costained with insulin 24 h post–biotin addition. Scale bar, 10 μm. C: Manders colocalization coefficient of NPY-GFP-SBP colocalization with insulin signal in VPS41 KO and rescue. Data indicate mean ± SEM; n = 24 cells for rescue and n = 24 cells for KO, two independent transfections. D: TGN rate constants of phogrin-GFP-SBP from VPS41 KO and HA-VPS41 rescue INS-1 cells after induction of cargo wave via biotin addition. Data indicate mean ± SEM; n = 7 cells for rescue and n = 7 cells for KO, two independent transfections. E: Representative images of phogrin-GFP-SBP costained with insulin 24 h post–biotin addition. Scale bar, 10 μm. F: Manders colocalization coefficient of phogrin colocalization with insulin signal in VPS41 KO and rescue. Data indicate mean ± SEM; n = 21 cells for rescue and n = 18 cells for KO, two independent transfections. ****P < 0.0001. G: Postnuclear supernatants obtained from WT, VPS41 KO, and HA-VPS41 rescue INS-1 cells were separated by equilibrium sedimentation through 0.6–1.6 mol/L sucrose as described in Fig. 3. Fractions were assayed for phogrin and synaptophysin (p38) by quantitative fluorescence immunoblotting. H: The graph quantifies phogrin immunoreactivity in each fraction as a percentage of total gradient immunoreactivity from one experiment. Similar results were obtained in an additional independent experiment.
Figure 5
Figure 5
A: Quantification of NPY-pHluorin exocytosis events in VPS41 KO and HA-VPS41 rescue INS-1 cells over a 10-s basal or stimulated period. n = 3 independent transfections. B: Cumulative frequency distribution (Cum. Freq. Dist.) of NPY-pHluorin exocytosis event duration in VPS41 KO and rescue cells (n = 34 KO and 69 HA-VPS41 events from three independent transfections). C: Average Fura curves in response to depolarization by high K+. Bar graph on the right shows quantification of the area under the curve of calcium imaging (Fura) in response to depolarization (high K+) in KO and rescue cells (n = 35 KO and 38 HA-VPS41 cells). Data indicate mean ± SEM. ***P < 0.001. Event number analyzed by one-way ANOVA. Event duration analyzed by Kolmogorov–Smirnov. A.U., arbitrary unit.
Figure 6
Figure 6
A: Representative Western blots of VPS41 protein levels in various tissues from 15-week-old age-matched WT or VPS41 KO mice. B: Quantification of VPS41 protein expression levels normalized to GAPDH. Data indicate mean ± SEM; n = 3. ***P < 0.001. C: Fat and lean mass measurements of age-matched 8-week-old WT and VPS41 KO mice. D: Blood glucose measurement of mice fasted for 8 h. E: Blood glucose measurements during glucose tolerance test. The dashed lines indicate the maximum value of the glucometer. F: Circulating blood insulin levels before and 15 min after glucose injection. Data indicate mean ± SEM; KO, n = 6; and WT, n = 15. ***P < 0.001, ****P < 0.0001, secretion data analyzed by one-way ANOVA.
Figure 7
Figure 7
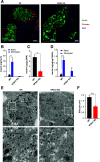
A: Representative immunofluorescence images of whole pancreas slices from WT and VPS41 KO mice stained for insulin (green) and glucagon (red). B: Stimulated insulin secretion from isolated islets from WT and VPS41 KO mice under basal or high-glucose conditions. C: Islet insulin content normalized to DNA content, analyzed by t test. D: Insulin secretion from isolated islets normalized to islet insulin concentration. Data indicate mean ± SEM; n = 3. **P < 0.01, ***P < 0.001, secretion data analyzed by one-way ANOVA. E: Representative thin-section EM images of islets from WT and VPS41 KO mice. Arrowheads point at SGs. Scale bar, 5 μm. F: Quantification of total SGs per cell normalized to the area of the cell. Data indicate mean ± SEM; n = 128 cells for WT from 3 animals and 141 cells from 3 animals. ****P < 0.0001.

Similar articles

Cited by

References

    1. Ahras M, Otto GP, Tooze SA. Synaptotagmin IV is necessary for the maturation of secretory granules in PC12 cells. J Cell Biol 2006;173:241–251 - PMC - PubMed
    1. Borgonovo B, Ouwendijk J, Solimena M. Biogenesis of secretory granules. Curr Opin Cell Biol 2006;18:365–370 - PubMed
    1. Dittie AS, Hajibagheri N, Tooze SA. The AP-1 adaptor complex binds to immature secretory granules from PC12 cells, and is regulated by ADP-ribosylation factor. J Cell Biol 1996;132:523–536 - PMC - PubMed
    1. Hou JC, Min L, Pessin JE. Insulin granule biogenesis, trafficking and exocytosis. Vitam Horm 2009;80:473–506 - PMC - PubMed
    1. Klumperman J, Kuliawat R, Griffith JM, Geuze HJ, Arvan P. Mannose 6-phosphate receptors are sorted from immature secretory granules via adaptor protein AP-1, clathrin, and syntaxin 6-positive vesicles. J Cell Biol 1998;141:359–371 - PMC - PubMed

Publication types

Substances