. 2021 Jan:93:70-84.e4.
doi: 10.1016/j.exphem.2020.11.002. Epub 2020 Nov 7.

Inhibition of TGFβ1 and TGFβ3 promotes hematopoiesis in Fanconi anemia

Affiliations

Inhibition of TGFβ1 and TGFβ3 promotes hematopoiesis in Fanconi anemia

Alfredo Rodríguez et al. Exp Hematol. 2021 Jan.

Abstract

Fanconi anemia (FA) is a chromosome instability syndrome with congenital abnormalities, cancer predisposition and bone marrow failure (BMF). Although hematopoietic stem and progenitor cell (HSPC) transplantation is the recommended therapy, new therapies are needed for FA patients without suitable donors. BMF in FA is caused, at least in part, by a hyperactive growth-suppressive transforming growth factor β (TGFβ) pathway, regulated by the TGFβ1, TGFβ2, and TGFβ3 ligands. Accordingly, the TGFβ pathway is an attractive therapeutic target for FA. While inhibition of TGFβ1 and TGFβ3 promotes blood cell expansion, inhibition of TGFβ2 is known to suppress hematopoiesis. Here, we report the effects of AVID200, a potent TGFβ1- and TGFβ3-specific inhibitor, on FA hematopoiesis. AVID200 promoted the survival of murine FA HSPCs in vitro. AVID200 also promoted in vitro the survival of human HSPCs from patients with FA, with the strongest effect in patients progressing to severe aplastic anemia or myelodysplastic syndrome (MDS). Previous studies have indicated that the toxic upregulation of the nonhomologous end-joining (NHEJ) pathway accounts, at least in part, for the poor growth of FA HSPCs. AVID200 downregulated the expression of NHEJ-related genes and reduced DNA damage in primary FA HSPC in vitro and in in vivo models. Collectively, AVID200 exhibits activity in FA mouse and human preclinical models. AVID200 may therefore provide a therapeutic approach to improving BMF in FA.


Conflict of interest statement

Conflict of interest disclosure ADD is a consultant/advisory board member for Lilly Oncology, Merck-EMD Serono, Intellia Therapeutics, Sierra Oncology, Cyteir Therapeutics, Third Rock Ventures, AstraZeneca, Ideaya Inc., Cedilla Therapeutics Inc.; is a stockholder in Ideaya Inc., Cedilla Therapeutics Inc., and Cyteir; and reports receiving commercial research grants from Lilly Oncology and Merck-EMD Serono. Other authors declare no conflicts of interest.

Figures

Figure 1.
Figure 1.. Inhibition of the TGFβ pathway promotes clonogenic growth of HSPCs from FA mice.
A) Western blots of the lysates from murine bone marrow cells. Lin cells from bone marrow of wild-type mice were cultured for 2 h in presence of TGFβ1 (5 ng/ml), TGFβ2 (5 ng/ml) or TGFβ3 (5 ng/ml) with or without AVID200. Note that two types of antibodies were used to detect the phospho-SMAD2 levels. One of the antibodies was used only against phospho-Smad2 (p-Smad2) whereas the other one was against both phosphor-Smad2 and Smad3 (p-Smad2/3). A representative blot is shown. B) TGFβ pathway inhibitors promote colony formation of murine Fancd2−/− HSPCs. Lin cells from wild-type (WT) or Fancd2−/− mice were cultured for 7 days in methylcellulose medium with inhibitors of the TGFβ pathway, namely, SD208 (10 μM), 1D11 (10 μg/mL) and AVID200 (0.2 ng/mL). Hematopoietic colonies were quantified (n=3). p-values of 0.01 to 0.05 were considered significant (*), p-values of 0.001 to 0.01 were considered very significant (**) and p-values of <0.001 were considered extremely significant (****). Data in (B) are represented as mean ± SEM. See also Supplementary Figure 1.
Figure 2.
Figure 2.. Inhibition of the TGFβ pathway with AVID200 rescues clonogenic defects of primary bone marrow from FA patients.
A) TGFβ pathway inhibitors promote cell growth (colony formation) of primary human FA-like cells. Healthy human cord blood CD34+ cells were infected with two different lentivirus expressing a shRNA against the human FANCD2 gene, thus generating FA-like cells. Human FA-like cells were then exposed to increasing concentrations of AVID200 (0.06, 0.2, 0.6, and 1.8 ng/mL) or SD208 (1 μM), as a positive control of TGFβ pathway inhibition, colony formation was assessed after 14 days of culture in methylcellulose medium (n=3). B) Levels of free TGFβ1, TGFβ2 and TGFβ3 ligands in primary bone marrow plasma from FA patients (n=12) and healthy donors (n=5). Levels of free TGFβ2 are significantly reduced in BM plasma from FA patients, whereas levels of free TGFβ3 are significantly increased in FA patients. C) Clonogenic growth of bone marrow progenitors isolated from FA patients (n=19) and healthy donors (n=3). Primaryprogenitor cells were isolated from bone marrow of 21 FA patients or 3 healthy donors and cultured in triplicates in complete methylcellulose medium with or without AVID200 (0.2 ng/mL) for 14 days and clonogenic growth was assessed for total colonies, myeloid colonies and erythroid colonies, patient 1 and 15 behaved as outliers and were removed from statistical analysis. Left panel shows raw average CFU-C numbers per sample from normal donor or FA patient. Right panel shows the fold change in colony numbers in the AVID200 treated samples after normalization with respect to the vehicle-treated control. Comparisons in both raw CFU-C numbers and fold change converted numbers were made by matching each vehicle-treated sample with its respective AVID200 treated sample per patient (matching pair). D) Representative photomicrograph showing improved clonogenic growth of a FA bone marrow sample after AVID200 exposure in vitro in comparison to a bone marrow sample from a healthy donor control. Erythroid colonies are indicated in red, Myeloid colonies are indicated in yellow, multipotent colonies are indicated in blue. E) Correlation between the degree of anemia in FA patients and response to AVID200 showing that the response to AVID200 is significantly better in the bone marrow from FA patients with severe bone marrow failure than the bone marrow from patients with mild anemia. Left panel. Raw average CFU-C numbers per patient’s sample. Right panel. Absolute mean colony numbers were normalized to fold-change and FA patients were classified according to the severity of their aplastic anemia. F) Correlation between the presence of a cytogenetic clone in FA patients and the response to AVID200 showing that patients with chromosomal clonal abnormalities, detected by bone marrow karyotype or FISH, responded better to AVID200 treatment in vitro. Left panel. Raw average CFU-C number per patient’s sample. Right panel. For comparisons the absolute mean colony numbers were normalized to fold-change and FA patients were classified according to bone marrow karyotypes performed the day of progenitor cells isolation and culture. p-values of 0.01 to 0.05 were considered significant (*), p-values of 0.001 to 0.01 were considered very significant (**) and p-values of <0.001 were considered extremely significant (***). Data in (A) are represented as mean ± SEM, data in (B), (C), (E) and (F) are presented as boxplots. See also Supplementary Figure 2.
Figure 3.
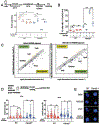
Figure 3.. Inhibition of the TGFβ pathway with AVID200 rescues genotoxicity in FA mouse models.
A) AVID200 improves the survival of mouse FA bone marrow after exposure to acetaldehyde. Lin cells from bone marrow of wild-type (WT) or Fancd2−/− mice were pretreated with AVID200 (0.2 ng/mL) and exposed to acetaldehyde (2 mM) for 4 hrs. After washing, the cells were cultured in complete methylcellulose medium with and without AVID200 for 7 days and survival of the hematopoietic progenitors was determined by quantification of hematopoietic colonies (n=3). B) AVID200 reduces acetaldehyde-induced DNA damage in HSPCs from bone marrow of FA mice. LSK cells from wild-type (WT) or Fancd2−/− mice were pretreated with AVID200 (0.2 ng/mL) for 24 h and exposed to acetaldehyde (2 mM) for 4 h. After washing, the cells were allowed to recover for 48 h in StemSpan Medium supplemented with cytokines TPO, SCF, Flt3 ligand and L-Glutamine. The cells were then analyzed for γH2AX foci by immunofluorescence. 100 cells were counted per condition (n=3). C) AVID200 modifies the gene expression profile of DNA repair related genes in mouse LSK cells. LSK cells from wild-type (WT) or Fancd2−/− mice were exposed to AVID200 (0.2 ng/mL) for 48 hrs and gene expression profile was analyzed. Note the downregulation of Trp53bp1, Prkdc and Trp53, in cells from Fancd2−/− mice (n=3). D) AVID200 prevents polyinosinic:polycytidylic acid (pI:pC)-induced DNA damage in LT-HSCs from bone marrow of FA mice in vivo. Wild-type (WT) and Fancd2−/− mice (n=3 mice per group) were co-injected with water, pI:pC (5 mg/kg), AVID200 (5 mg/kg) or a combination of both. LT-HSCs were isolated and DNA damage was assessed by immunofluorescence staining of γH2AX foci, left panel shows the amount of γH2AX foci per cell 48 h after injection, whereas right panel shows the amount of γH2AX foci per cell after 30 days of 2 injections per week (n=5 mice per group). (E) Representative pictures of γH2AX foci in LT-HSC are shown. At least 50 cells from each group were scored for γH2AX foci. p-values of 0.01 to 0.05 were considered significant (*), p-values of 0.001 to 0.01 were considered very significant (**) and p-values of <0.001 were considered extremely significant (***, ****). Data in (A) and (B) are represented as mean ± SEM, data in (C) are presented as scatter plot, data in (D) are presented as boxplot. See also Supplementary Figure 3.
Figure 4.
Figure 4.. Inhibition of the TGFβ pathway with AVID200 rescues genotoxicity in FA-derived human cell lines.
A) AVID200 improves the survival of FANCG-deficient human FA lymphoblast cells in presence of acetaldehyde. FANCG-deficient parental cells (EUFA316+EV) and FANCG-corrected cells (EUFA316+FANCG) were exposed to graded concentration of acetaldehyde and AVID200 (0.2 ng/mL) for 6 days and survival was determined by CellTiter Glo reagent (n=12 per condition). B) AVID200 pretreatment reduces the frequency of Mitomycin C (MMC)-induced chromosomal aberrations in FANCG-deficient cells. EUFA316+EV cells and EUFA316+FANCG cells were pre-treated with AVID200 before exposure to MMC and metaphase spreads of the chromosomes were scored for chromosomal aberrations. Quantification of the MMC-induced chromosomal aberrations is shown in the left panel (n=3). A representative metaphase from the EUFA316+EV cell line treated with MMC is shown in the right panel, red arrow indicates a radial figure. C) Volcano plot showing DNA repair-related differentially expressed genes of the FANCG-deficient cell line (EUFA316+EV) relative to the FANCG-corrected cell line (EUFA316+FANCG). The log fold change in the EUFA316+EV cell line versus the EUFA316+G cell line is represented on the x-axis. The y-axis shows the Log10 of the p value. Downregulated genes with a p value of 0.05 are indicated in blue, whereas upregulated genes with a p value of 0.05 are indicated in red (n=3). D) Volcano plot showing DNA repair-related differentially expressed genes of the FANCG-deficient cell line (EUFA316+EV) after 24 h exposure to AVID200 (0.2 ng/mL). The log fold change in the EUFA316+EV + AVID200 cell line versus the untreated cell line is represented on the x-axis. The y-axis shows the Log10 of the p value. Downregulated genes with a p value of 0.05 are indicated in blue, whereas upregulated genes with a p value of 0.05 are indicated in red (n=3). p-values of 0.01 to 0.05 were considered significant (*), p-values of 0.001 to 0.01 were considered very significant (**) and p-values of <0.001 were considered extremely significant (***, ****). Data in (A) are represented as mean ± SEM, data in (B) are presented as boxplot, data in (C) and (D) are presented as volcano plots. See also Supplementary Figure 4.

Similar articles

Cited by

References

    1. Shimamura A. and Alter BP, Pathophysiology and management of inherited bone marrow failure syndromes. Blood Rev, 2010. 24(3): p. 101–22. - PMC - PubMed
    1. Ceccaldi R, Sarangi P, and D’Andrea AD, The Fanconi anaemia pathway: new players and new functions. Nat Rev Mol Cell Biol, 2016. 17(6): p. 337–49. - PubMed
    1. Tischkowitz M. and Dokal I, Fanconi anaemia and leukaemia–clinical and molecular aspects. Br. J. Haematol, 2004. 126(2): p. 176–191. - PubMed
    1. Ceccaldi R, et al., Bone marrow failure in Fanconi anemia is triggered by an exacerbated p53/p21 DNA damage response that impairs hematopoietic stem and progenitor cells. Cell Stem Cell, 2012. 11(1): p. 36–49. - PMC - PubMed
    1. Garaycoechea JI and Patel KJ, Why does the bone marrow fail in Fanconi anemia? Blood, 2014. 123(1): p. 26–34. - PubMed

Publication types

MeSH terms

Substances