

NDRG2 ablation reprograms metastatic cancer cells towards glutamine dependence via the induction of ASCT2
- PMID: 33162818
- PMCID: PMC7645990
- DOI: 10.7150/ijbs.48066
NDRG2 ablation reprograms metastatic cancer cells towards glutamine dependence via the induction of ASCT2
Abstract
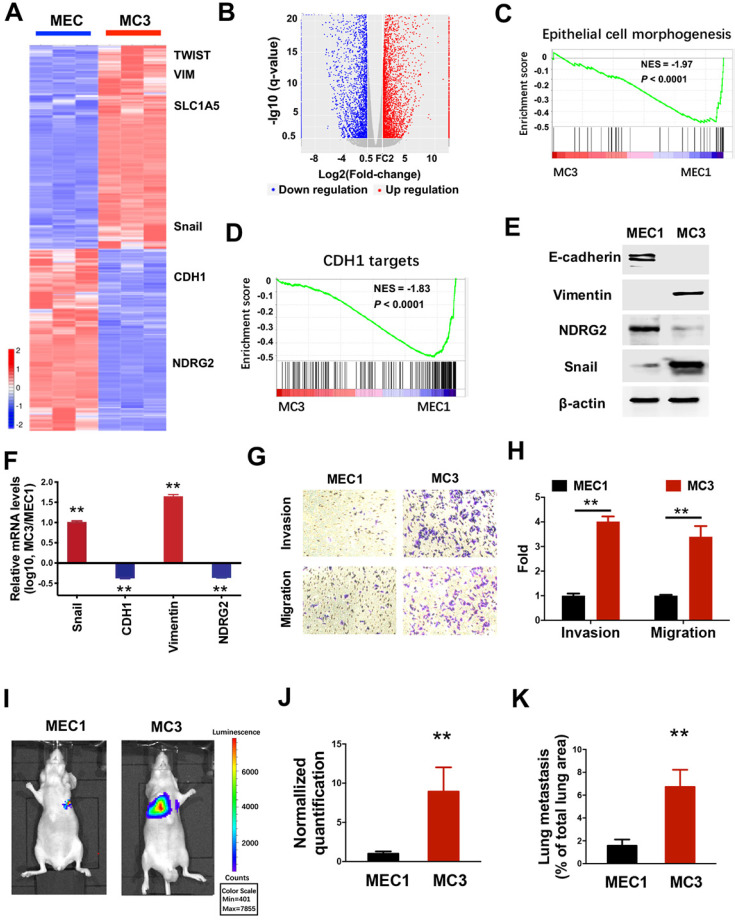
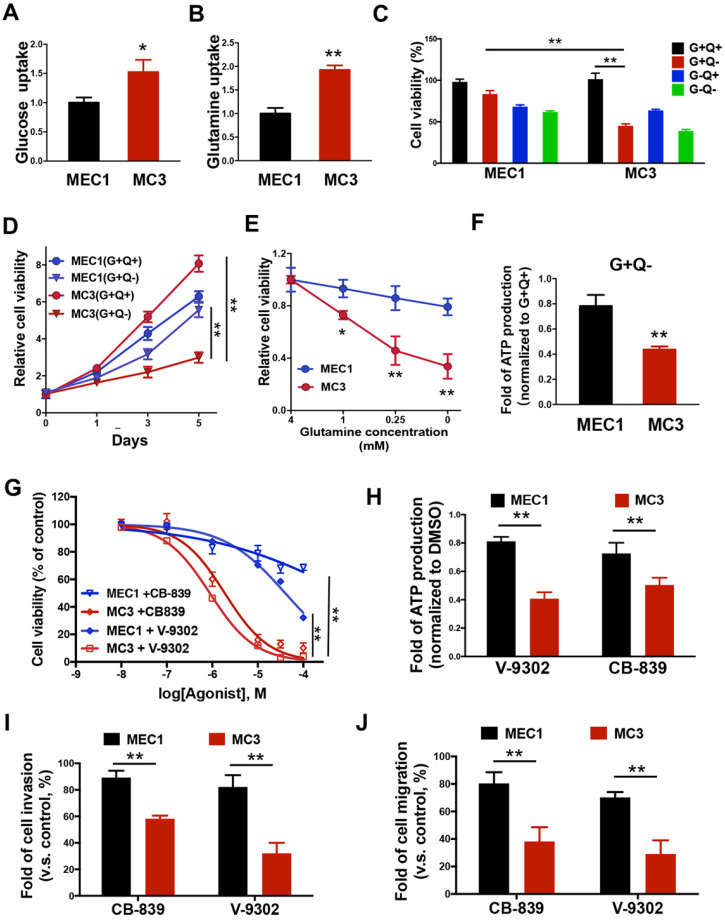
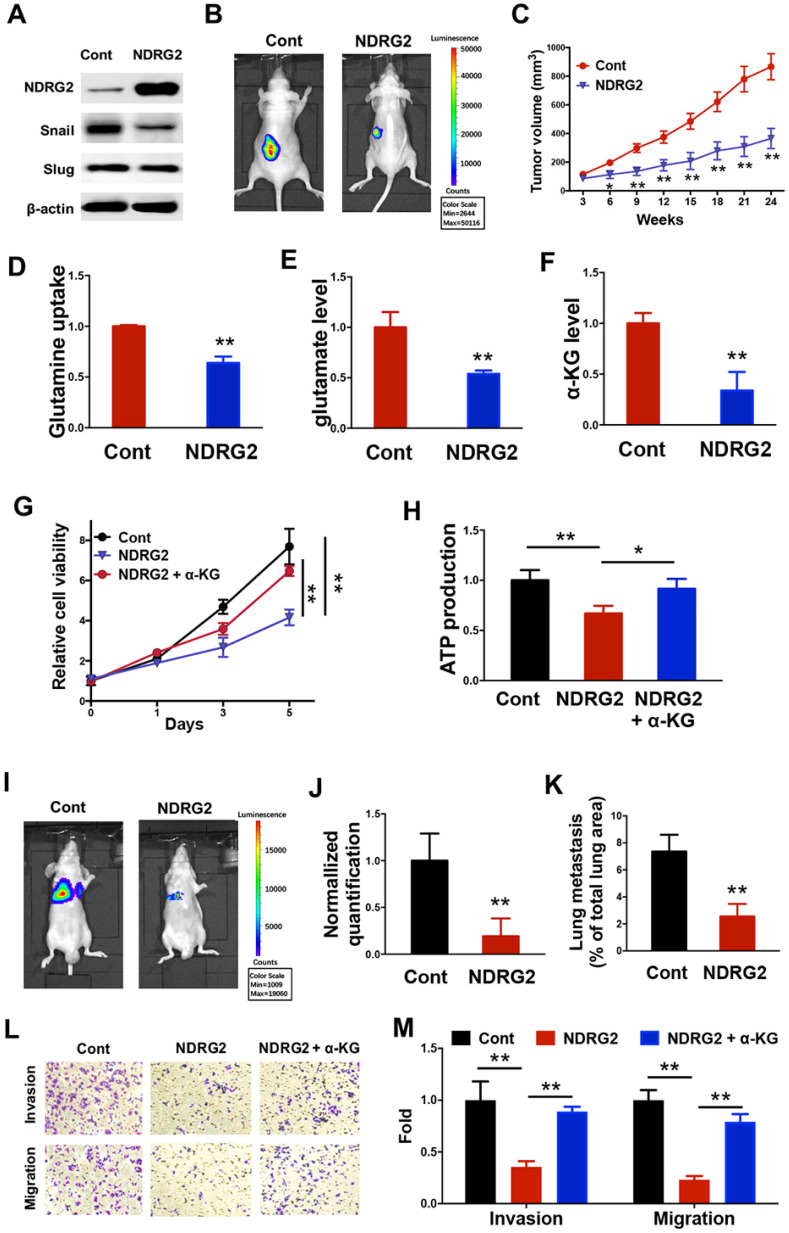
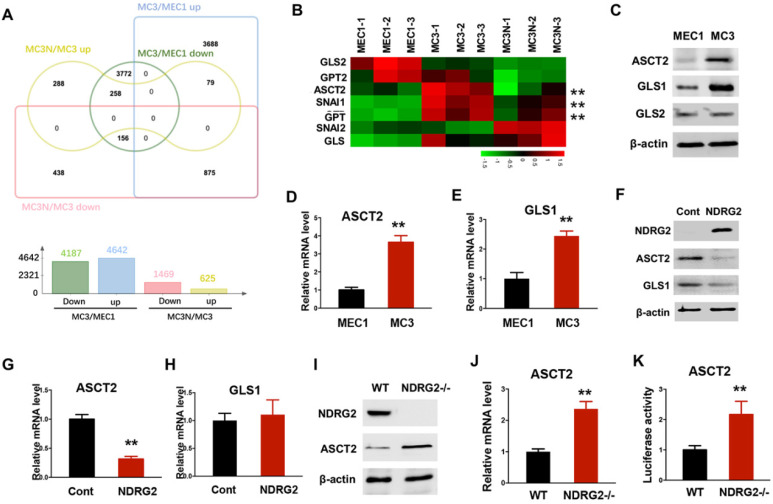
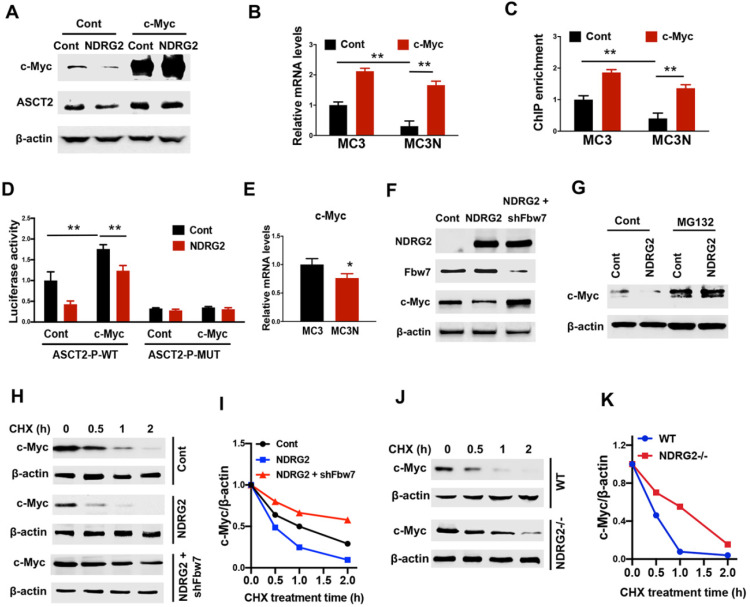
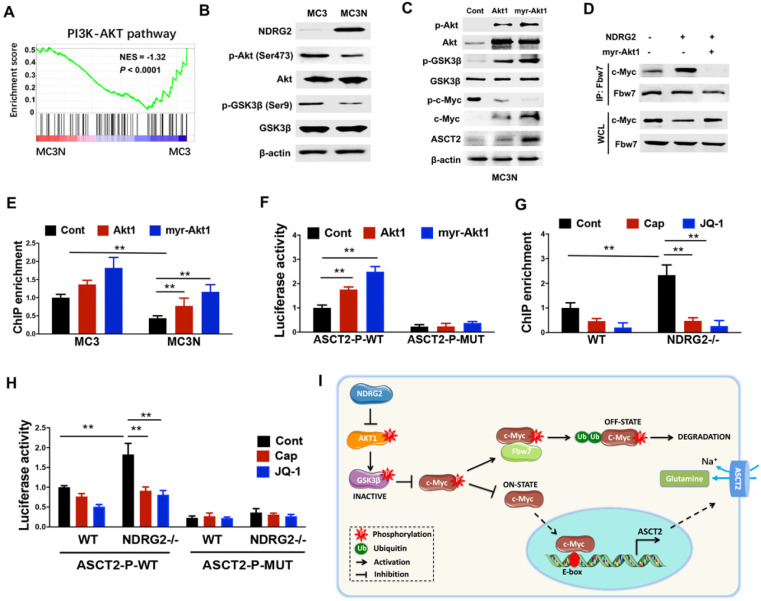
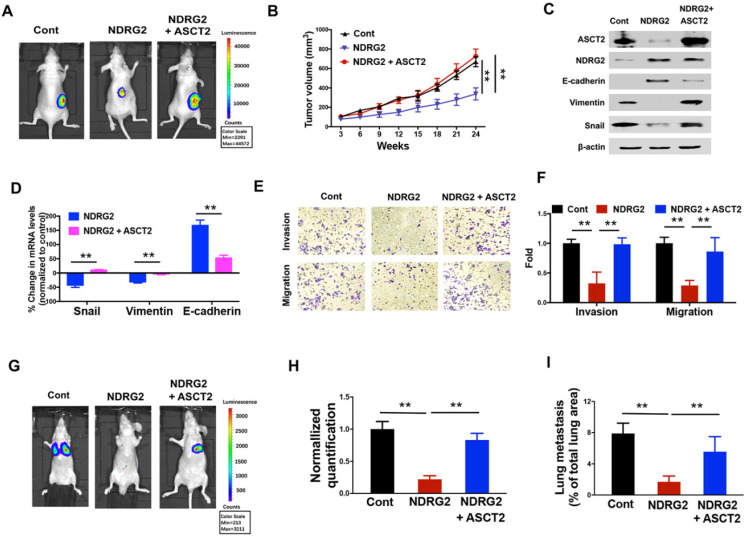
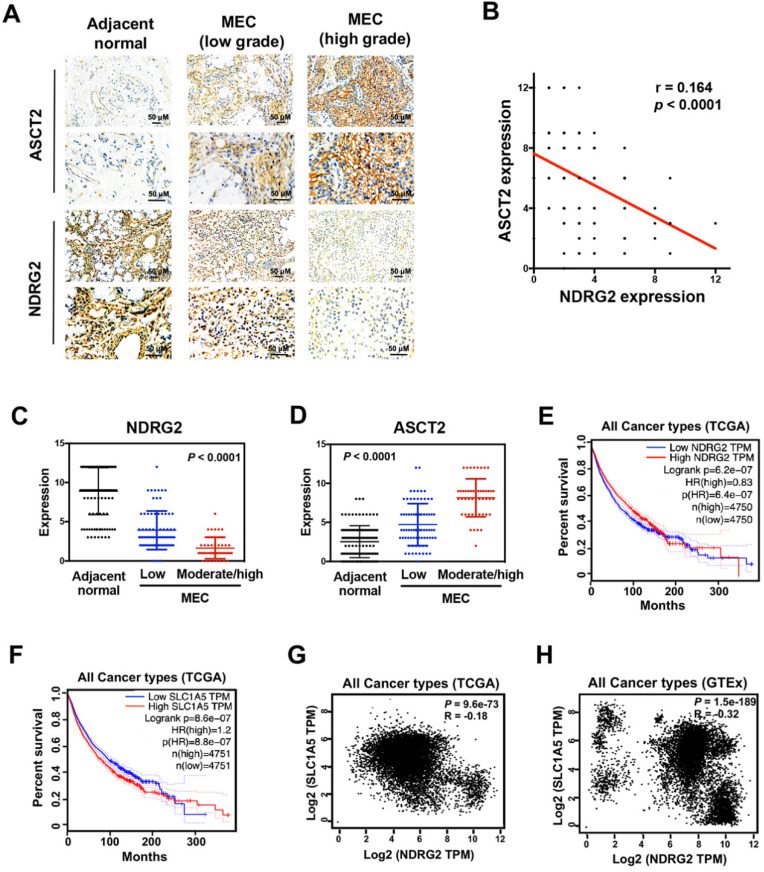
Background: Metastasis is the most common cause of lethal outcome in various types of cancers. Although the cell proliferation related metabolism rewiring has been well characterized, less is known about the association of metabolic changes with tumor metastasis. Herein, we demonstrate that metastatic tumor obtained a mesenchymal phenotype, which is obtained by the loss of tumor suppressor NDRG2 triggered metabolic switch to glutamine metabolism. Methods: mRNA-seq and gene expression profile analysis were performed to define the differential gene expressions in primary MEC1 and metastatic MC3 cells and the downstream pathways of NDRG2. NDRG2 regulation of Fbw7-dependent c-Myc stability were determined by immunoprecipitation and protein half-life assay. Luciferase reporter and ChIP assays were used to determine the roles of Akt and c-Myc in mediating NDRG2-dependent regulation of ASCT2 in in both tumor and NDRG2-knockout MEF cells. Finally, the effect of the NDRG2/Akt/c-Myc/ASCT2 signaling on glutaminolysis and tumor metastasis were evaluated by functional experiments and clinical samples. Results: Based on the gene expression profile analysis, we identified metastatic tumor cells acquired the mesenchymal-like characteristics and displayed the increased dependency on glutamine utilization. Further, the gain of NDRG2 function blocked epithelial-mesenchymal transition (EMT) and glutaminolysis, potentially through suppression of glutamine transporter ASCT2 expression. The ASCT2 restoration reversed NDRG2 inhibitory effect on EMT program and tumor metastasis. Mechanistic study indicates that NDRG2 promoted Fbw7-dependent c-Myc degradation by inhibiting Akt activation, and subsequently decreased c-Myc-mediated ASCT2 transcription, in both tumor and NDRG2-knockout MEF cells. Supporting the biological significance, the reciprocal relationship between NDRG2 and ASCT2 were observed in multiple types of tumor tissues, and associated with tumor malignancy. Conclusions: NDRG2-dependent repression of ASCT2 presumably is the predominant route by which NDRG2 rewires glutaminolysis and blocks metastatic tumor survival. Targeting glutaminolytic pathway may provide a new strategy for the treatment of metastatic tumors.
Keywords: ASCT2; EMT; NDRG2; c-Myc; glutaminolysis; mucoepidermoid carcinoma.
© The author(s).
Conflict of interest statement
Competing Interests: The authors have declared that no competing interest exists.
Figures
Similar articles
-
Tumor suppressor NDRG2 inhibits glycolysis and glutaminolysis in colorectal cancer cells by repressing c-Myc expression.Oncotarget. 2015 Sep 22;6(28):26161-76. doi: 10.18632/oncotarget.4544. Oncotarget. 2015. PMID: 26317652 Free PMC article.
-
LncRNA SLC1A5-AS/MZF1/ASCT2 Axis Contributes to Malignant Progression of Hepatocellular Carcinoma.Discov Med. 2023 Dec;35(179):995-1014. doi: 10.24976/Discov.Med.202335179.96. Discov Med. 2023. PMID: 38058065
-
Lobetyolin inhibits the proliferation of breast cancer cells via ASCT2 down-regulation-induced apoptosis.Hum Exp Toxicol. 2021 Dec;40(12):2074-2086. doi: 10.1177/09603271211021476. Epub 2021 Jun 2. Hum Exp Toxicol. 2021. PMID: 34075790
-
The role of the glutamine transporter ASCT2 in antineoplastic therapy.Cancer Chemother Pharmacol. 2021 Apr;87(4):447-464. doi: 10.1007/s00280-020-04218-6. Epub 2021 Jan 19. Cancer Chemother Pharmacol. 2021. PMID: 33464409 Review.
-
The Function of N-Myc Downstream-Regulated Gene 2 (NDRG2) as a Negative Regulator in Tumor Cell Metastasis.Int J Mol Sci. 2022 Aug 19;23(16):9365. doi: 10.3390/ijms23169365. Int J Mol Sci. 2022. PMID: 36012631 Free PMC article. Review.
Cited by
-
The Role of PI3K/AKT/mTOR Signaling in Hepatocellular Carcinoma Metabolism.Int J Mol Sci. 2023 Jan 31;24(3):2652. doi: 10.3390/ijms24032652. Int J Mol Sci. 2023. PMID: 36768977 Free PMC article. Review.
-
Degradation of HIF-1α induced by curcumol blocks glutaminolysis and inhibits epithelial-mesenchymal transition and invasion in colorectal cancer cells.Cell Biol Toxicol. 2023 Oct;39(5):1957-1978. doi: 10.1007/s10565-021-09681-2. Epub 2022 Jan 27. Cell Biol Toxicol. 2023. PMID: 35083610
-
CD147 confers temozolomide resistance of glioma cells via the regulation of β-TrCP/Nrf2 pathway.Int J Biol Sci. 2021 Jul 13;17(12):3013-3023. doi: 10.7150/ijbs.60894. eCollection 2021. Int J Biol Sci. 2021. PMID: 34421346 Free PMC article.
-
Glutamine metabolism in tumor metastasis: Genes, mechanisms and the therapeutic targets.Heliyon. 2023 Oct 5;9(10):e20656. doi: 10.1016/j.heliyon.2023.e20656. eCollection 2023 Oct. Heliyon. 2023. PMID: 37829798 Free PMC article. Review.
-
Development and validation of a nomogram to predict occult cervical metastasis in early oral squamous cell carcinoma.Ann Transl Med. 2023 Jan 31;11(2):39. doi: 10.21037/atm-22-5859. Epub 2023 Jan 10. Ann Transl Med. 2023. PMID: 36819503 Free PMC article.
References
-
- Hicks MJ, el-Naggar AK, Flaitz CM, Luna MA, Batsakis JG. Histocytologic grading of mucoepidermoid carcinoma of major salivary glands in prognosis and survival: a clinicopathologic and flow cytometric investigation. Head Neck. 1995;17:89–95. - PubMed
-
- Wen DS, Zhu XL, Guan SM, Wu YM, Yu LL, Wu JZ. Silencing of CXCR4 inhibits the proliferation, adhesion, chemotaxis and invasion of salivary gland mucoepidermoid carcinoma Mc3 cells in vitro. Oral Oncol. 2008;44:545–54. - PubMed
-
- Cai B, Miao Y, Liu Y, Xu X, Guan S, Wu J. et al. Nuclear multidrug-resistance related protein 1 contributes to multidrug-resistance of mucoepidermoid carcinoma mainly via regulating multidrug-resistance protein 1: a human mucoepidermoid carcinoma cells model and Spearman's rank correlation analysis. PLoS One. 2013;8:e69611. - PMC - PubMed
-
- Koppenol WH, Bounds PL, Dang CV. Otto Warburg's contributions to current concepts of cancer metabolism. Nat Rev Cancer. 2011;11:325–37. - PubMed
Publication types
MeSH terms
Substances
LinkOut - more resources
Full Text Sources
