. 2020 Nov 5;11(1):5596.
doi: 10.1038/s41467-020-19360-1.

Alpha-ketoglutarate ameliorates age-related osteoporosis via regulating histone methylations

Affiliations

Alpha-ketoglutarate ameliorates age-related osteoporosis via regulating histone methylations

Yuan Wang et al. Nat Commun. .

Abstract

Age-related osteoporosis is characterized by the deterioration in bone volume and strength, partly due to the dysfunction of bone marrow mesenchymal stromal/stem cells (MSCs) during aging. Alpha-ketoglutarate (αKG) is an essential intermediate in the tricarboxylic acid (TCA) cycle. Studies have revealed that αKG extends the lifespan of worms and maintains the pluripotency of embryonic stem cells (ESCs). Here, we show that the administration of αKG increases the bone mass of aged mice, attenuates age-related bone loss, and accelerates bone regeneration of aged rodents. αKG ameliorates the senescence-associated (SA) phenotypes of bone marrow MSCs derived from aged mice, as well as promoting their proliferation, colony formation, migration, and osteogenic potential. Mechanistically, αKG decreases the accumulations of H3K9me3 and H3K27me3, and subsequently upregulates BMP signaling and Nanog expression. Collectively, our findings illuminate the role of αKG in rejuvenating MSCs and ameliorating age-related osteoporosis, with a promising therapeutic potential in age-related diseases.


Conflict of interest statement

The authors declare no competing interests.

Figures
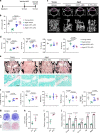
Fig. 1
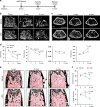
Fig. 1. αKG increases the bone mass of aged female mice.
a Schematic representation of αKG administration. b αKG administration increased circulating αKG levels of aged mice (n = 6, by one-way ANOVA with Tukey’s post hoc test). c Representative images of microCT reconstruction of lumber 4 (L4) vertebrae. Scale bar, 1 mm (upper) or 500 μm (lower). The magenta circles indicate the region of interest (ROI). d Quantitative microCT analyses of trabecular bone of L4 vertebrae (n = 6, by one-way ANOVA with Tukey’s post hoc test). Bone volume (BV/TV, %); trabecular number (Tb.N, 1/mm); trabecular thickness (Tb.Th, mm); trabecular separation (Tb.Sp, mm). e Representative Von Kossa staining and TRAP staining images of L4 vertebrae. Scale bar, 500 μm (upper) or 50 μm (lower). f Histomorphometric analyses of L4 vertebrae (n = 6, by one-way ANOVA with Tukey’s post hoc test). Number of osteoblasts (N.Ob/B.Pm, 1/mm); Number of osteoclasts (N.Oc/B.Pm, 1/mm); Mineral apposition rate (MAR, μm/day); Mineralizing surface per bone surface (MS/BS, %); Bone formation rate per bone surface (BFR/BS, μm3/μm2/day). g Representative images of alkaline phosphatase (ALP) and Alizarin Red S (ARS) staining of bone marrow MSCs isolated from the aged mice with or without αKG treatment. h Quantitative analysis of the ALP activity (n = 3, by two-tailed Student’s t-test). i Quantitative analysis of the mineralization (n = 3, by two-tailed Student’s t-test). j Quantitative RT-PCR results of mRNA expression of Runx2, Sp7, Col1a1, Alp, and Bglap in MSCs isolated from vehicle/αKG treated mice (n = 3, by two-tailed Student’s t-test). All data are shown as mean ± SEM.
Fig. 2
Fig. 2. αKG attenuates age-related bone loss.
a Schematic representation of αKG administration. b MicroCT reconstruction of distal ends of femurs in longitudinal direction. Scale bar, 500 μm. c MicroCT reconstruction of distal ends of femurs in horizontal direction. Scale bar, 1 mm. d Quantitative microCT analyses of distal femurs (n = 6). e Von Kossa staining of undecalcified sections of femurs. Scale bar, 500 μm. f Histomorphometric analyses of distal femurs (n = 6). All data are shown as mean ± SEM. The P values were calculated by two-way ANOVA with Sidak’s multiple comparisons test.
Fig. 3
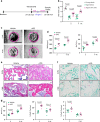
Fig. 3. αKG accelerates the bone defect healing of aged rats.
a Schematic representation of bone defect surgery and αKG administration. b Circulating αKG levels after αKG administration (n = 6, by one-way ANOVA with Tukey’s post hoc test). c Representative images of microCT reconstruction of femoral cortical bone defects at 2 and 4 weeks. The magenta dotted lines indicate the original position of the defect margin. Scale bar, 1 mm. d Quantitative microCT analyses of bone mineral density (BMD, mg/cc) and bone volume/total volume (BV/TV, %) within the original defect area (n = 6, by two-way ANOVA with Sidak’s multiple comparisons test). e, f Representative images of H&E staining and TRAP staining of femoral cortical bone defects. Scar bar, 100 μm (H&E), 50 μm (TRAP). g Histomorphometric analyses within the bone defect (n = 6, by two-way ANOVA with Sidak’s multiple comparisons test). Data are expressed as mean ± SEM.
Fig. 4
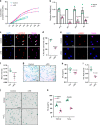
Fig. 4. αKG promotes proliferation, migration, and osteogenesis of aged MSCs.
a Intracellular αKG concentration in MSCs isolated from young (3-month-old) and aged (18-month-old) mice (n = 3, by two-tailed Student’s t-test). b Intracellular αKG concentration in aged MSCs in response to αKG treatment for 3 days (n = 3, by one-way ANOVA with Tukey’s post hoc test). c EdU incorporation in aged MSCs treated with different concentrations of αKG (n = 4, by one-way ANOVA with Tukey’s post hoc test). αKG treatment increased the number of EdU+ cells. d Crystal violet staining of colony-forming units of MSCs. e Quantitative analysis of colony-forming unit assay (colonies per well, n = 6, by two-tailed Student’s t-test). f, g Scratch assay of aged MSCs and quantitative analyses. Magenta dotted lines indicate start (0 h), half (9 h), and end (18 h) positions of MSCs after scraping (n = 5, by two-way ANOVA with Sidak’s multiple comparisons test). Scale bar, 500 μm. h, i Crystal violet staining of migrated MSCs from the upper chamber to bottom lower of the membrane and quantitative results (n = 3, by two-tailed Student’s t-test). Scale bar, 100 μm. j Representative images of ALP, ARS and Van Gieson staining of aged MSCs. k Quantitative analysis of the ALP activity in MSCs (n = 3, by two-tailed Student’s t-test). l Quantitative analysis of calcium mineralization in MSCs (n = 3, by two-tailed Student’s t-test). m Quantitative RT-PCR results of mRNA expression of Runx2, Sp7, Col1a1, Alp, and Bglap in MSCs treated with vehicle/αKG (n = 3, by two-tailed Student’s t-test). Data are expressed as mean ± SEM.
Fig. 5
Fig. 5. αKG ameliorates age-associated hallmarks of aged MSCs.
a Cumulative population doubling (CPD) of aged MSCs (n = 3). b Quantitative RT-PCR results of senescence-associated genes (p16, p21, p53, Il6) in aged MSCs (n = 3). Cells were treated with 2 mM αKG for 3 days. c, d Immunofluorescence of Lamin A/C and quantification of nuclear abnormality in MSCs (n = 3). White arrows indicate blebbing in the nuclear envelope. Scale bar, 50 μm. e, f Immunofluorescence of γH2A.X and quantification of mean density in MSCs (n = 3). Scale bar, 20 μm. g, h Representative images of senescence-associated β-galactosidase (SA-β-gal) staining of aged MSCs and quantification of positive cells (n = 5). Scale bar, 50 μm. i ROS levels in aged MSCs (n = 3) were decreased after αKG supplement for 3 days. j SA-β-gal staining of aged MSCs stimulated with H2O2. Scale bar, 50 μm. k Quantification of SA-β-gal positive MSCs (n = 4). Data are expressed as mean ± SEM. The P values were calculated by two-tailed Student’s t-test, except k, which was analyzed by two-way ANOVA with Sidak’s multiple comparisons test.
Fig. 6
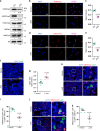
Fig. 6. αKG decreases H3K9me3 and H3K27me3 abundance in aged MSCs.
a Western blot analyses of H3K9me3, H3K27me3, H3K4me3, H3K9ac, and H3K27ac in aged MSCs treated with 2 mM αKG for 3 days. b, c Immunofluorescence staining of H3K9me3 and quantification (n = 5). Aged cells were treated with 2 mM αKG for 3 days. Scale bar, 50 μm. d, e Immunofluorescence staining of H3K27me3 and quantification (n = 5). Scale bar, 50 μm. f, g Immunofluorescence staining and quantification of LepR+ cells in vertebrae from aged mice fed with αKG for a month (n = 6). Scale bar, 50 μm. h, i Double staining and quantification of LepR-positive and H3K9me3-positive MSCs in vertebrae from aged mice fed with αKG for a month (n = 6). Scale bar, 50 μm (left) or 10 μm (right). j, k Double staining and quantification of LepR-positive and H3K27me3-positive MSCs in vertebrae from aged mice fed with αKG for a month (n = 6). Scale bar, 50 μm (left) or 10 μm (right). Data are presented as mean ± SEM. The P values were calculated by two-tailed Student’s t-test.
Fig. 7
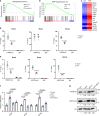
Fig. 7. αKG regulates BMP pathway.
a, b Gene set enrichment analysis (GSEA) showed increased expression of osteogenesis and BMP-regulated genes in αKG-treated MSCs. Cells isolated from aged mice were treated with 2 mM αKG for 48 h. c Heatmap of representative genes. d ChIP-qPCR assay revealed that αKG decreased the occupancy of H3K9me3 in the promoter regions of Bmp2 and Nanog (n = 3, by two-tailed Student’s t-test). e ChIP-qPCR showed that αKG decreased the occupancy of H3K27me3 in the promoter regions of Bmp2, Bmp4, and Nanog (n = 3, by two-tailed Student’s t-test). f Quantitative RT-PCR (n = 3, by one-way ANOVA with Tukey’s post hoc test). Histone demethylases inhibitor JIB 04 prohibited the effect of αKG on promoting Bmp2, Bmp4, and Nanog expression. g Western blot analyses of H3K9me3 and H3K27me3 in aged MSCs after supplementation of αKG and JIB 04. Data are shown as mean ± SEM.

Similar articles

Cited by

References

    1. Johnson FB, Sinclair DA, Guarente L. Molecular biology of aging. Cell. 1999;96:291–302. doi: 10.1016/S0092-8674(00)80567-X. - DOI - PubMed
    1. NIH Consensus Development Panel on Osteoporosis Prevention DD, and Therapy. Osteoporosis prevention, diagnosis, and therapy. JAMA. 2001;285:785–795. doi: 10.1001/jama.285.6.785. - DOI - PubMed
    1. Rachner TD, Khosla S, Hofbauer LC. Osteoporosis: now and the future. Lancet. 2011;377:1276–1287. doi: 10.1016/S0140-6736(10)62349-5. - DOI - PMC - PubMed
    1. Saraswat K, Rizvi SI. Novel strategies for anti-aging drug discovery. Expert Opin. Drug Discov. 2017;12:955–966. doi: 10.1080/17460441.2017.1349750. - DOI - PubMed
    1. Maraka S, Kennel KA. Bisphosphonates for the prevention and treatment of osteoporosis. BMJ. 2015;351:h3783. doi: 10.1136/bmj.h3783. - DOI - PubMed

Publication types

MeSH terms