. 2020 Nov 17;117(46):28980-28991.
doi: 10.1073/pnas.2014470117. Epub 2020 Nov 2.

Essential role of the linear ubiquitin chain assembly complex and TAK1 kinase in A20 mutant Hodgkin lymphoma

Affiliations

Essential role of the linear ubiquitin chain assembly complex and TAK1 kinase in A20 mutant Hodgkin lymphoma

Zhihui Song et al. Proc Natl Acad Sci U S A. .

Abstract

More than 70% of Epstein-Barr virus (EBV)-negative Hodgkin lymphoma (HL) cases display inactivation of TNFAIP3 (A20), a ubiquitin-editing protein that regulates nonproteolytic protein ubiquitination, indicating the significance of protein ubiquitination in HL pathogenesis. However, the precise mechanistic roles of A20 and the ubiquitination system remain largely unknown in this disease. Here, we performed high-throughput CRISPR screening using a ubiquitin regulator-focused single-guide RNA library in HL lines carrying either wild-type or mutant A20. Our CRISPR screening highlights the essential oncogenic role of the linear ubiquitin chain assembly complex (LUBAC) in HL lines, which overlaps with A20 inactivation status. Mechanistically, LUBAC promotes IKK/NF-κB activity and NEMO linear ubiquitination in A20 mutant HL cells, which is required for prosurvival genes and immunosuppressive molecule expression. As a tumor suppressor, A20 directly inhibits IKK activation and HL cell survival via its C-terminal linear-ubiquitin binding ZF7. Clinically, LUBAC activity is consistently elevated in most primary HL cases, and this is correlated with high NF-κB activity and low A20 expression. To further understand the complete mechanism of NF-κB activation in A20 mutant HL, we performed a specifically designed CD83-based NF-κB CRISPR screen which led us to identify TAK1 kinase as a major mediator for NF-κB activation in cells dependent on LUBAC, where the LUBAC-A20 axis regulates TAK1 and IKK complex formation. Finally, TAK1 inhibitor Takinib shows promising activity against HL in vitro and in a xenograft mouse model. Altogether, these findings provide strong support that targeting LUBAC or TAK1 could be attractive therapeutic strategies in A20 mutant HL.

Keywords: Hodgkin lymphoma; NF-kB; signaling transduction; ubiquitination.


Conflict of interest statement

The authors declare no competing interest.

Figures
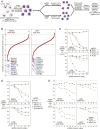
Fig. 1.
Fig. 1.
CRISPR screen identified LUBAC as an essential factor in A20 mutant HL lines. (A) Outline of the workflow of the depletion (loss-of-function) CRISPR library screens in HL cell lines. (B) Overview of the depletion CRISPR screen results. Shown are the ranking of all of the genes (average of 10 sgRNAs for each gene) enriched in the sgRNA on population of both KMH2 and L428 lines. The y axis indicates the distribution of standardized enrichment scores (Z-scores) for each gene enrichment. The green lines indicate P = 0.05. (C) HL lines were transduced with RNF31, PCNA, or control (Ctrl) sgRNAs along with GFP. The fraction of viable GFP+/sgRNA+ cells relative to the live cell fraction is plotted at the indicated times following sgRNA induction, normalized to day 0 values. Error bars denote SEM of triplicates. (D) HL lines were transduced with RBCK1, SHARPIN, or Ctrl sgRNAs along with GFP. The fraction of viable GFP+/sgRNA+ cells relative to the live cell fraction is plotted at the indicated times following sgRNA induction, normalized to day 0 values. Error bars denote SEM of triplicates. (E) HL lines were transduced with RNF31 or Ctrl shRNAs along with GFP. The fraction of viable GFP+/shRNA+ cells relative to the live cell fraction is plotted at the indicated times following shRNA induction, normalized to day 0 values.
Fig. 2.
Fig. 2.
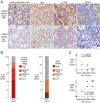
LUBAC activity is frequently elevated in primary HL cases. (A) IHC of linear ubiquitin chain formation, A20, p-p65, and CD30 expression of two HL cases. A section of lymph nodes was examined microscopically using 400× magnification. The depicted images are representative of the seven HL cases examined. HRS cells are indicated by red arrows. (B) Linear ubiquitin chain formation and A20 expression stages of HRS cells in primary HL cases. IHC score: 0 (low), 1+ (medium-low), 2+ (medium-high), 3+ (high). (C) Correlation between linear ubiquitin chain IHC scores with A20 and p-p65 IHC scores in HRS cells, calculated by Spearman's rank correlation method in seven cases.
Fig. 3.
Fig. 3.
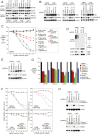
LUBAC is required for NF-κB activation and NEMO linear ubiquitination in A20 mutant HL cell lines. (A) Indicated HL lines were transduced with RNF31 or Ctrl sgRNAs and selected, and expression was induced. Nuclear and cytosol fractions were analyzed by immunoblotting for the indicated proteins. (B) Indicated HL lines were transduced with RNF31, RBCK1, SHARPIN, or Ctrl sgRNAs and selected, and expression was induced. Lysates were analyzed by immunoblotting for the indicated proteins. (C) HL cell line KMH2 was stable engineered with IKKβ WT, IKKβ S176/180E, or empty control and then transduced with RNF31 or Ctrl sgRNAs along with GFP. The fraction of viable GFP+/sgRNA+ cells relative to the live cell fraction is plotted at the indicated times following sgRNA induction, normalized to day 0 values. Error bars denote SEM of triplicates. (D) SDS (1%) lysates prepared from the KMH2 line transduced with RNF31 or control sgRNAs, diluted and subjected to anti-NEMO immunoprecipitation (IP). IPs or total lysates were analyzed by immunoblotting. (E) Indicated HL lines were transduced with NEMO or Ctrl sgRNAs and selected, and expression was induced. Lysates were analyzed by immunoblotting for the indicated proteins. (F) HL lines were transduced with NEMO or Ctrl sgRNAs along with GFP (Left). The fraction of viable GFP+/sgRNA+ cells relative to the live cell fraction is plotted at the indicated times following sgRNA induction and normalized to day 0 values. Error bars denote SEM of triplicates. Similar experiments were performed using NEMO or Ctrl shRNAs along with GFP (Right). (G) HL line KMH2 was transduced with Ctrl, RNF31, or NEMO sgRNAs and selected, and expression was induced, or treated with IKKβ inhibitor MLN120B (20 μM) for 24 h. Indicated genes expression were measured by real-time PCR. Error bars denote SEM of triplicates. (H) Indicated HL lines were transduced with Ctrl, RNF31, or NEMO sgRNAs and selected, and expression was induced. Lysates were analyzed by immunoblotting for the indicated proteins.
Fig. 4.
Fig. 4.
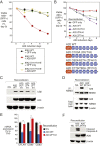
A20 ZF7 directly inhibits IKK activation and HL cell survival. (A) HL cell line KMH2 was stable engineered with IKKβ WT or IKKβ S176/180E and then transduced with inducible retroviral constructs encoding A20 WT cDNA or empty control along with GFP. The fraction of viable GFP+/A20+ cells relative to the live cell fraction is plotted at the indicated times following cDNA induction, normalized to day 0 values. Error bars denote SEM of triplicates. (B) HL cell line KMH2 was transduced with inducible retroviral constructs encoding A20 WT, OUTmt, ZF4mt, and ZF7mt cDNAs or empty control along with GFP. The fraction of viable GFP+/A20+ cells relative to the live cell fraction is plotted at the indicated times following cDNA induction, normalized to day 0 values. Error bars denote SD of triplicates. (Bottom) Schematic of A20 WT, OUTmt, ZF4mt, and ZF7mt made in this study. (C) HL cell line KMH2 was transduced with inducible lentiviral constructs encoding A20 WT, OUTmt, ZF4mt, and ZF7mt cDNAs or empty control and selected, and A20 expression was induced. Lysates were analyzed by immunoblotting for the indicated proteins. (D) HL cell line KMH2 was transduced with inducible lentiviral constructs encoding A20 WT, ZF7mt cDNAs, or empty control and selected, and A20 expression was induced. NEMO IPs or total lysates from these reconstitution lines were immunoblotted for the indicated proteins. (E) HL cell line KMH2 was transduced with inducible lentiviral constructs encoding A20 WT, ZF7mt cDNAs, or empty control and selected, and A20 expression was induced. Indicated gene expressions were measured by real-time PCR. P values were calculated comparing A20 WT and mutant reconstitution groups; **P < 0.01. Error bars denote SEM of triplicates. (F) HL cell line KMH2 was transduced with inducible lentiviral constructs encoding A20 WT, ZF7mt cDNAs, or empty control, selected, and A20 expression was induced. Lysates were analyzed by immunoblotting for the indicated proteins.
Fig. 5.
Fig. 5.
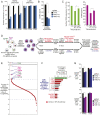
CD83-based CRISPR screen in A20 mutant HL line. (A) Indicated HL lines were transduced with RNF31 or Ctrl sgRNAs along with GFP. Surface CD83, CD54, and CD80 expression in transduced (GFP+) cells and sgRNA untransduced (GFP−) cells was measured by flow cytometry. The relative mean fluorescence intensity (MFI) was normalized to the untransduced (GFP−) cells. Error bars denote SEM of triplicates. **P < 0.01. (B) KMH2 line was transduced with RNF31 or Ctrl sgRNAs and selected, and expression was induced. Concentration of soluble CD83 (sCD83) in the supernatant of KMH2 sgRNA transduced lines was measured by enzyme-linked immunosorbent assay (ELISA). (C) KMH2 line was transduced with inducible lentiviral constructs encoding A20 WT, ZF7mt cDNAs, or empty control and selected, and A20 expression was induced. Surface CD83 expression (Left) and soluble CD83 concentration in the supernatant (Right) were measured by flow cytometry or ELISA. (D) Outline of the workflow of the CD83 CRISPR library screen in A20 mutant HL line KMH2. (E) The ranking of all of the genes (average of 10 sgRNAs of each gene) enriched in the CD83low population of KMH2 line. The y axis indicates the distribution of standardized enrichment scores (Z-scores) of each gene enrichment. The dashed lines indicate P = 0.05. (F) List of top genes enriched in the CD83low population of KMH2 line, measured by log2(CD83low/unsorted). Error bars denote SEM of all of the sgRNAs for this gene. Red: genes in NF-κB pathway. (G) Indicated HL lines were transduced with TAB1, TAB2, or Ctrl sgRNAs along with GFP. Surface CD83 expression in transduced (GFP+) cells and sgRNA untransduced (GFP–) cells was measured by flow cytometry. The relative CD83 MFI was normalized to the untransduced (GFP−) cells. Error bars denote SEM of triplicates. **P < 0.01.
Fig. 6.
Fig. 6.
TAK1 is required for NF-κB activation in A20 mutant HL cells. (A) Indicated HL lines were transduced with TAK1 or Ctrl sgRNAs along with GFP. The fraction of viable GFP+/sgRNA+ cells relative to the live cell fraction is plotted at the indicated times following sgRNA induction and normalized to day 0 values. Error bars denote SEM of triplicates. (B) Indicated HL lines were transduced with TAK1 or Ctrl sgRNAs and selected, and expression was induced. Lysates were analyzed by immunoblotting for the indicated proteins. (C) Indicated HL lines were transduced with TAK1 or Ctrl sgRNAs along with GFP. Surface CD83 and CD80 expression in transduced (GFP+) cells and sgRNA untransduced (GFP−) cells was measured by flow cytometry. The relative CD83 and CD80 MFI were normalized to the untransduced (GFP−) cells. Error bars denote SEM of triplicates. **P < 0.01. (D) Indicated HL lines were transduced with TAK1 or Ctrl sgRNAs and selected, and expression was induced. Lysates were analyzed by immunoblotting for the indicated proteins. (E) HL cell line KMH2 was transduced with RNF31 or Ctrl sgRNAs and selected, and expression was induced. NEMO IPs or total lysates from these sgRNA transduced lines were immunoblotted for the indicated proteins. (F) HL cell line KMH2 was transduced with inducible lentiviral constructs encoding A20 WT, ZF7mt cDNAs, or empty control and selected, and A20 expression was induced. NEMO IPs or total lysates from these reconstitution lines were immunoblotted for the indicated proteins.
Fig. 7.
Fig. 7.
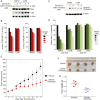
Targeting TAK1 in HL cell lines and xenograft mice model. (A) Indicated HL lines were treated with Takinib at the indicated concentrations for 24 h. Lysates were analyzed by immunoblotting for the indicated proteins. (B) Indicated HL lines were treated with Takinib at the indicated concentrations for 24 h. Surface CD83 and CD80 expression was measured by flow cytometry and normalized to dimethylsulfoxide (DMSO) controls. Error bars denote SEM of triplicates. (C) Indicated HL lines were treated with Takinib at the indicated concentrations for 24 h. Lysates were analyzed by immunoblotting for the indicated proteins. (D) Indicated HL lines were treated with Takinib at the indicated concentrations for 4 d. Viability was measured by an MTS assay and normalized to DMSO-treated cells. Error bars denote SEM of triplicates. (E) NSG mice bearing KMH2 xenografts were treated with Takinib (50 mg/kg daily, n = 4) or vehicle controls (n = 4). Tumor growth was measured as a function of tumor volume. Error bars denote SEM. **P < 0.01. (F and G) Tumor size (F) and weight (G) in Takinib and vehicle treatment groups at the treatment end point.

Similar articles

Cited by

References

    1. Bräuninger A., et al. , Molecular biology of Hodgkin’s and Reed/Sternberg cells in Hodgkin’s lymphoma. Int. J. Cancer 118, 1853–1861 (2006). - PubMed
    1. Canellos G. P., et al. , Chemotherapy of advanced Hodgkin’s disease with MOPP, ABVD, or MOPP alternating with ABVD. N. Engl. J. Med. 327, 1478–1484 (1992). - PubMed
    1. Santoro A., et al. , Long-term results of combined chemotherapy-radiotherapy approach in Hodgkin’s disease: Superiority of ABVD plus radiotherapy versus MOPP plus radiotherapy. J. Clin. Oncol. 5, 27–37 (1987). - PubMed
    1. Vardhana S., Younes A., The immune microenvironment in Hodgkin lymphoma: T cells, B cells, and immune checkpoints. Haematologica 101, 794–802 (2016). - PMC - PubMed
    1. Weniger M. A., Küppers R., NF-κB deregulation in Hodgkin lymphoma. Semin. Cancer Biol. 39, 32–39 (2016). - PubMed

Publication types

MeSH terms

Substances