. 2020 Oct 29;10(1):18545.
doi: 10.1038/s41598-020-75584-7.

Fibroblast growth factor 2 accelerates the epithelial-mesenchymal transition in keratinocytes during wound healing process

Affiliations

Fibroblast growth factor 2 accelerates the epithelial-mesenchymal transition in keratinocytes during wound healing process

Yuta Koike et al. Sci Rep. .

Abstract

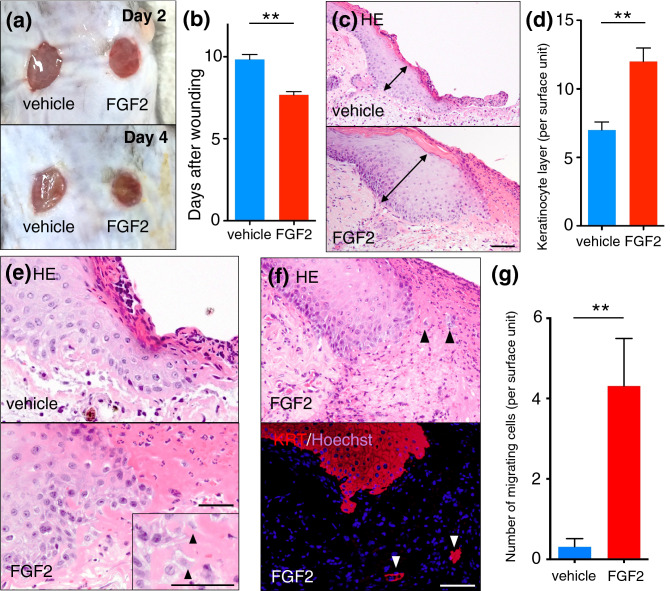
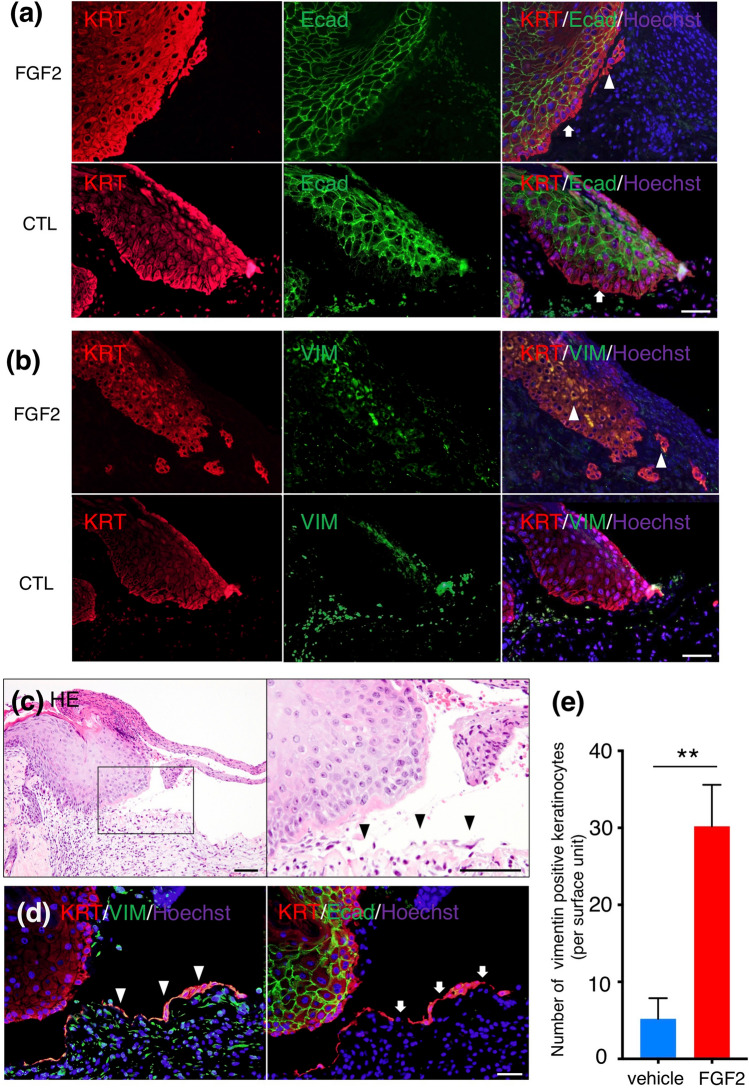
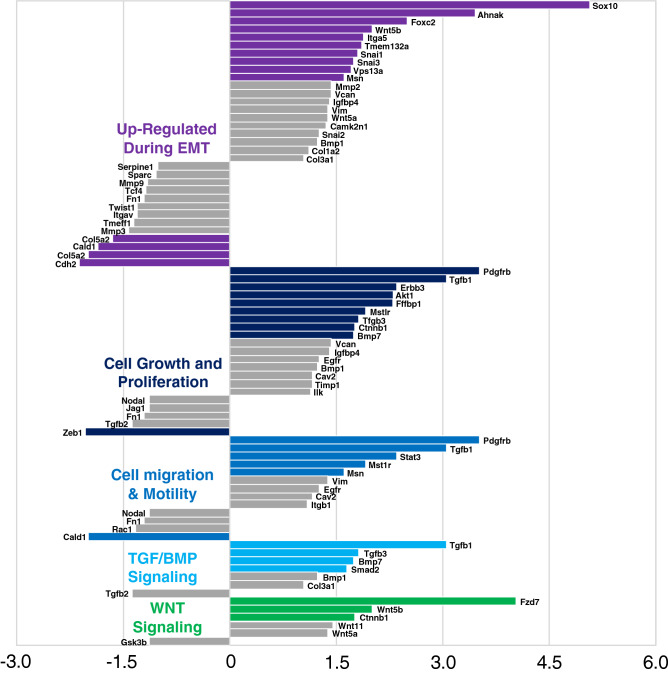
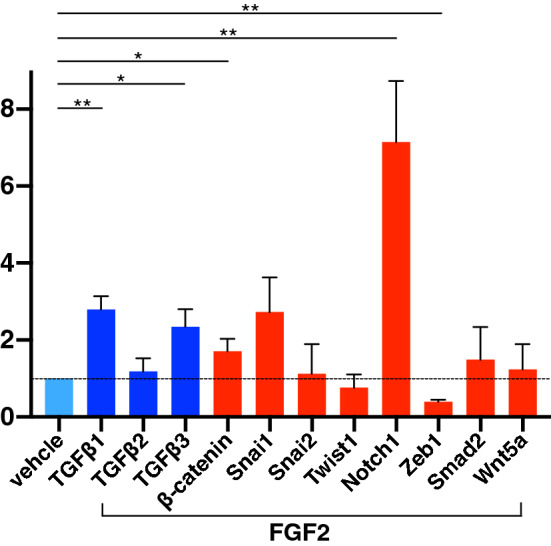
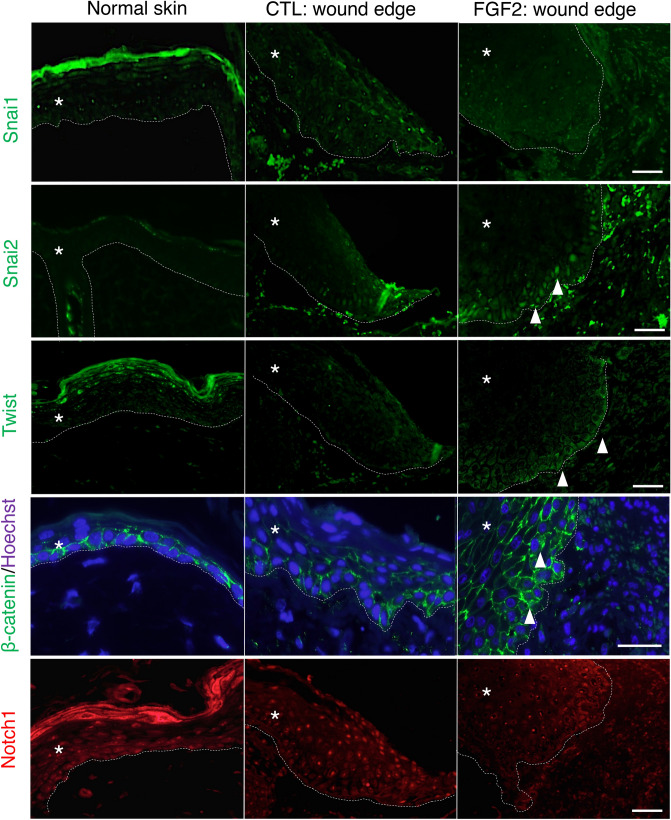
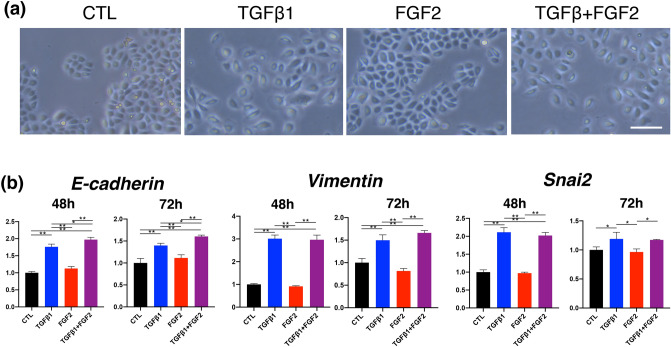
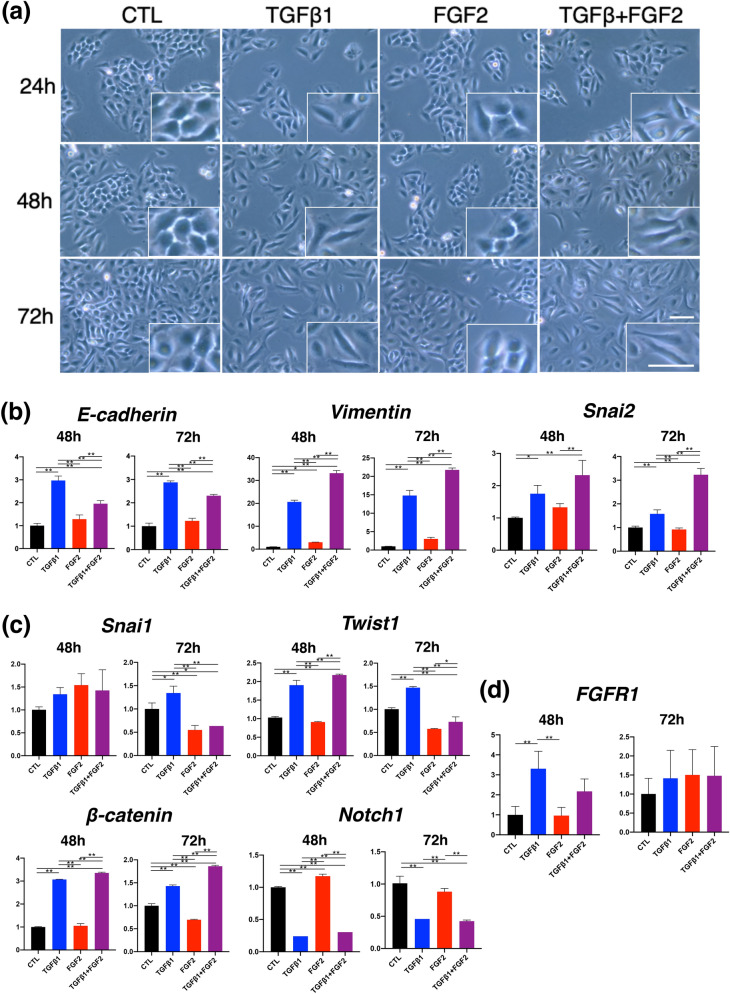
In the wound healing process, the morphology of keratinocytes at the wound edge temporarily changes to a spindle morphology, which is thought to occur due to an epithelial-mesenchymal transition (EMT). Fibroblast growth factor (FGF) 2, also called basic FGF, has the potential to accelerate wound closure by activating vascular endothelial cells and fibroblasts. We examined the effects of FGF2 on keratinocyte morphology and EMT in wounded skin. Histological examination of murine wounds treated with FGF2 revealed that wound edge keratinocytes formed thickened and multilayered epithelia. In addition, we detected wound edge keratinocytes migrating individually toward the wound center. These migrating keratinocytes exhibited not only spindle morphology but also down-regulated E-cadherin and up-regulated vimentin expression, which is characteristic of EMT. In FGF2-treated wounds, a PCR array revealed the upregulation of genes related to EMT, including transforming growth factor (TGF) signaling. Further, FGF2-treated wound edge keratinocytes expressed EMT-associated transcription factors, including Snai2, and showed translocation of β-catenin from the cell membrane to the cytoplasm/nucleus. However, in vitro examination of keratinocytes revealed that FGF2 alone did not activate EMT in keratinocytes, but that FGF2 might promote EMT in combination with TGFβ1. These findings suggest that FGF2 treatment of wounds could promote keratinocyte EMT, accelerating wound closure.


Conflict of interest statement

The authors declare no competing interests.

Figures

Figure 1
Figure 1
FGF2 accelerated wound healing, epidermal hypertrophy and keratinocytes migration at wound edge. (a) Murine wounds were created on the dorsal skin using 6 mm punch, and FGF2-treated wounds were significantly smaller on day 4. (b) Days required for wound closure were significantly decreased by FGF2 treatment. (c,d) FGF2-treated wounds demonstrated a more thickened epidermis (double arrow) than vehicle-treated wounds. Scale bar: 40 μm. (e) At the wound edge, spindle-shaped keratinocytes (arrow heads) were observed in FGF2-treated wounds (higher magnification images at the corner). Scale bar: 20 μm. (f) Cells migrating in fibrin clots (arrow heads) were confirmed to be keratinocytes by immunofluorescent staining with anti-pan keratin antibody. Scale bar: 40 μm. (g) The number of migrating keratinocytes was significantly higher in FGF2-treated wounds than in control wounds. Bar graphs are presented with the mean values ± standard error. FGF2: fibroblast growth factor 2, HE: hematoxylin and eosin staining. **p < 0.01, Mann–Whitney U test.
Figure 2
Figure 2
Immunofluorescent staining of wound edges treated with FGF2 or vehicle (control: CTL) after 4 days. (a) Cell membrane expression of E-cadherin was reduced in wound edge keratinocytes (arrows) in both FGF2 treated and CTL groups, as well as in keratinocytes away from wound edges in FGF treated group (arrowheads). Scale bar: 20 μm. (b) Keratinocytes at the wound edge and during migration in the fibrin clot co-expressed cytokeratin and vimentin (arrowheads) in FGF2 treated group. Scale bar: 20 μm. (c) Among HE sections of FGF2-treated wounds, spindle-shaped monolayer keratinocytes (arrowheads) were detected on granulation tissue Scale bar: 40 μm (d) and showed were strongly positive for vimentin as well as cytokeratin (arrowheads). In addition, cell membrane E-cadherin was nearly undetectable (arrows). Scale bar: 20 μm (e) The number of vimentin-positive wound edge and migrating keratinocytes at the FGF2 treated condition was significantly more than vehicle-treated wounds. Bar graph is presented with the mean values ± standard error. KRT: pan-keratin, Ecad: E-cadherin, VIM: vimentin. **p < 0.01, Mann–Whitney U test.
Figure 3
Figure 3
Tissue PCR array analysis about EMT associated components in murine wounds. Eighty-four EMT associated components were examined in RNA extracted from whole wounds at day 4 treated with vehicle or FGF2 (n = 3/group). Genes were categorized into five groups, including genes typically upregulated during EMT, cell growth and proliferation genes, cell migration and motility genes, genes related to TGF/bone morphogenetic protein (BMP) signaling, and genes related to Wnt signaling. Genes indicated with colored bars were up or down-regulated > 1.5 fold change.
Figure 4
Figure 4
Representative EMT-associated upregulated genes in PCR array analysis. Individual genes of the FGF2 group were normalized by the same gene of vehicle group respectively. TGFβ1 (2.79 fold: p < 0.01), TGFβ2 (1.18 fold), TGFβ3 (2.34 fold: p < 0.05), β-catenin (1.70 fold: p < 0.05) and Notch1 (7.14 fold: p < 0.01) were up-regulated and Zeb1 (0.39 fold: p < 0.01) was down-regulated significantly in comparison with vehicle-treated samples. Bar graph is presented with the mean values ± standard error. *p < 0.05, **p < 0.01, Mann–Whitney U test.
Figure 5
Figure 5
Immunofluorescent staining for EMT associated transcriptional factors was performed on non-injured skin (normal skin) and wound edges treated with vehicle (CTL) and FGF2 4 days after wounding. Snai1 was absent in all normal skin, CTL wounds, and FGF2-treated wounds. Snai2 was robustly expressed in wound edge keratinocytes in FGF2-treated wounds (arrowheads) and faintly expressed in those in control wounds. Twist was expressed in FGF2-treated wounds (arrowheads). β-catenin translocated from the cell membrane to the cytoplasm or nuclei (arrowheads) in the wound tissues, especially in the FGF2-treated group. Notch1 did not differ among samples. Scale bar: 40 μm, *shows epidermis.
Figure 6
Figure 6
In vitro experiment using normal human epidermal keratinocytes (NHEKs) to compare among normal culture condition (CTL), TGFβ1 solo-stimulation, FGF2 solo-stimulation, and TGFβ1 and FGF2 co-stimulation (TGFβ1 + FGF2). (a) After 48 h of stimulation, NHEKs with TGFβ1 and TGFβ1 + FGF2 showed disseminated proliferation in contrast to the cobblestone pattern of those with normal medium and FGF2 treated condition. Scale bar: 20 μm (b) realtime RT-PCR analysis of NHEKs. The Y-axis represents the relative ratio normalized by CTL. mRNA expressions of E-cadherin, vimentin, and Snai2 at 48 and 72 h stimulation were highly and significantly upregulated in TGFβ1 and TGFβ1/FGF2. Solo treatment with FGF2 affected little in expressions of EMT-related transcription factors in NHEKs. Bar graphs are presented with the mean values ± standard error. *p < 0.05, **p < 0.01, ANOVA with a post hoc Tukey examination.
Figure 7
Figure 7
In vitro experiment using HaCaT cells to compare among normal culture condition, TGFβ1 solo-stimulation, FGF2 solo-stimulation, and TGFβ1 and FGF2 co-stimulation (TGFβ1 + FGF2). (a) HaCaT cells gradually showed not only the disseminated pattern but also spindle morphology with TGFβ1 and TGFβ1 + FGF2 treatment in the time course of cell culture from 24 to 72 h. Higher magnification images are at the corners. Scale bar: 20 μm (b) Realtime RT-PCR analysis of HaCaT cells. The Y-axis represents the relative ratio compared with CTL. mRNA expression of E-cadherin, vimentin and Snai2 was highly and significantly upregulated in TGFβ1. Vimentin and Snai2 were further upregulated by TGFβ1 + FGF2 co-treatment than TGFβ1 solo treatment especially at the time point of 72 h. (c) mRNA expression of Snai1 increased with TGFβ1 but suppressed with FGF2 and TGFβ1 + FGF2 at 72 h. Twist1 was increased with TGFβ1 at 48 and 72 h, and TGFβ1 + FGF2 at 48 h. β-catenin was similarly upregulated by TGFβ1 and TGFβ1 + FGF2 treatment at both time points. Notch1 was significantly suppressed by TGFβ1 and TGFβ1 + FGF2 treatment. Solo treatment with FGF2 affected little in expressions of EMT-related transcription factors in HaCaT cells. (d) Transcription of FGFR1 in HaCaT cells showed a significant increase with TGFβ1 in comparison with control and FGF2 treatment at 48 h. Bar graphs are presented with the mean values ± standard error. *p < 0.05, **p < 0.01, ANOVA with a post hoc Tukey examination.

Similar articles

Cited by

References

    1. Singer AJ, Clark RA. Cutaneous wound healing. N. Engl. J. Med. 1999;341:738–746. doi: 10.1056/NEJM199909023411006. - DOI - PubMed
    1. Gurtner GC, Werner S, Barrandon Y, Longaker MT. Wound repair and regeneration. Nature. 2008;453:314–321. doi: 10.1038/nature07039. - DOI - PubMed
    1. Martin P. Wound healing–aiming for perfect skin regeneration. Science. 1997;276:75–81. doi: 10.1126/science.276.5309.75. - DOI - PubMed
    1. Grinnell F. Wound repair, keratinocyte activation and integrin modulation. J. Cell Sci. 1992;101(Pt 1):1–5. - PubMed
    1. Coulombe PA. Towards a molecular definition of keratinocyte activation after acute injury to stratified epithelia. Biochem. Biophys. Res. Commun. 1997;236:231–238. doi: 10.1006/bbrc.1997.6945. - DOI - PubMed

Publication types

MeSH terms

Substances