. 2020 Oct 29;11(1):5463.
doi: 10.1038/s41467-020-19075-3.

Combating acquired resistance to MAPK inhibitors in melanoma by targeting Abl1/2-mediated reactivation of MEK/ERK/MYC signaling

Affiliations

Combating acquired resistance to MAPK inhibitors in melanoma by targeting Abl1/2-mediated reactivation of MEK/ERK/MYC signaling

Rakshamani Tripathi et al. Nat Commun. .

Abstract

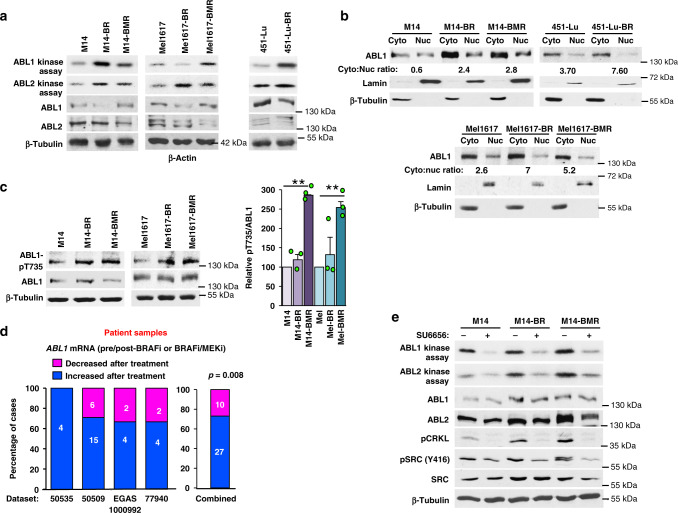
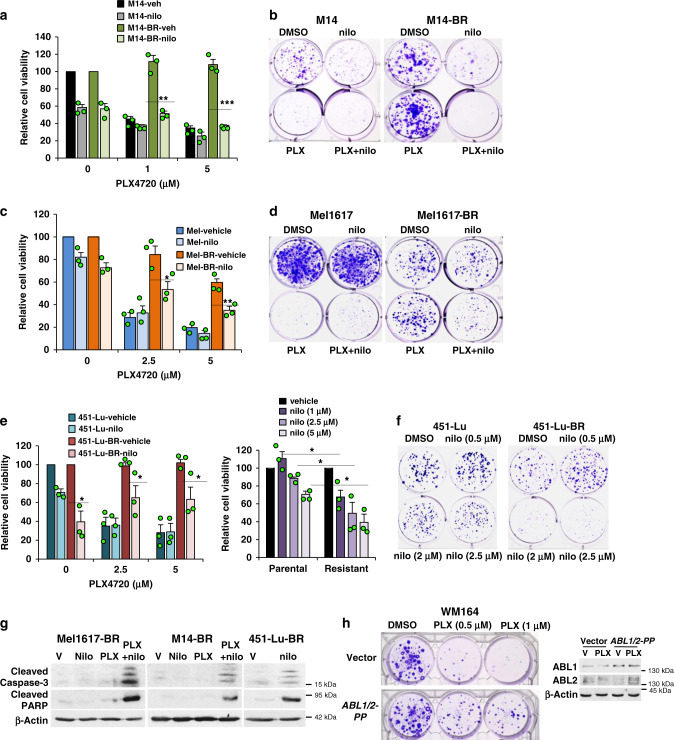
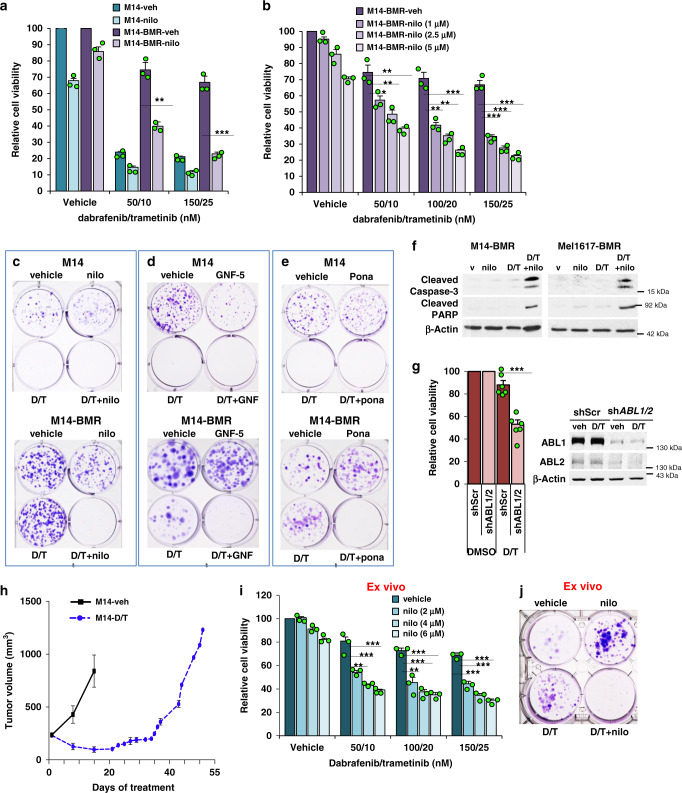
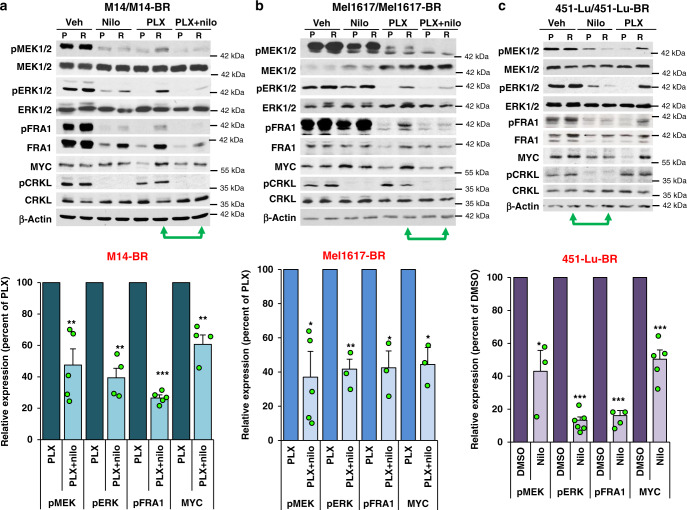
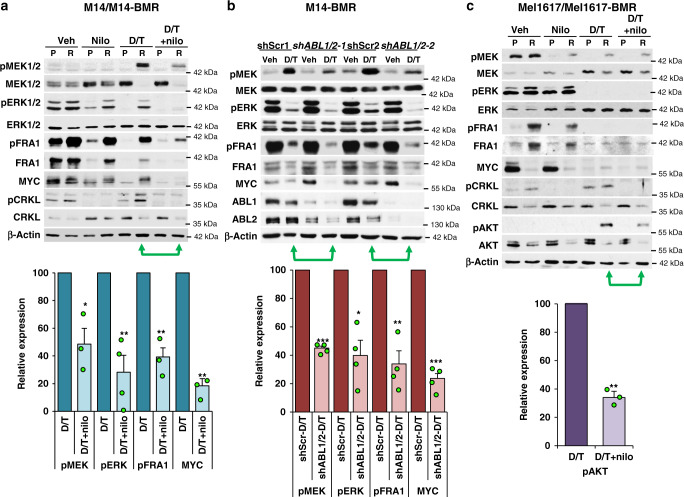
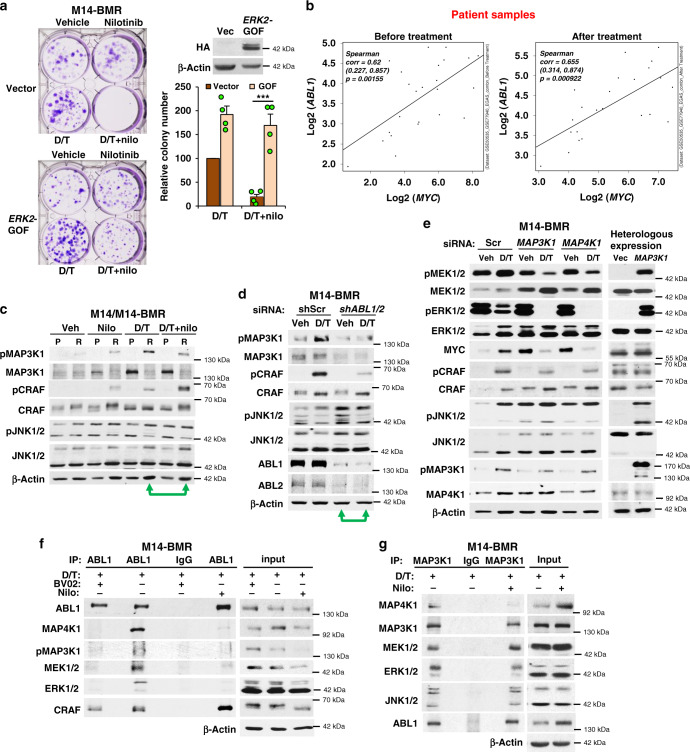
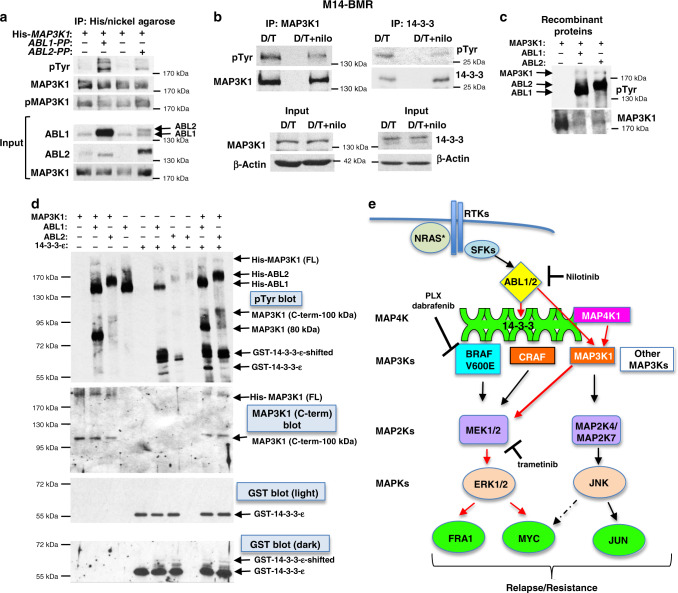
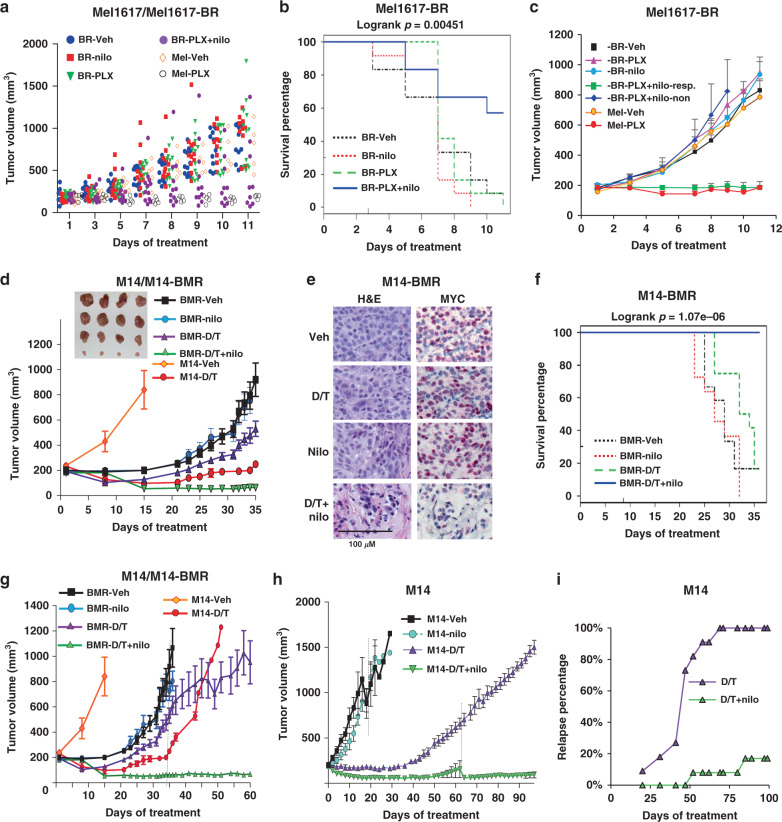
Metastatic melanoma remains an incurable disease for many patients due to the limited success of targeted and immunotherapies. BRAF and MEK inhibitors reduce metastatic burden for patients with melanomas harboring BRAF mutations; however, most eventually relapse due to acquired resistance. Here, we demonstrate that ABL1/2 kinase activities and/or expression are potentiated in cell lines and patient samples following resistance, and ABL1/2 drive BRAF and BRAF/MEK inhibitor resistance by inducing reactivation of MEK/ERK/MYC signaling. Silencing/inhibiting ABL1/2 blocks pathway reactivation, and resensitizes resistant cells to BRAF/MEK inhibitors, whereas expression of constitutively active ABL1/2 is sufficient to promote resistance. Significantly, nilotinib (2nd generation ABL1/2 inhibitor) reverses resistance, in vivo, causing prolonged regression of resistant tumors, and also, prevents BRAFi/MEKi resistance from developing in the first place. These data indicate that repurposing the FDA-approved leukemia drug, nilotinib, may be effective for prolonging survival for patients harboring BRAF-mutant melanomas.


Conflict of interest statement

This research is/was funded by the following grants to R.P.: National Institute of Health (NCI): R01 CA211137 and R01 CA166499; Lloyd Charitable Trust; University of Kentucky Markey Foundation Women’s Strong Award; and Cancer Center Support Grant Pilot Award (5P30CA177558). M.N. and A.R. are employees of Plexxikon Inc.; all other authors declare no competing interests.

Figures

Fig. 1
Fig. 1. ABL kinase activities are potentiated following resistance to BRAF and BRAF/MEK inhibitors.
a Parental (M14, Mel1617, 451-Lu), BRAFi (-BR), or BRAFi/MEKi-resistant (-BMR) cell lines were serum-starved and subjected to in vitro kinase assay (top two panels) or western blot (rest of the panels) for total protein expression. For kinase assays, ABL1 was immunoprecipitated with K12 antibody, whereas ABL2 was immunoprecipitated with ABL2-specific antibody,, and IPs incubated with substrate (GST-CRK) and radiolabeled (gamma-32P)-ATP (see “Methods”). Kinase quantitation for n = 3–5 biological replicates is shown in Supplementary Fig. 1d. b Resistant cell lines (a) were fractionated into nuclear (nuc) and cytoplasmic (cyto) fractions, equal percentages of cytoplasmic/nuclear fractions loaded for each line, and fractions blotted with the indicated antibodies. Lamin and tubulin blots were used to demonstrate the purity of nuclear and cytoplasmic fractions, respectively. ABL1 cytoplasmic:nuclear ratio is noted for each cell line, and quantitation for all lines is shown in Supplementary Fig. 1e. A representative of n = 2 independent experiments is shown. c Lysates from a were blotted with the indicated antibodies and quantified. Graph shown is mean ± SEM for three independent experiments. **p = 0.006 using single sample t-tests (two-sided) and Holm’s adjustment for multiple comparisons. d Primary human paired melanoma datasets (RNAseq-77940, 50535, 65185, EGAS00001000992; microarray-50509) were analyzed for ABL1 mRNA levels pre-/post-BRAFi, MEKi, or BRAFi/MEKi treatment. Numbers in each column indicate number of cases. All cases were included; repeated analyses using particular cut-off values are shown in Supplementary Fig. 1f). p = 0.008 for the combined set using a two-sided binomial (right). e Parental and resistant cells were serum-starved, treated with vehicle (DMSO) or SFK inhibitor, SU6656 (10 μM), for 16 h and lysates were subjected to in vitro kinase assay (top two panels) and western blot (all other panels) as in a.
Fig. 2
Fig. 2. ABL1/2 inhibition reverses resistance to BRAF inhibitors.
a, c, e Viability (CellTiter Glo) assays for cells treated with vehicle (veh) or nilotinib (nilo) alone (e (right)) in the absence/presence of BRAFi, PLX4720 (doses shown) for 72 h (a, c, e (left)). Nilotinib doses: a 5 or 6 μM; c, e 5 μM. Results are mean ± SEM for three independent experiments performed in triplicate. Additional drug doses are shown in Supplementary Fig. 2a, b. *p < 0.05, **p ≤ 0.01, ***p < 0.001 using two-sample t-tests (two sided). Actual p values (left→right): a 0.0029, 0.00016; c 0.039, 0.0068; e (left) 0.016, 0.043, 0.015; e (right) 0.019, 0.035, 0.035. b, d, f Colony assays. Cells were treated with nilotinib (b 4 μM, d 3 μM; f doses shown) and/or PLX4720 (2.5 μM) for 7 days, wells washed, plates incubated additional days without drugs (451-Lu/M14-5d; Mel1617-6d) until colonies were well visualized, at which time they were stained with crystal violet. g Cells were treated with the indicated drugs for 96 h and detached and attached cells lysed and subjected to western blotting. Nilotinib: Mel1617-BR, 4 μM; M14-BR, 451-Lu-BR, 5 μM. PLX: Mel1617-BR, 4 μM, M14-BR, 3 μM. Representative blots from n = 2 independent experiments are shown. V = vehicle. h Low-invasive WM164 cells, which lack endogenous activated ABL1/2 and harbor BRAF-V600E, were engineered to stably express constitutively active forms of ABL1 and ABL2 (PP) or vectors. Cells were plated, treated with vehicle or the BRAFi, PLX4720, for 7 days, wells washed, incubated with media without drug for 9 days, stained with crystal violet, and colonies manually counted. Levels of ABL1/2 proteins are shown on the right. Cells were maintained in the presence of PLX but removed from drug two days prior to plating for experiments. Colony assay shown is representative of n = 4 (0.5 μM) or n = 2 (1 μM) independent experiments (see Supplementary Fig. 2h). V = vehicle = DMSO.
Fig. 3
Fig. 3. Blocking ABL1/2 activity reverses resistance to BRAF + MEK inhibitors.
a, b CellTiter Glo viability assays using parental and BRAF/MEK-inhibitor resistant M14 cells treated with nilotinib (nilo; 2.5 μM) in the absence/presence of BRAFi/MEKi (dabrafenib/trametinib; D/T) for 72 h. Results are mean ± SEM for three independent experiments performed in triplicate. Actual p values left→right: a 0.0015, <0.0001 using two-sided, two-sample t-tests; b 50/10: 0.031, 0.008, 0.0018; 100/20: 0.0022, 0.0085, 0.00031; 150/25: 0.00037, 0.00018, <0.0001 using two-sample t-tests (two sided). ce Colony assays. Cells were treated with vehicle, D/T (100 nM/20 nM) in the absence or presence of nilotinib (2.5 μM), GNF-5 (GNF; 10 μM), or ponatinib (pona; 100 nM) for 7 days, washed, and incubated in the absence of drugs for an additional 6 days (c, e) or treated for 13 days (d). f Cells were treated with nilotinib (M14-BMR-5 μM; Mel1617-BMR-4 μM) in the absence or presence of D/T (150 nM/25 nM) for 96 h, and detached and attached cells lysed and subjected to western blotting. Representative blots from n = 2 independent experiments are shown. V = vehicle. g M14-BMR cells expressing scrambled (shScr) or IPTG-inducible shRNA targeting ABL1 and ABL2 (shABL1/2) were treated with IPTG (1 mM) for 5 days prior to plating, treated with vehicle or D/T (150 nM/25 nM) for 72 h, and cell viability assessed with CellTiter Glo. Results are mean ± SEM for two vector and two shRNA clones and three independent experiments for each, expressed as a percentage of vehicle (DMSO). ***p = 7.5e−5 using a two-sample t-test (two sided). Veh = vehicle. Knockdown efficiency (western blots) is shown on the right. h M14 BRAFi/MEKi in vivo-resistant cells were obtained by treating mice containing M14 xenografts (200 mm3) with vehicle or D/T and establishing a cell line from resistant tumor tissue on day 49. Graph is mean ± SEM, n = 5 mice/group. i, j The established line from h was incubated with nilotinib (2.5 μM if doses are not indicated) in the absence/presence of D/T (100 nM/20 nM, if not indicated), and viability assessed with CellTiter Glo assay (mean ± SEM for n = 3 independent experiments performed in triplicate, i); and colony formation assessed as above (growth/treatment for 17days; j) *p < 0.05, **p ≤ 0.01. ***p < 0.001 using two-sided, one-sample t-tests. Actual p values (left→right): 0.0023, 0.00097, 0.0003, 0.0057, 0.00026, 0.00019, 0.00012, 0.00019, and <0.0001. For all experiments, BRAFi/MEKi-resistant lines were maintained in D/T (100 nM/20 nM) but were cultured for 2 days without D/T prior to plating for experiments.
Fig. 4
Fig. 4. Nilotinib blocks reactivation of ERK signaling in BRAFi-resistant cells.
BRAFi (-BR; R) or parental (P) cells were treated with vehicle, nilotinib (nilo; 2.5 μM), PLX4720 (M14 and 451-Lu 1 μM; Mel1617 2.5 μM) or the combination for 24 h, and the resulting lysates probed with the indicated antibodies. Quantitation of key signaling molecules for n = 3–5 independent experiments is shown below blots; green arrows indicate lanes quantified. Mean ± SEM is shown. M14-BR: pMEK n = 5, pERK n = 4, pFRA1 n = 5, MYC n = 4. Mel1617-BR: pMEK n = 5, pERK n = 3, pFRA1 n = 3, MYC n  = 3. 451-Lu-BR: pMEK n = 3, pERK n = 6, pFRA1 n = 4, MYC n = 5. For M14 and Mel1617 cell lines, data are a comparison between PLX + nilotinib vs. PLX lanes, whereas for 451-Lu cell lines, nilotinib alone is compared to vehicle (DMSO). *p < 0.05, **p ≤ 0.01, ***p < 0.001 using one-sample t-tests (two-sided). Actual p values (left→right): a 0.0069, 0.002, <0.0001, and 0.0072. b 0.026, 0.0097, 0.029, and 0.011. c 0.046, <0.0001, 0.00011, and 0.0001. pCRKL (substrate of ABL1/2) is an indirect read-out of ABL1/2 activity and indicates the efficiency of nilotinib-mediated inhibition. For all experiments, BRAFi-resistant lines were maintained in PLX (1 μM), but were cultured for 2 days without PLX prior to plating for experiments.
Fig. 5
Fig. 5. Nilotinib prevents reactivation of ERK-dependent (or ERK-independent) signaling during BRAFi/MEKi resistance.
a, c Parental or BRAFi/MEKi-resistant cells (-BMR) were treated with vehicle, nilotinib (nilo; 2.5 μM), dabrafenib/trametinib (D/T; BRAFi/MEKi; 50/10 nM) or the combination for 24 h, and the resulting lysates probed with the indicated antibodies. Quantitation of key signaling molecules for n = 3 independent experiments (except pERK, n = 4) is shown below; green arrows indicate lanes quantitated. Mean ± SEM *p < 0.05, **p ≤ 0.01, ***p < 0.001 using two-sided, one-sample t-tests. Actual p values (left→right): a 0.045, 0.0099, 0.0033, and 0.004. c **p = 0.0045. b M14-BMR cells expressing either vector (shScr) or IPTG-inducible shRNA targeting ABL1 and ABL2 (shABL1/2; two independent clones are shown) were treated with IPTG (1 mM) for 10 days prior to plating to induce expression, treated with DMSO (vehicle) or D/T (100 nM/20 nM) for 24 h, and lysates blotted with the indicated antibodies. n = 4 biological replicates (using two vector and two shRNA clones). **p ≤ 0.01, ***p < 0.001 using two-sided, one-sample t-tests. Actual p values (left→right): <0.0001, 0.011, 0.0056, and 0.000191. pCRKL (substrate of ABL1/2) is an indirect read-out of ABL1/2 activity and indicates the efficiency of nilotinib-mediated inhibition. For all experiments, BRAFi/MEKi-resistant lines were maintained in dabrafenib (100 nM) and trametinib (20 nM), but were cultured for 2 days without BRAFi/MEKi prior to plating for experiments.
Fig. 6
Fig. 6. ABL1/2 drive ERK reactivation during resistance by promoting MAP3K activation.
a M14-BMR cells were engineered to express vector or HA-tagged constitutively active ERK2 (GOF). ERK2-GOF expression is shown on the upper right. Vector or ERK2-GOF-expressing cells were plated, treated with D/T (50 nM/10 nM) in the absence or presence of nilotinib (nilo; 2.5 μM) for 7 days, wells washed, cells incubated in media lacking drugs for an additional 9 days, and stained with crystal violet. Quantitation of mean ± SEM for n = 4 independent experiments is shown on the right. ***p = 0.00084, two-sample t-test (two-sided). b Primary human paired melanoma datasets (RNAseq-77940, 50535, 65185, EGAS00001000992; microarray-50509) were analyzed for ABL1 and MYC mRNA levels pre-/post-BRAFi, MEKi or BRAFi/MEKi treatment. Spearman’s correlation coefficients were used to quantify correlations. Correlation (r), 95% confidence limits (in parentheses), and p values are shown. c M14-BMR or parental M14 cells were treated with the indicated drugs as in Fig. 5 for 24 h, and lysates blotted with antibodies. A representative experiment from n = 3 independent experiments is shown. Veh = vehicle. d M14-BMR cells expressing either vector (vec) or IPTG-inducible shRNA targeting ABL1/2 were treated with IPTG (1 mM) for 5 days prior to plating, treated with DMSO (vehicle) or D/T (100 nM/20 nM) for 24 h, and lysates blotted with the indicated antibodies. A representative experiment from n = 4 independent experiments is shown. e M14-BMR cells were transfected with MAP3K1, MAP4K1, or scrambled siRNA, cells replated and treated with D/T (50/10 nM) −/+ nilotinib (2.5 μM) for 24 h, and lysates blotted with antibody (left). A representative experiment from n = 3 independent experiments is shown. (right) 293T cells were transfected with vector or MAP3K1 (exogenous form runs at 200 kDa), and lysates blotted after 48 h. A representative experiment from n = 2 independent experiments is shown. Vec = empty vector. f, g ABL1 (f) or MAP3K1 (g) immunoprecipitates (IP) from M14-BMR-treated cells, were blotted with the indicated antibodies. Representative experiments from n = 4 (f) and n = 3 (g) independent experiments are shown. Input is whole-cell lysate. Rabbit (f) or mouse (g) IgG served as a negative isotype controls. D/T = 100/20 nM; nilotinib = 2.5 μM; BV02 = 5 μM.
Fig. 7
Fig. 7. ABL1/2 phosphorylate MAP3K1 and 14-3-3-ε.
a 293T cells were transfected with His-MAP3K1 and/or constitutively active forms of ABL1 or ABL2 (PP), His-MAP3K1 pelleted with nickel agarose, complexes blotted with phospho-tyrosine (pTyr) antibody, and blot stripped and reprobed with control antibodies. Blots shown are representative of n = 3 independent experiments. b Endogenous MAP3K1 or 14-3-3 (pan) were immunoprecipitated from M14-BMR cells, and IPs blotted with the indicated antibodies. Blots shown are representative of n = 2 independent experiments. c Recombinant forms of ABL1 or ABL2 were incubated with full-length, recombinant MAP3K1 in a “cold” in vitro kinase assay, and reactions blotted with phospho-tyrosine (pTyr) antibody, stripped and reprobed with antibody to MAP3K1. Blots shown are representative of n = 2 independent experiments. d Recombinant proteins were incubated in a kinase assay as in c using either His-MAP3K1, GST-14-3-3-ε, or the combination as substrates. The phospho-tyrosine blot (top) was stripped and reprobed with antibody directed at the MAP3K1 C-terminus (middle) or GST (bottom; to visualize 14-3-3). Blots shown are representative of n = 2 independent experiments. e Scheme showing mechanism by which ABL1/2 drive ERK reactivation and resistance (red arrows).
Fig. 8
Fig. 8. Nilotinib reverses and prevents resistance, in vivo.
a–c Mel1617-BR (BR) or parental cells (Mel) were injected s.q. into SCID-beige mice, and when average tumor size was 200 mm3, Mel1617-BR mice were randomized to vehicle (Veh, n = 12), nilotinib (nilo, n = 12; 33 mg/kg, b.i.d.), PLX4720 (PLX, 25 mg/kg, n = 12), or combination (n = 11). Parental xenografts were treated with vehicle or PLX (n = 5/group). Mice were euthanized when control tumors ≅1500 mm3 (or were ulcerated). a Individual mouse tumor volumes over time. b Kaplan–Meier survival analysis comparing tumor doubling across groups. Percentage of mice not reaching the tumor doubling endpoint. Logrank p = 0.00451. PLX + nilo vs. vehicle, p = 0.0202; PLX + nilo vs. nilo, p = 0.0093; PLX + nilo vs. PLX, p = 0.0202 using pairwise comparisons and Holm’s multiple comparison adjustment. c PLX + nilotinib-treated mice were divided into responding (n = 7) and non-responding (n = 4) groups, and mean ± SEM tumor volumes plotted. Some SEMs are too small to visualize. One-way ANOVA followed by Sidak’s multiple comparisons test for responding vs. other groups. veh, p = 0.0104; nilo, p = 0.0004; PLX, p = 0.0027; non-responding, p = 0.0116. d–g M14-BMR (BMR) or parental M14 (M14) xenografts were established in nude mice. BMR xenografts treated with vehicle, nilotinib (33 mg/kg, b.i.d.), dabrafenib (25 mg/kg/day) + trametinib (0.15 mg/kg/day) (D/T), or D/T + nilotinib (n = 12/group) when tumors were 200 mm3. Parental xenografts were treated with vehicle or D/T (n = 5/group). d Mean ± SEM tumor volumes. Vehicle/nilotinib-treated mice and four mice from D/T and D/T + nilo groups were euthanized on d35. Linear mixed model analysis: for all comparisons, p = 3e−04. e H&E and MYC immunohistochemical staining of representative tumors (d) from n = 4 mice/group. f Survival analysis. Time-to-tumor doubling on d35. Percentage of mice not reaching the tumor doubling endpoint. Logrank p = 1.07e−06. Pairwise comparisons and Holm’s: p < 6.46e−05 for all groups. g D/T and D/T + nilotinib mice (n = 8/group) were followed long term. Mean ± SEM tumor volumes are shown. Dotted line indicates loss of euthanized mice (4/group). h, i In vivo prevention study. M14 parental tumors were established in nude mice, and mice treated with the indicated drugs. Vehicle, n = 5; nilo, n = 6; D/T, n = 11; DT + nilo, n = 12. h Mean ± SEM tumor volumes. Dotted lines indicate loss of mice (high tumor volume and/or tumor ulceration). i Percentage of mice that developed resistance/relapse (tumors ≥ 300 mm3). Fisher’s exact test, p = 0.0000673 (two sided). Additional data and statistics related to these experiments are shown in Supplementary Fig. 8.

Similar articles

Cited by

References

    1. Spagnolo, F., Boutros, A., Tanda, E. & Queirolo, P. The adjuvant treatment revolution for high-risk melanoma patients. Semin. Cancer Biol. 59, 283–289 (2019). - PubMed
    1. Weiss SA, Wolchok JD, Sznol M. Immunotherapy of melanoma: facts and hopes. Clin. Cancer Res. 2019;25:5191–5201. doi: 10.1158/1078-0432.CCR-18-1550. - DOI - PMC - PubMed
    1. Cohen, J. V. & Sullivan, R. J. Developments in the space of new MAPK pathway inhibitors for BRAF-mutant melanoma. Clin. Cancer Res.10.1158/1078-0432.CCR-18-0836 (2019). - PMC - PubMed
    1. Savoia, P., Fava, P., Casoni F. & Cremona O. Targeting the ERK signaling pathway in melanoma. Int. J. Mol. Sci.20, 1483 (2019). - PMC - PubMed
    1. Kakadia S, et al. Mechanisms of resistance to BRAF and MEK inhibitors and clinical update of US Food and Drug Administration-approved targeted therapy in advanced melanoma. Onco Targets Ther. 2018;11:7095–7107. doi: 10.2147/OTT.S182721. - DOI - PMC - PubMed

Publication types

MeSH terms