. 2020 Oct 8:11:575669.
doi: 10.3389/fimmu.2020.575669. eCollection 2020.

Dracocephalum heterophyllum (DH) Exhibits Potent Anti-Proliferative Effects on Autoreactive CD4+ T Cells and Ameliorates the Development of Experimental Autoimmune Uveitis

Affiliations

Dracocephalum heterophyllum (DH) Exhibits Potent Anti-Proliferative Effects on Autoreactive CD4+ T Cells and Ameliorates the Development of Experimental Autoimmune Uveitis

Jiang Bian et al. Front Immunol. .

Abstract

Experimental autoimmune uveitis (EAU) is a CD4+ T cell-mediated organ-specific autoimmune disease and has been considered as a model of human autoimmune uveitis. Dracocephalum heterophyllum (DH) is a Chinese herbal medicine used in treating hepatitis. DH suppressed the production of inflammatory cytokines through the recruitment of myeloid-derived suppressor cells (MDSCs) to the liver. However, it remains elusive whether DH can directly regulate CD4+ T cell biology and hence ameliorates the development of CD4+ T cell-mediated autoimmune disease. In the current study, we found that DH extract significantly suppressed the production of pro-inflammatory cytokines by CD4+ T cells. Further study showed that DH didn't affect the activation, differentiation, and apoptosis of CD4+ T cells. Instead, it significantly suppressed the proliferation of conventional CD4+ T cells both in vitro and in vivo. Mechanistic study showed that DH-treated CD4+ T cells were partially arrested at the G2/M phase of the cell cycle because of the enhanced inhibitory phosphorylation of Cdc2 (Tyr15). In addition, we demonstrated that treatment with DH significantly ameliorated EAU in mice through suppressing the proliferation of autoreactive antigen specific CD4+ T cells. Taken together, the current study indicates that DH-mediated suppression of CD4+ T cell proliferation may provide a promising therapeutic strategy for treating CD4+ T cell-mediated diseases.

Keywords: T cell; autoimmunity; experimental autoimmune uveitis; herbal medicine; proliferation.


Figures

Figure 1
Figure 1
Characterization of DH ethyl acetate fraction. DH ethyl acetate fraction was prepared as described in the materials & methods. The main components (A) in the fraction and their chemical formula (B) were determined by HPLC.
Figure 2
Figure 2
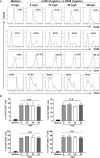
DH suppresses the production of inflammatory cytokines by CD4+ T cells. CD4+ T cells were isolated from the mesenteric lymph node (MLN) of naïve 6-8-week-old C57BL/6 mice. Cells were cultured in 96-well plate at 2×10⁵ cells/well and stimulated with anti-CD3 (1 μg/ml) plus anti-CD28 (1 μg/ml) in the absence (0 mg/L, DMSO control) or presence of DH (10, 20, and 40 mg/L). After 48 h, (A) culture supernatants were collected and the concentration of IFN-γ and IL-17A was determined by ELISA. (B–D) cells were re-stimulated with PMA plus ionomycin in the presence of protein transport inhibitor for 4 h. Cell surface staining was first performed with FITC-anti-CD4. Cells were then fixed, permeated, stained with PE-anti-IFN-γ and APC-anti-IL-17A, and analyzed by flow cytometry. The dot plot (B) and quantification (C) of the percentages of CD4+IFN-γ+ and CD4+IL-17A+ cells, as well as quantification of the mean fluorescence intensity (MFI) of IFN-γ and IL-17A (D) were shown. Cells shown in dot plots were gated on CD4+ T cells. (E) the number of CD4+ T cells was counted. (F) MTS assay was performed according to manufacturer’s instructions. Data shown are mean±SD (C, D) or representative (all other panels) of three independent experiments. n.s., no significance. **P < 0.01, ***P < 0.001.
Figure 3
Figure 3
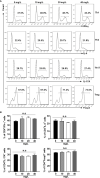
DH doesn’t affect CD4+ T-cell activation in vitro. Naïve CD4+ T cells (for the detection of CD25) and total CD4+ T cells (for the detection of CD44, CD62L and CD69) were isolated from the mesenteric lymph node (MLN) of naïve 6-8-week-old C57BL/6 mice. Cells were then cultured in 96-well plate at 2×10⁵ cells/well and stimulated with anti-CD3 (1 μg/ml) plus anti-CD28 (1 μg/ml) in the absence (0 mg/L, DMSO control) or presence of DH (10, 20, and 40 mg/L). Cells neither stimulated nor treated with DH were used as negative control (Medium). After 6 h (for CD25 and CD69) or 48 h (for CD44 and CD62L), cells were stained with FITC-anti-CD4 plus Perp-Cy5.5–anti-CD25, APC-anti-CD69, APC-anti-CD44 or APC-anti-CD62L, and analyzed by flow cytometry. The histogram (A) and quantification (B) of the percentages of CD4+CD25+, CD4+CD69+, CD4+CD44+, and CD4+CD62Llow cells were shown. Cells shown in histogram plots were gated on CD4+ T cells. Data are representative (A) or shown as mean±SD (B) of two independent experiments. n.s., no significance.
Figure 4
Figure 4
DH doesn’t affect CD4+ T-cell differentiation in vitro. Naїve CD4+ T cells were isolated from the mesenteric lymph node (MLN) of naïve 6-8-week-old C57BL/6 mice. Cells were then cultured in 96-well plate at 2×10⁵ cells/well under Th1, Th2, Th17 or Treg-inducing conditions and treated in the absence (0 mg/L, DMSO control) or presence of DH (10, 20, and 40 mg/L). After 72 h, cell surface staining was first performed with FITC-anti-CD4. Cells were then fixed, permeated, and stained with PE-anti-IFN-γ, APC-anti-IL-4, APC-anti-IL-17A or Alexa Flour 647-anti-Foxp3, respectively. The histogram (A) and quantification (B) of the percentages of CD4+IFN-γ+, CD4+IL-4+, CD4+IL-17A+ and CD4+Foxp3+ cells were shown. Cells shown in histogram plots were gated on CD4+ T cells. Data are representative (A) or shown as mean±SD (B) of three independent experiments. n.s, no significance.
Figure 5
Figure 5
DH suppresses the proliferation of CD4+ T cells both in vitro and in vivo. (A, B) CD4+ T cells were isolated from the MLN of naïve 6-8-week-old C57BL/6 mice and labeled with CFSE. Cells were then cultured in 96-well plate at 2×10⁵ cells/well and stimulated with anti-CD3 (1 μg/ml) plus anti-CD28 (1 μg/ml) in the absence (0 mg/L, DMSO control) or presence of DH (10, 20, and 40 mg/L). After 72 h, cell proliferation was examined by flow cytometry. The histogram (A) and quantification (B) of the proliferating CD4+ T cells were shown. Proliferating cells were defined as those showed at least one-folder dilution of CFSE. (C) CD4+ T cells were isolated and cultured as in (A, B) but without labeling with CFSE. After 48 h, cells were stained with APC-Annexin-V and PI, and then analyzed by flow cytometry. Data are presented as the percentage of live cells (Annexin V-PI-). (D–F) 6-8-week-old C57BL/6 mice were first intravenously injected with DMSO or DH (20 mg/kg). After 12 h, mice were intraperitoneally injected with 100 μl of 10 mg/ml BrdU. Administration of BrdU was repeated every 12 h for three consecutive days. 12 h after the last treatment, mice were sacrificed and total cells were isolated from PP, iEC, and LP. Cell surface staining was first performed with FITC-anti-CD4. Cells were then stained with APC-anti-BrdU and the total number of CD4+BrdU+ cells (D), the percentage (E) and total number (F) of CD4+ T cells were determined by flow cytometry. Cells shown in dot plots were gated on total live cells. Data are representative (A, E) or shown as the mean±SD (all other panels) of two independent experiments. PP, Peyer’s patches; iEC, intestinal epithelial cells; LP, lamina propria cells. n.s, no significance. *P < 0.05, **P < 0.01, ***P < 0.001.
Figure 6
Figure 6
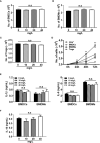
DH does not affect the proliferation of myeloid cells and regulatory T cells. (A, B) BMDCs (A) and BMDMs (B) were cultured in 96-well plate at 2×10⁵ cells/well and treated with or without different concentrations of DH as indicated. Total cell number was counted 48 h after treatment. (C) CD4+CD25+YFP+ Tregs were isolated from Foxp3-YFP transgenic mice and cultured in 96-well plate at 2×10⁵ cells/well. Cells were treated with anti-CD3 (1 μg/ml) plus anti-CD28 (1 μg/ml) in the absence (0 mg/L, DMSO control) or presence of different concentrations of DH as indicated. Total cell number was counted 48 h after treatment. (D) BMDCs, BMDMs and Tregs were cultured as mentioned in (A-C) but without DH treatment. CD4+ T cells from the MLN of naïve 6-8-week-old C57BL/6 mice were cultured in 96-well plate at 2×10⁵ cells/well and stimulated with anti-CD3 (1 μg/ml) plus anti-CD28 (1 μg/ml). For all four types of cells, total cell number was counted at 24 h, 48 h and 72 h after cell culture. Asterisks indicate the significance of the difference between CD4+ T cells and BMDCs (the second fastest growing cell type). (E) BMDCs and BMDMs were treated with LPS (1 μg/ml) in the absence (0 mg/L, DMSO control) or presence of different concentrations of DH as indicated. After 24 h, the concentration of IL-1β and IL-6 in the culture supernatant was determined by ELISA. (F) CD4+CD25+YFP+ Tregs were treated with anti-CD3 (1 μg/ml) plus anti-CD28 (1 μg/ml) in the absence (0 mg/L, DMSO control) or presence of different concentrations of DH as indicated. After 48 h, the concentration of IL-10 in the culture supernatant was determined by ELISA. For all panels, data are shown as the mean±SD of triplicates and are representative of two independent experiments. BMDCs: bone marrow-derived dendritic cells; BMDMs, bone marrow-derived macrophages; Tregs, regulatory T cells. MLN, mesenteric lymph node; n.s., no significance. **P < 0.01.
Figure 7
Figure 7
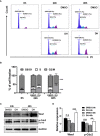
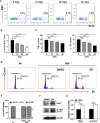
DH-treated CD4+ T cells are partially arrested at the G2/M phase of the cell cycle. (A, B) CD4+ T cells from the mesenteric lymph node (MLN) of naïve 6-8-week-old C57BL/6 mice were cultured in 96-well plate at 2×10⁵ cells/well and stimulated with anti-CD3 (1 μg/ml) plus anti-CD28 (1 μg/ml) in the absence (0 mg/L, DMSO control) or presence of DH (40 mg/L). Cells neither stimulated nor treated with DH were used as control (0 h). After 24 h or 48 h, cells were collected and stained with propidium iodide (PI) and the DNA contents were assayed by flow cytometry analysis. The histogram (A) and quantification (B) of the percentages of CD4+ T cells in the G0/G1, S, G2/M phase of the cell cycle were shown. (C, D) CD4+ T cells from the MLN of naïve 6-8-week-old C57BL/6 mice were cultured in 24-well plate at 5×10⁶ cells/well and treated as mentioned in (A, B). The expression of p-cdc2 (Tyr15) and wee1 kinase was determined by western blotting at 24 h and 48 h. GAPDH expression was used as loading control. Data are representative (A, D) or shown as the mean±SD (B, D) of two independent experiments. n.s, no significance. ***P < 0.001.
Figure 8
Figure 8
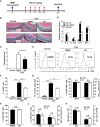
Treatment with DH ameliorates EAU in mice. (A) Schematic illustration of the induction and treatment of IRBP-induced EAU in mice. The red arrowheads indicate the treatment with DH or DMSO. The numbers indicate the day after IRBP immunization. (B, C) Mice were sacrificed at the 21st day after immunization and histopathological profiles of the eye were determined by hematoxylin and eosin staining. Normal mice, which neither induced EAU nor treated with DMSO or DH, were used as negative control. Ordered retina layers were shown in (B). The severity of EAU (n=10) was evaluated in a masked fashion on a scale of 0-4 as described in the materials & methods (C). (D) Mice were sacrificed at the 21st day after immunization and total cells were isolated from the eye and treated with anti-CD3 (1 μg/ml) plus anti-CD28 (1 μg/ml) for 48 h. The concentration of IL-2, IL-17A, IL-6 and IFN-γ in the culture supernatant was determined by ELISA. (E–K) Mice were treated as in (A) and sacrificed at the 21st day after immunization. Total cells were isolated from the eye, stained with FITC-anti-CD4, and analyzed by flow cytometry. The histogram (E) and quantification of the percentage (F) and absolute number (G) of CD4+ T cells were shown. Cells shown in histogram plots were gated on total live cells. To examine the degree of cell death, cells were stained first with FITC-anti-CD4 and then APC-anti-Annexin V and PI. The percentage of live CD4+ T cells (CD4+Annexin-VPI) within gated CD4+ T cells was determined by flow cytometry (H). To examine CD4+ T cell activation, cells were stained with FITC-anti-CD4 plus APC-anti-CD44 or APC-anti-CD62L, and analyzed by flow cytometry (I). To examine the production of inflammatory cytokines by CD4+ T cells using flow cytometry, cells were re-stimulated with PMA plus ionomycin in the presence of protein transport inhibitor for 4 h. Cell surface staining was first performed with FITC-anti-CD4. Cells were then fixed, permeated, and stained with PE-anti-IFN-γ and APC-anti-IL-17A. The percentages of CD4+IFN-γ+ and CD4+IL-17A+ cells (J) and the mean fluorescence intensity (MFI) of IFN-γ and IL-17A (K) were determined by flow cytometry analysis (gated on CD4+ T cells). Data shown are mean±SD (C, F–K) or representative (B, D, E) of two independent experiments. n.s, no significance. *P < 0.05, **P < 0.01, ***P < 0.001.
Figure 9
Figure 9
DH-treated mice exhibited normal percentage and number of CD4+ T cells in the cervical lymph node (CLN). Mice were treated as in Figure 8 and sacrificed at the 21st day after immunization. Total cells were isolated from the cervical lymph node (CLN), stained with FITC-anti-CD4, and analyzed by flow cytometry. The histogram (A) and quantification (B) of the percentage of CD4+ T cells and the absolute number of CD4+ T cells (C) were shown. Cells shown in histogram plots were gated on total live cells. Data are representative (A) or shown as mean±SD (B, C) of two independent experiments. n.s, no significance.
Figure 10
Figure 10
MDSCs recruitment in the eye was not affected in DH-treated mice. Mice were treated as in Figure 8 and sacrificed at the 21st day after immunization. Cells were isolated from the eye and stained with FITC-anti-Gr1 and APC-anti-CD11b. The percentage of CD11b+Gr1+ cells was determined by flow cytometry. The dot plot (A) and quantification (B) of the percentage of CD11b+Gr1+ cells were shown. Cells shown in dot plots were gated on total live cells. Data are representative (A) or shown as mean±SD (B) of two independent experiments. MDSCs: myeloid-derived suppressor cells. n.s, no significance.
Figure 11
Figure 11
DH suppresses the proliferation of autoreactive antigen-specific CD4+ T cells. (A–C) CD4+ T cells were isolated from the CLN of IRBP-immunized mice 10 days after immunization. BMDCs were prepared from naïve C57BL/6 mice and treated with LPS (100 ng/ml) for 24 h. Matured BMDCs were furthered purified using EasySep™ Mouse CD11c Positive Selection Kit. 3 × 10⁵ CD4+ T cells were mixed with 0.6×10⁵ matured BMDC in 96-well plate and stimulated with IRBP peptide (30 μg/ml) in the absence (0 mg/L, DMSO control) or presence of DH (10, 20, and 40 mg/L). For the detection of cell proliferation, 10 μM BrdU was also added to the cell culture medium. After 72 h, cell surface staining was first performed with FITC-anti-CD4. Cells were then stained with APC-anti-BrdU and cell proliferation was analyzed by flow cytometry. The dot plot (A) and quantification (B) of the percentage of CD4+BrdU+ cells were shown. Cells shown in dot plots were gated on CD4+ T cells. Gating strategy for BrdU was based on control sample not stained with APC-anti-BrdU. In addition, the concentration of IFN-γ and IL-17A in the cell culture supernatant was determined by ELISA after 48 h (C). (D–F) CD4+ T cells from the CLN of IRBP-immunized mice were stimulated as mentioned in (A-C) with the exception that only 40 mg/L of DH was used. Cells neither stimulated nor treated with DH were used as control (0 h). After 48 h, cells were stained with FITC-anti-CD4 and propidium iodide (PI) and DNA contents were assayed by flow cytometry analysis. The histogram (D) and quantification (E) of the percentages of CD4+ T cells in the G0/G1, S, G2/M phase of the cell cycle were shown. Cells shown in histogram plots were gated on CD4+ T cells. In addition, the expression of p-Cdc2 (Tyr15) and Wee1 kinase was determined by western blotting at 48 h (F, G). GAPDH expression was used as loading control. Data shown are mean±SD (B, E, G) or representative (all other panels) of two independent experiments. CLN, cervical lymph node. *P < 0.05, **P < 0.01, ***P < 0.001.

Similar articles

Cited by

References

    1. Caspi RR, Roberge FG, Chan CC, Wiggert B, Chader GJ, Rozenszajn LA, et al. A new model of autoimmune disease. Experimental autoimmune uveoretinitis induced in mice with two different retinal antigens. J Immunol (1988) 140:1490–5. - PubMed
    1. Saoudi A, Kuhn J, Huygen K, de Kozak Y, Velu T, Goldman M, et al. TH2 activated cells prevent experimental autoimmune uveoretinitis, a TH1-dependent autoimmune disease. Eur J Immunol (1993) 23:3096–103. 10.1002/eji.1830231208 - DOI - PubMed
    1. Caspi RR, Sun B, Agarwal RK, Silver PB, Rizzo LV, Chan CC, et al. T cell mechanisms in experimental autoimmune uveoretinitis: susceptibility is a function of the cytokine response profile. Eye (London England) (1997) 11( Pt 2):209–12. 10.1038/eye.1997.53 - DOI - PubMed
    1. Tarrant TK, Silver PB, Wahlsten JL, Rizzo LV, Chan CC, Wiggert B, et al. Interleukin 12 protects from a T helper type 1-mediated autoimmune disease, experimental autoimmune uveitis, through a mechanism involving interferon gamma, nitric oxide, and apoptosis. J Exp Med (1999) 189:219–30. 10.1084/jem.189.2.219 - DOI - PMC - PubMed
    1. Dullforce PA, Seitz GW, Garman KL, Michael JA, Crespo SM, Fleischman RJ, et al. Antigen-specific accumulation of naive, memory and effector CD4 T cells during anterior uveitis monitored by intravital microscopy. Cell Immunol (2006) 239:49–60. 10.1016/j.cellimm.2006.03.005 - DOI - PubMed

Publication types

MeSH terms

Supplementary concepts