

Modulation of Small RNA Signatures in Schwann-Cell-Derived Extracellular Vesicles by the p75 Neurotrophin Receptor and Sortilin
- PMID: 33114403
- PMCID: PMC7694014
- DOI: 10.3390/biomedicines8110450
Modulation of Small RNA Signatures in Schwann-Cell-Derived Extracellular Vesicles by the p75 Neurotrophin Receptor and Sortilin
Abstract
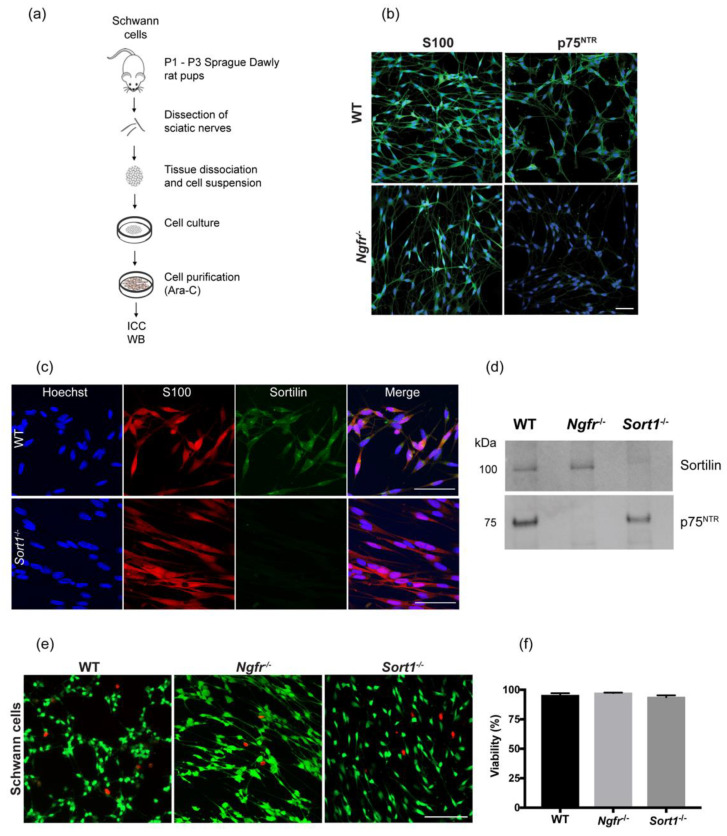
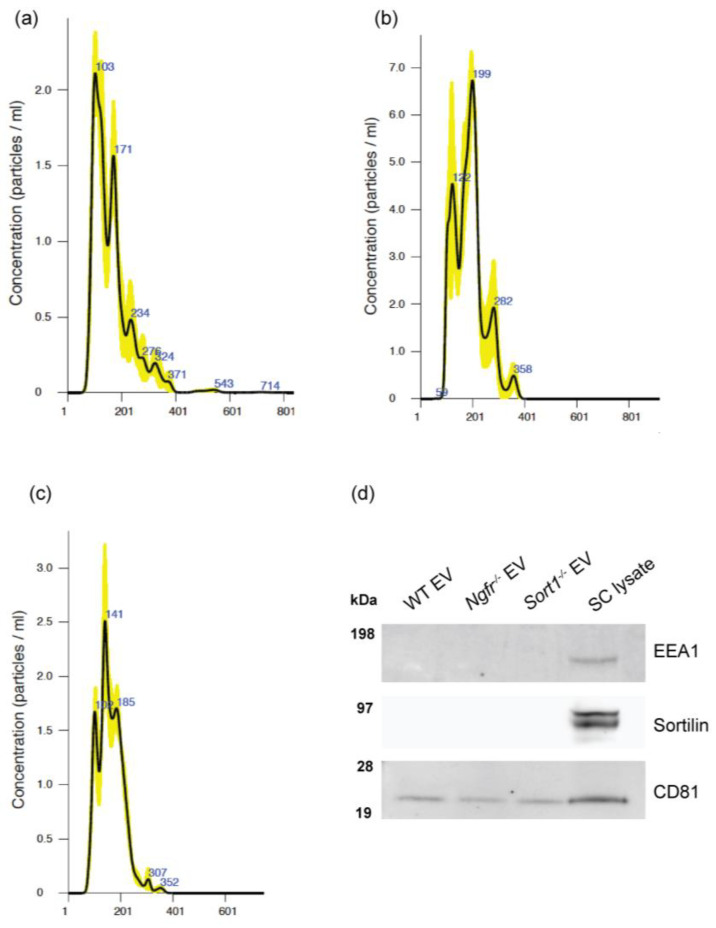
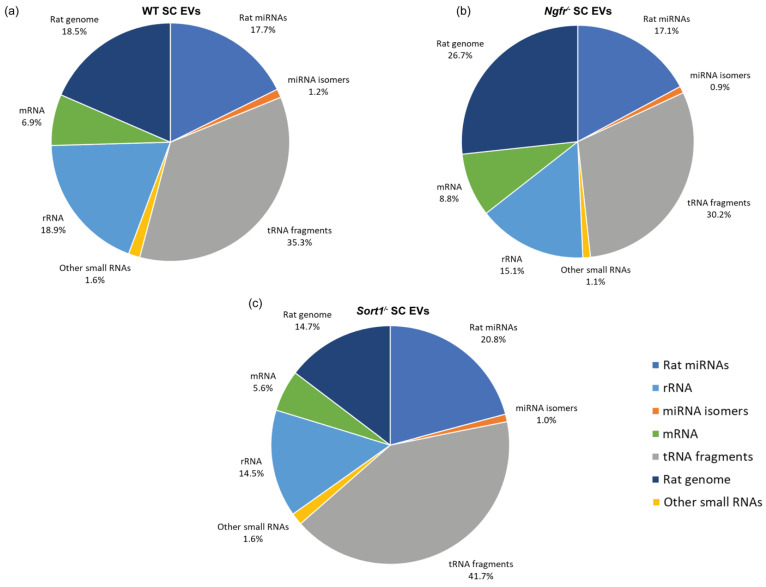
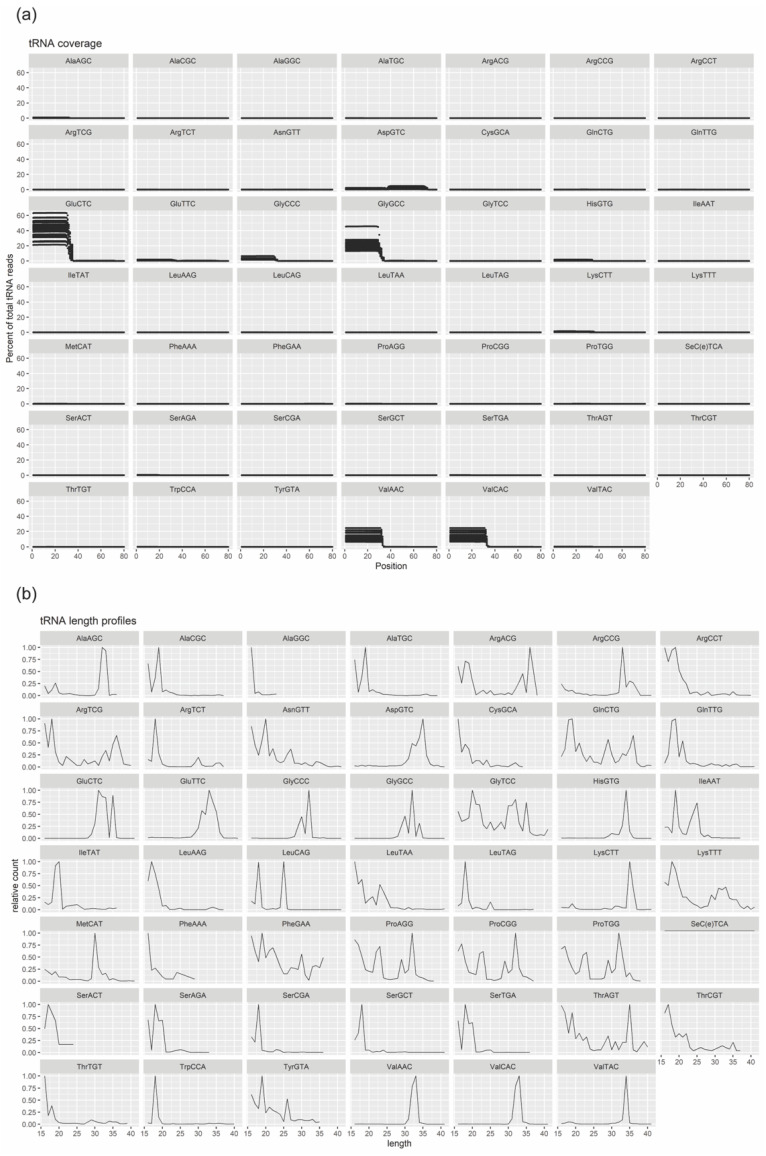
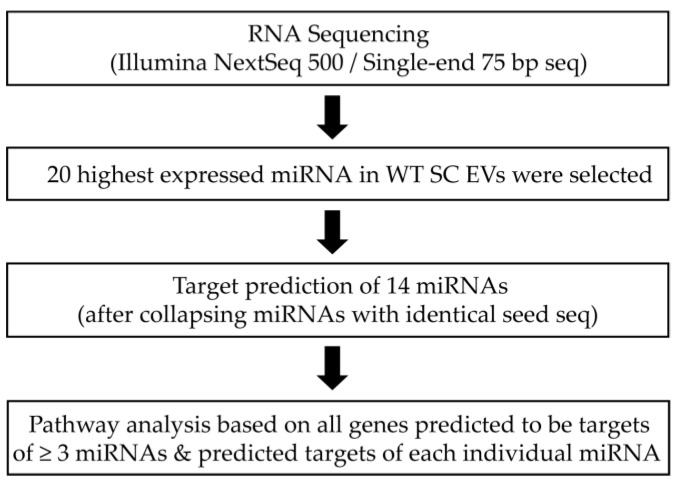
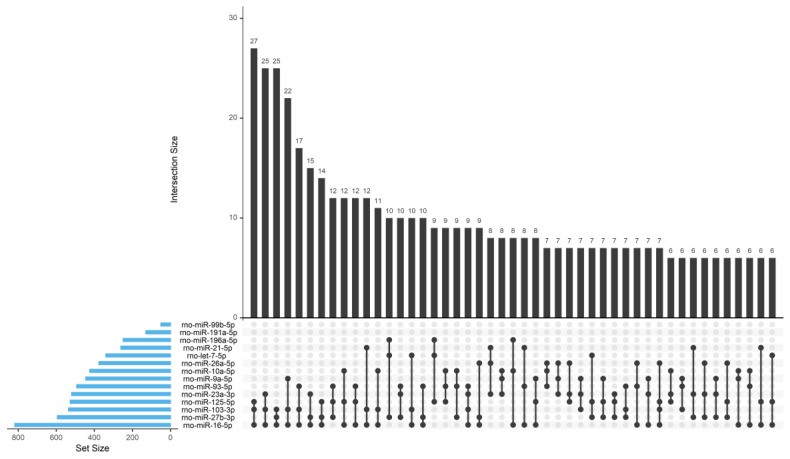
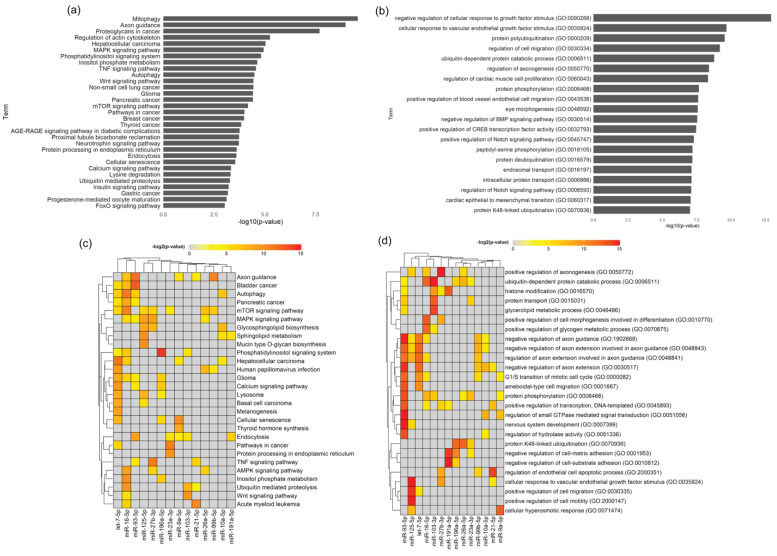
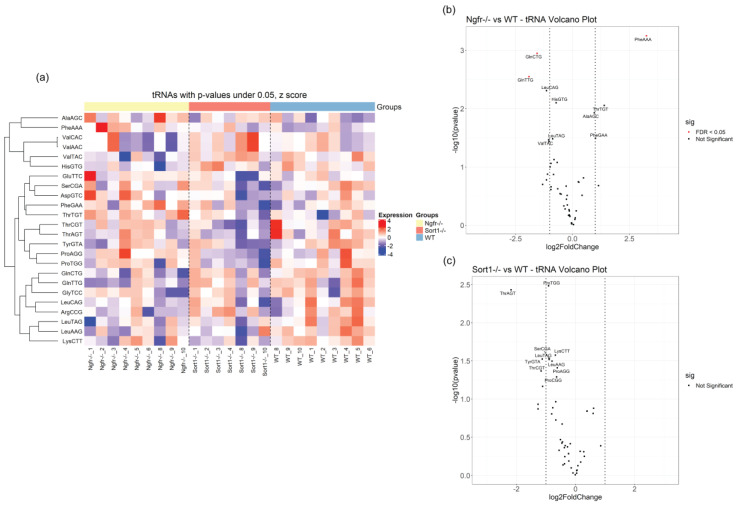
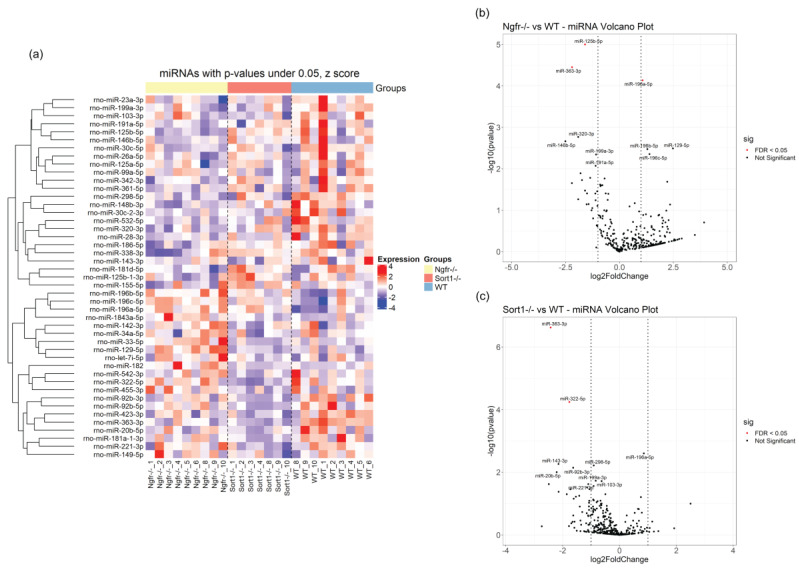
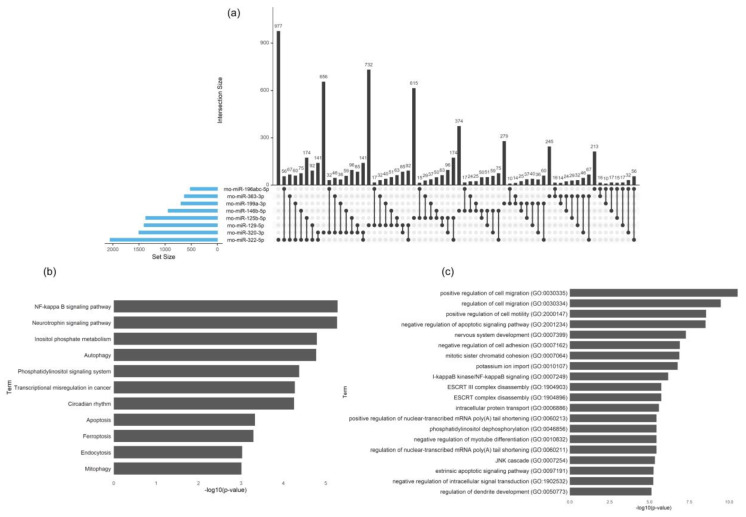
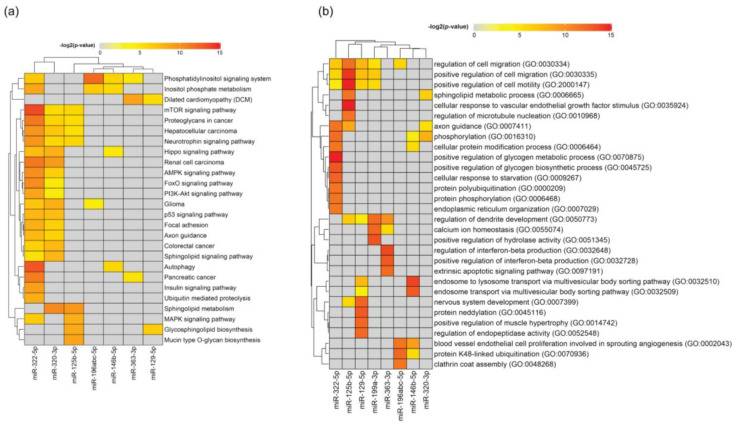
Schwann cells (SCs) are the main glial cells of the peripheral nervous system (PNS) and are known to be involved in various pathophysiological processes, such as diabetic neuropathy and nerve regeneration, through neurotrophin signaling. Such glial trophic support to axons, as well as neuronal survival/death signaling, has previously been linked to the p75 neurotrophin receptor (p75NTR) and its co-receptor Sortilin. Recently, SC-derived extracellular vesicles (EVs) were shown to be important for axon growth and nerve regeneration, but cargo of these glial cell-derived EVs has not yet been well-characterized. In this study, we aimed to characterize signatures of small RNAs in EVs derived from wild-type (WT) SCs and define differentially expressed small RNAs in EVs derived from SCs with genetic deletions of p75NTR (Ngfr-/-) or Sortilin (Sort1-/-). Using RNA sequencing, we identified a total of 366 miRNAs in EVs derived from WT SCs of which the most highly expressed are linked to the regulation of axonogenesis, axon guidance and axon extension, suggesting an involvement of SC EVs in axonal homeostasis. Signaling of SC EVs to non-neuronal cells was also suggested by the presence of several miRNAs important for regulation of the endothelial cell apoptotic process. Ablated p75NTR or sortilin expression in SCs translated into a set of differentially regulated tRNAs and miRNAs, with impact in autophagy and several cellular signaling pathways such as the phosphatidylinositol signaling system. With this work, we identified the global expression profile of small RNAs present in SC-derived EVs and provided evidence for a regulatory function of these vesicles on the homeostasis of other cell types of the PNS. Differentially identified miRNAs can pave the way to a better understanding of p75NTR and sortilin roles regarding PNS homeostasis and disease.
Keywords: Schwann cells; exosomes; extracellular vesicles (EVs); miRNAs; p75NTR receptor; sortilin.
Conflict of interest statement
The authors declare no conflict of interest. The funders had no role in the design of the study; in the collection, analyses, or interpretation of data; in the writing of the manuscript, or in the decision to publish the results.
Figures
Similar articles
-
Schwann cell p75 neurotrophin receptor modulates small fiber degeneration in diabetic neuropathy.Glia. 2020 Dec;68(12):2725-2743. doi: 10.1002/glia.23881. Epub 2020 Jul 13. Glia. 2020. PMID: 32658363
-
Merlin status regulates p75(NTR) expression and apoptotic signaling in Schwann cells following nerve injury.Neurobiol Dis. 2015 Oct;82:114-122. doi: 10.1016/j.nbd.2015.05.021. Epub 2015 Jun 6. Neurobiol Dis. 2015. PMID: 26057084 Free PMC article.
-
Schwann cell p75NTR prevents spontaneous sensory reinnervation of the adult spinal cord.Brain. 2010 Feb;133(Pt 2):421-32. doi: 10.1093/brain/awp316. Epub 2010 Jan 3. Brain. 2010. PMID: 20047901
-
Schwann cell-derived exosomes: Janus-faced mediators of regeneration and disease.Glia. 2022 Jan;70(1):20-34. doi: 10.1002/glia.24087. Epub 2021 Sep 14. Glia. 2022. PMID: 34519370 Review.
-
p75 Neurotrophin Receptor: A Double-Edged Sword in Pathology and Regeneration of the Central Nervous System.Vet Pathol. 2018 Nov;55(6):786-801. doi: 10.1177/0300985818781930. Epub 2018 Jun 25. Vet Pathol. 2018. PMID: 29940812 Review.
Cited by
-
Sortilin Modulates Schwann Cell Signaling and Remak Bundle Regeneration Following Nerve Injury.Front Cell Neurosci. 2022 May 11;16:856734. doi: 10.3389/fncel.2022.856734. eCollection 2022. Front Cell Neurosci. 2022. PMID: 35634462 Free PMC article.
-
miRNA-21-5p is an important contributor to the promotion of injured peripheral nerve regeneration using hypoxia-pretreated bone marrow-derived neural crest cells.Neural Regen Res. 2025 Jan 1;20(1):277-290. doi: 10.4103/1673-5374.390956. Epub 2023 Dec 15. Neural Regen Res. 2025. PMID: 38767492 Free PMC article.
-
Paeoniflorin Effect of Schwann Cell-Derived Exosomes Ameliorates Dorsal Root Ganglion Neurons Apoptosis through IRE1α Pathway.Evid Based Complement Alternat Med. 2021 Sep 27;2021:6079305. doi: 10.1155/2021/6079305. eCollection 2021. Evid Based Complement Alternat Med. 2021. PMID: 34616478 Free PMC article.
-
The Role of Intravesicular Proteins and the Protein Corona of Extracellular Vesicles in the Development of Drug-Induced Polyneuropathy.Curr Issues Mol Biol. 2023 Apr 7;45(4):3302-3314. doi: 10.3390/cimb45040216. Curr Issues Mol Biol. 2023. PMID: 37185740 Free PMC article. Review.
-
Distinct mRNAs in Cancer Extracellular Vesicles Activate Angiogenesis and Alter Transcriptome of Vascular Endothelial Cells.Cancers (Basel). 2021 Apr 22;13(9):2009. doi: 10.3390/cancers13092009. Cancers (Basel). 2021. PMID: 33921957 Free PMC article.
References
Grants and funding
LinkOut - more resources
Full Text Sources
Research Materials
