. 2020 Dec 3;5(23):e140759.
doi: 10.1172/jci.insight.140759.

MIR448 antagomir reduces arrhythmic risk after myocardial infarction by upregulating the cardiac sodium channel

MIR448 antagomir reduces arrhythmic risk after myocardial infarction by upregulating the cardiac sodium channel

Gyeoung-Jin Kang et al. JCI Insight. .

Abstract

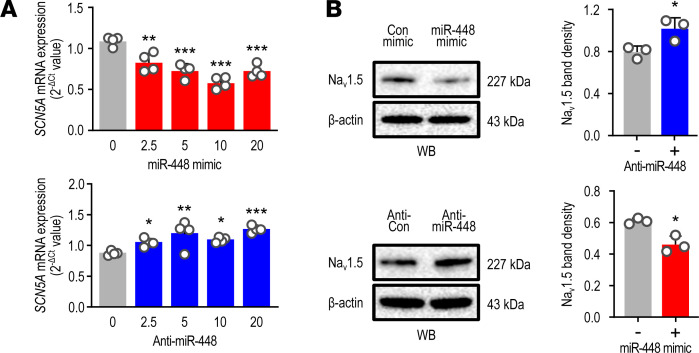
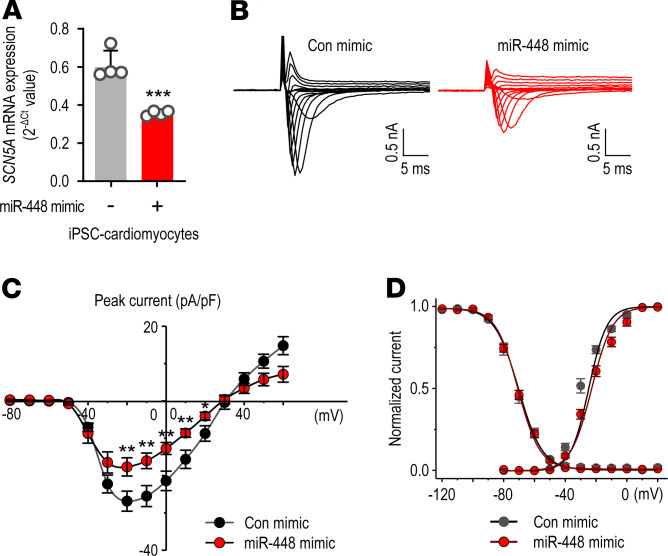
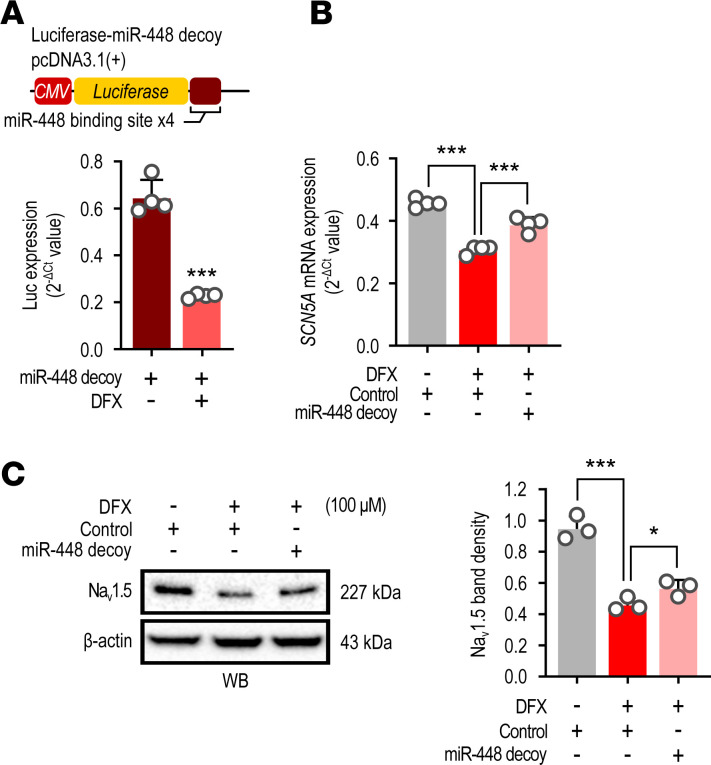
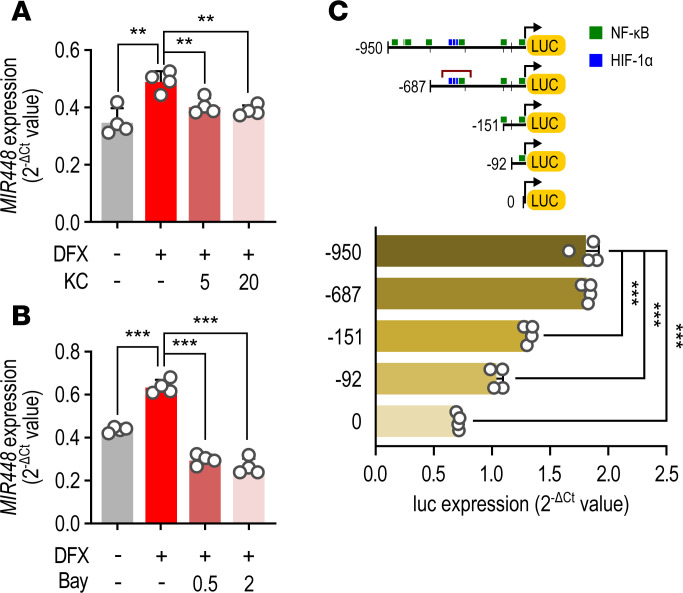
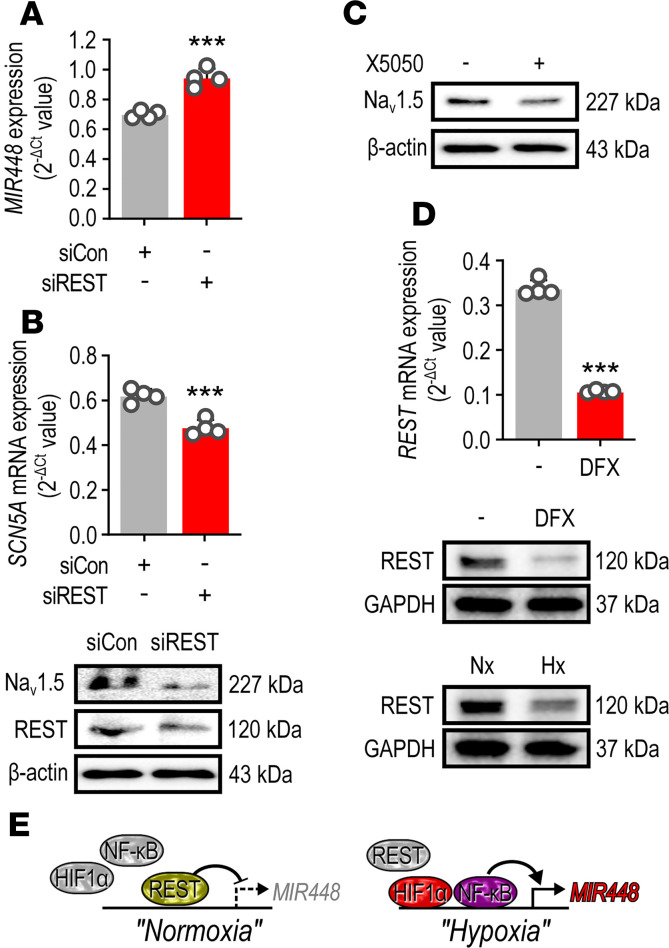
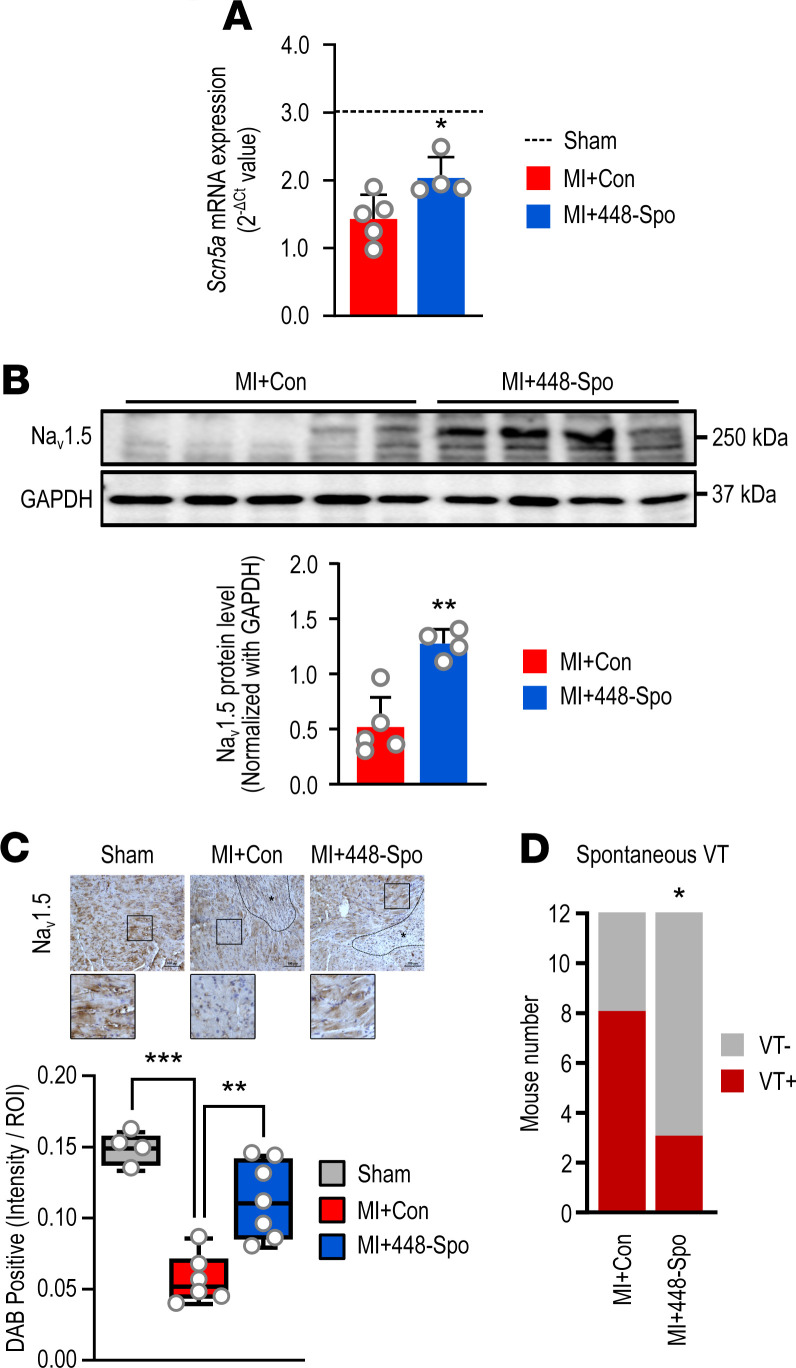
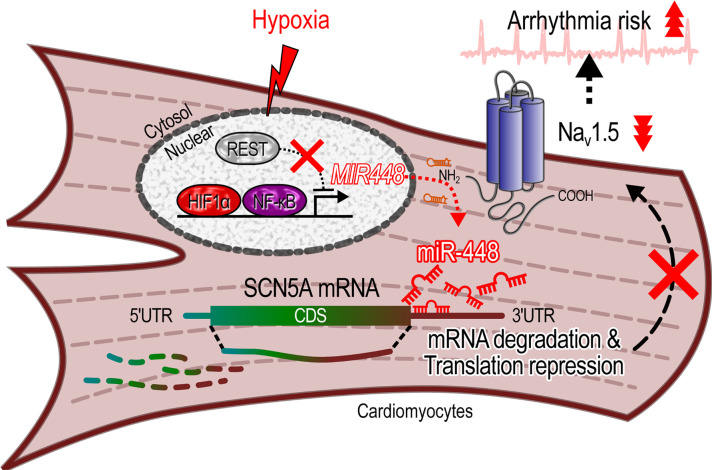
Cardiac ischemia is associated with arrhythmias; however, effective therapies are currently limited. The cardiac voltage-gated sodium channel α subunit (SCN5A), encoding the Nav1.5 current, plays a key role in the cardiac electrical conduction and arrhythmic risk. Here, we show that hypoxia reduces Nav1.5 through effects on a miR, miR-448. miR-448 expression is increased in ischemic cardiomyopathy. miR-448 has a conserved binding site in 3'-UTR of SCN5A. miR-448 binding to this site suppressed SCN5A expression and sodium currents. Hypoxia-induced HIF-1α and NF-κB were major transcriptional regulators for MIR448. Moreover, hypoxia relieved MIR448 transcriptional suppression by RE1 silencing transcription factor. Therefore, miR-448 inhibition reduced arrhythmic risk after myocardial infarction. Here, we show that ischemia drove miR-448 expression, reduced Nav1.5 current, and increased arrhythmic risk. Arrhythmic risk was improved by preventing Nav1.5 downregulation, suggesting a new approach to antiarrhythmic therapy.

Keywords: Arrhythmias; Cardiology; Sodium channels; hypoxia.


Conflict of interest statement

Conflict of interest: GJK and SCD have submitted a provisional patent (patent application no. 63/012,351) entitled, “Compositions and methods for increasing sodium current in cardiac cells,” which has been filed for the use of an antagomir to MIR448 as an antiarrhythmic therapy.

Figures

Figure 1
Figure 1. miR-448 increases in ischemia.
(A) miR-448 expression in human ischemic cardiomyopathy. Left ventricle tissue was obtained from heart failure patients with ischemic cardiomyopathy. (healthy control n = 5, ischemic cardiomyocyte [CM] n = 4). (B) miR-448 expression in murine myocardial infarction (MI). Left ventricle tissue was obtained from the peri-infarct and distal regions for comparison. Data are represented as the mean ± SD or mean + SD of 4–5 samples. **P < 0.01 (when compared between indicated groups by Student’s t test). (C) Effect of hypoxia on the miR-448 level in CMs. RL14 cells were incubated in normoxic (21% O2) and hypoxic (2% O2) conditions for 6 hours. (D) Effect of hypoxia-mimetic media on the miR-448 level in CMs. RL14 cells were stimulated with cobalt chloride (CoCl2) and desferrioxamine (DFX) for 24 hours. Data are represented as the mean + SD of 4 independent experiments. ***P < 0.001 (when compared between indicated groups by Student’s t test).
Figure 2
Figure 2. SCN5A is a direct target of miR-448.
(A) Conserved miR-448 binding site within SCN5A 3′-UTR. (B) Diagram of luciferase reporter constructs. The WT or mutant (Mut) SCN5A 3′-UTRs were inserted downstream of the luciferase gene of the pGL3-promoter vector. (C) Effect of miR-448 on luciferase mRNA expression in human embryonic kidney 293T (HEK293T). Cells were transfected with WT or mutation plasmid DNA, and then miR-448 mimic or inhibitor were transfected into the cells (10 nM). Data are shown as the mean + SD of 4 independent experiments. **P < 0.01, ***P < 0.001 (when compared between indicated groups by Student’s t test).
Figure 3
Figure 3. SCN5A is regulated by miR-448.
(A) Effect of miR-448 on the SCN5A mRNA level in CMs. Cells were transfected with mimic or anti miR-448 and then incubated for 24 hours (2.5, 5, 10, and 20 nM). Data are represented as the mean + SD of 3–4 independent experiments. One-way ANOVA with Sidak’s multiple-comparison test was performed to determine the P value. * P < 0.05, **P < 0.01, ***P < 0.001 (represent comparison of mimic or anti-miR-448 to the control group). (B) Effect of miR-448 on the protein level of SCN5A in CMs. Cells were transfected with mimic or anti-miR-448 (10 nM) and then incubated for 24 hours. Representative Western blots (left) and bar graph (right) representing the quantitative Western blot analysis of Nav1.5. Data are represented as the mean + SD of 3–4 independent experiments. *P < 0.05 (when compared between indicated groups by Student’s t test).
Figure 4
Figure 4. Sodium channel currents are reduced by miR-448 mimic in human iPSC-CMs.
(A) Effect of miR-448 mimic on the SCN5A mRNA level in iPSC- CMs. Cells were transfected with miR-448 mimic (10 nM) and then incubated for 24 hours. (B) Representative whole-cell sodium current traces in response to increasing step depolarizations from either control (black) or miR-448 mimic-transfected iPSC-CMs (red). (C) Average sodium current–voltage relationship of voltage-dependent sodium channels from either control (black)- or miR-448 mimic (red)-transfected iPSC-CMs. (D) Average voltage-dependence of activation and steady-state inactivation in control (black) and miR-448 mimic-transfected iPSC-CMs (red). For the activation curve, normalized peak conductance was plotted as a function of the membrane potential. For the inactivation curve, peak sodium currents were normalized to maximum values in each cell and plotted as a function of the voltage of the conditioning step. Data are represented as the mean + SD or mean ± SEM. *P < 0.05, **P < 0.01, ***P < 0.001 (when compared between indicated groups by Student’s t test).
Figure 5
Figure 5. SCN5A is regulated by hypoxia-induced miR-448.
(A) Diagram of luciferase reporter constructs. The miR-448 binding sequences were inserted downstream of the luciferase gene of the pGL3-promoter vector. Cells were transfected with miR-448 decoy and then luciferase (LUC) expression was checked in the presence or absence of DFX. (B) Effect of miR-448 decoy on SCN5A mRNA expression reduced by simulated hypoxia in CMs. Cells were transfected with miR-448 decoy and then stimulated with DFX for 6 hours. (C) Effect of miR-448 decoy on the DFX-induced Nav1.5 protein in CMs. Cells were transfected with miR-448 decoy and then stimulated with DFX for 24 hours. Representative Western blots (top) and bar graph (bottom) representing the quantitative Western blot analysis of Nav1.5. Data are represented as the mean + SD of 3–4 independent experiments. *P < 0.05, ***P < 0.001 (when compared between indicated groups by Student’s t test or 1-way ANOVA with Dunnett’s multiple-comparison test).
Figure 6
Figure 6. HIF-1α and NF-κB are upregulators of MIR448 in hypoxia.
(A) Effect of KC7F2, a selective HIF-1α transcription inhibitor, on the induction of miR-448 by DFX in CMs. (B) Effect of Bay11-7082, a NF-κB inhibitor, on the induction of miR-448 by DFX in CMs. Cells were treated with HIF-1α or NF-κB inhibitors in a dose-dependent manner (5, 20 or 0.5, 2 μM, respectively) for 30 minutes and then were stimulated with DFX for 6 hours. (C) Predicted binding sites for HIF-1α (blue squares) or NF-κB (green squares) are within 1 kb upstream of the MIR448 transcriptional initiation site. Diagrams show luciferase reporter constructs with 1 kb promoter MIR448 region or series of deletion mutants. Data are represented as the mean + SD of 4 independent experiments. **P < 0.01, *** P < 0.001 (when compared between indicated groups by Student’s t test or 1-way ANOVA with Sidak’s multiple-comparison test).
Figure 7
Figure 7. Ischemia relieves RE1 silencing transcription factor repression of MIR448.
(A) Effect of REST gene silencing on the miR-448 level in CMs. Cells were transfected with control or RE1 silencing transcription factor (REST) siRNA for 24 hours. (B) Effect of REST gene silencing on the mRNA (top) and protein (bottom) level of SCN5A in CMs. Cells were transfected with control or REST siRNA for 24 hours. (C) Effect of X5050, a REST inhibitor, on the protein level of Nav1.5 in CMs. Cells were treated with X5050 for 24 hours. (D) Effect of hypoxic condition on the mRNA (top) and protein (bottom) level of REST. Cells were stimulated with DFX for 6 hours or were incubated with normoxia or hypoxia for 6 hours. (E) Diagram showing MIR448 transcriptional regulation by HIF-1α, NF-κB, and REST in normoxia and hypoxia. Data are represented as the mean + SD of 4 independent experiments. ***P < 0.001 (when compared between indicated groups by Student’s t test).
Figure 8
Figure 8. Blocking of miR-448 improves Nav1.5 levels and arrhythmic risk after MI.
(A) Effect of miR-448 antagonism on cardiac SCN5A mRNA level after MI. The heart tissues were collected from MI+Con or MI+448-Spo. (B and C) Effect of miR-448 antagonism on protein level of cardiac Nav1.5 after MI. The heart tissues were collected from MI+Con or MI+448-Spo. IHC localization of Nav1.5 antigen done using formalin-fixed, paraffin-embedded heart tissues. Tissue sections were incubated with Nav1.5 antibody. Positively stained cells were evaluated using Image J analysis. (D) The number of mice in each group with or without ventricular tachycardia (VT). Data are represented as the mean + SD or mean ± SD. *P < 0.05, **P < 0.01, ***P < 0.001 (when compared between indicated groups by Student’s t test or 1-way ANOVA with Sidak’s multiple-comparison test).
Figure 9
Figure 9. Summary of the effect of hypoxia on miR-448, SCN5A, and arrhythmic risk.

Similar articles

Cited by

References

    1. Zaklyazminskaya E, Dzemeshkevich S. The role of mutations in the SCN5A gene in cardiomyopathies. Biochim Biophys Acta. 2016;1863(7 Pt B):1799–1805. - PubMed
    1. Zumhagen S, et al. A heterozygous deletion mutation in the cardiac sodium channel gene SCN5A with loss- and gain-of-function characteristics manifests as isolated conduction disease, without signs of Brugada or long QT syndrome. PLoS One. 2013;8(6):e67963. doi: 10.1371/journal.pone.0067963. - DOI - PMC - PubMed
    1. Grant AO. Molecular biology of sodium channels and their role in cardiac arrhythmias. Am J Med. 2001;110(4):296–305. doi: 10.1016/S0002-9343(00)00714-2. - DOI - PubMed
    1. Keating MT, Sanguinetti MC. Molecular and cellular mechanisms of cardiac arrhythmias. Cell. 2001;104(4):569–580. doi: 10.1016/S0092-8674(01)00243-4. - DOI - PubMed
    1. Aromolaran AS, Chahine M, Boutjdir M. Regulation of cardiac voltage-gated sodium channel by kinases: roles of protein kinases A and C. Handb Exp Pharmacol. 2018;246:161–184. - PubMed

Publication types

MeSH terms

LinkOut - more resources