Optimised tissue clearing minimises distortion and destruction during tissue delipidation
- PMID: 33107057
- PMCID: PMC8048831
- DOI: 10.1111/nan.12673
Optimised tissue clearing minimises distortion and destruction during tissue delipidation
Abstract
Aims: A variety of tissue clearing techniques have been developed to render intact tissue transparent. For thicker samples, additional partial tissue delipidation is required before immersion into the final refractive index (RI)-matching solution, which alone is often inadequate to achieve full tissue transparency. However, it is difficult to determine a sufficient degree of tissue delipidation, excess of which can result in tissue distortion and protein loss. Here, we aim to develop a clearing strategy that allows better monitoring and more precise determination of delipidation progress.
Methods: We combined the detergent sodium dodecyl sulphate (SDS) with OPTIClear, a RI-matching solution, to form a strategy termed Accurate delipidation with Optimal Clearing (Accu-OptiClearing). Accu-OptiClearing allows for a better preview of the final tissue transparency achieved when immersed in OPTIClear alone just before imaging. We assessed for the changes in clearing rate, protein loss, degree of tissue distortion, and preservation of antigens.
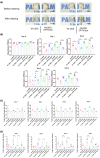
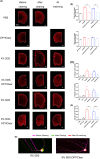
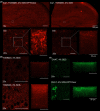
Results: Partial delipidation using Accu-OptiClearing accelerated tissue clearing and better preserved tissue structure and antigens than delipidation with SDS alone. Despite achieving similar transparency in the final OPTIClear solution, more lipids were retained in samples cleared with Accu-OptiClearing compared to SDS.
Conclusions: Combining the RI-matching solution OPTIClear with detergents, Accu-OptiClearing, can avoid excessive delipidation, leading to accelerated tissue clearing, less tissue damage and better preserved antigens.
Keywords: antigenicity; delipidation; opacity; protein loss; three-dimensional imaging; transparent brain.
© 2020 The Authors. Neuropathology and Applied Neurobiology published by John Wiley & Sons Ltd on behalf of British Neuropathological Society.
Conflict of interest statement
None of the authors have a conflict of interest.
Figures


Similar articles
-
Optical clearing of small intestine for three-dimensional visualization of cellular proliferation within crypts.J Anat. 2018 Jan;232(1):152-157. doi: 10.1111/joa.12711. Epub 2017 Oct 1. J Anat. 2018. PMID: 28967147 Free PMC article.
-
Single-Step Fast Tissue Clearing of Thick Mouse Brain Tissue for Multi-Dimensional High-Resolution Imaging.Int J Mol Sci. 2022 Jun 19;23(12):6826. doi: 10.3390/ijms23126826. Int J Mol Sci. 2022. PMID: 35743267 Free PMC article.
-
Sodium Cholate-Based Active Delipidation for Rapid and Efficient Clearing and Immunostaining of Deep Biological Samples.Small Methods. 2022 Jan;6(1):e2100943. doi: 10.1002/smtd.202100943. Epub 2021 Nov 5. Small Methods. 2022. PMID: 35041279
-
Optical clearing methods: An overview of the techniques used for the imaging of 3D spheroids.Biotechnol Bioeng. 2019 Oct;116(10):2742-2763. doi: 10.1002/bit.27105. Epub 2019 Jul 21. Biotechnol Bioeng. 2019. PMID: 31282993 Review.
-
Navigating across multi-dimensional space of tissue clearing parameters.Methods Appl Fluoresc. 2021 Mar 11;9(2):022001. doi: 10.1088/2050-6120/abe6fb. Methods Appl Fluoresc. 2021. PMID: 33592593 Review.
Cited by
-
SOLID: minimizing tissue distortion for brain-wide profiling of diverse architectures.Nat Commun. 2024 Sep 27;15(1):8303. doi: 10.1038/s41467-024-52560-7. Nat Commun. 2024. PMID: 39333107 Free PMC article.
-
Comparative Analyses of Clearing Efficacies of Tissue Clearing Protocols by Using a Punching Assisted Clarity Analysis.Front Bioeng Biotechnol. 2022 Jan 28;9:784626. doi: 10.3389/fbioe.2021.784626. eCollection 2021. Front Bioeng Biotechnol. 2022. PMID: 35155401 Free PMC article.
-
Revealing the MRI-Contrast in Optically Cleared Brains.Adv Sci (Weinh). 2024 Jun;11(22):e2400316. doi: 10.1002/advs.202400316. Epub 2024 Apr 22. Adv Sci (Weinh). 2024. PMID: 38647385 Free PMC article.
-
Postoperative Electroacupuncture Boosts Cognitive Function Recovery after Laparotomy in Mice.Biomolecules. 2024 Oct 10;14(10):1274. doi: 10.3390/biom14101274. Biomolecules. 2024. PMID: 39456207 Free PMC article.
-
Datasets assessing lipid-content in optically cleared brains.Data Brief. 2023 Nov 30;52:109795. doi: 10.1016/j.dib.2023.109795. eCollection 2024 Feb. Data Brief. 2023. PMID: 38146303 Free PMC article.
References
-
- Renier N, Wu Z, Simon DJ, Yang J, Ariel P, Tessier‐Lavigne M. IDISCO: A simple, rapid method to immunolabel large tissue samples for volume imaging. Cell. 2014; 159(4): 896–910 - PubMed
-
- Pan C, Cai R, Quacquarelli FP, et al. Shrinkage‐mediated imaging of entire organs and organisms using uDISCO. Nat Methods. 2016; 13(10): 859–867 - PubMed
-
- Murakami TC, Mano T, Saikawa S, et al. A three‐dimensional single‐cell‐resolution whole‐brain atlas using CUBIC‐X expansion microscopy and tissue clearing. Nat Neurosci. 2018; 21(4): 625–637 - PubMed
Publication types
MeSH terms
Substances
LinkOut - more resources
Full Text Sources
Other Literature Sources
Molecular Biology Databases

