. 2020 Oct 10:2020:9786428.
doi: 10.1155/2020/9786428. eCollection 2020.

Anticolorectal Cancer Effects of AUCAN: Effects to Suppress Proliferation, Metastasis, and Invasion of Tumor Cells

Affiliations

Anticolorectal Cancer Effects of AUCAN: Effects to Suppress Proliferation, Metastasis, and Invasion of Tumor Cells

Liu-Lin Xiong et al. Biomed Res Int. .

Abstract

Background: Colorectal cancer (CRC) is an underlying deadly malignancy with poor prognosis, lacking effective therapies currently available to improve the prognosis. C18H17NO6 (AUCAN), a kind of dibenzofuran extracted from a special plant in Yunnan Province (China), is identified as a natural anticancer agent exerting strong inhibitory activities on various cancers. Our study was committed to investigating the potency of AUCAN against colorectal cancers and further exploring the potential mechanisms via proteomic analysis.

Methods: Cell Counting Kit-8 assay and immunofluorescence staining were used to investigate the effect of AUCAN on the viability and proliferation of HCT-116 cells and RKO cells. The apoptosis of HCT-116 and RKO cells after AUCAN administration was determined by the flow cytometry test. The effects of AUCAN on invasion and migration of tumor cells were investigated by the colony formation assay, wound healing test, and Transwell invasion test. Meanwhile, the energy metabolism and growth of tumor tissues after AUCAN administration with 10 mg/kg and 20 mg/kg were examined by PET-CT in vivo. The side effects of AUCAN treatment were also evaluated through blood routine and liver function examination. RKO cell proliferation and apoptosis in vivo were further determined by hematoxylin and eosin staining, TUNEL staining, and immunohistochemistry. Furthermore, the differentially expressed proteins (DEPs) involved in AUCAN treatment were determined by proteomic analysis followed by functional clustering analysis.

Results: The results showed that AUCAN suppressed the migratory abilities and enhanced apoptosis of HCT-116 and RKO cell lines. Meanwhile, AUCAN treatment dramatically depressed the growth and volume of colorectal tumors in nude mice and suppressed the survival of RKO cells in tumor tissues without any side effects on the blood routine and liver function. In addition, twenty-four upregulated and forty-two downregulated proteins were identified. Additionally, functional clustering analysis concealed enriched biological processes, cellular components, molecular functions, and related pathways of these proteins involved in cellular metabolic. Finally, the protein-protein interaction analysis revealed the regulatory connection among these DEPs.

Conclusions: Taken together, AUCAN exerted its significant antitumor effect without side effects in the blood routine and liver function and the underlying mechanisms were preliminarily investigated by proteomic analysis.


Conflict of interest statement

The authors claim no competing financial interests.

Figures
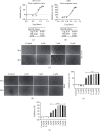
Figure 1
Figure 1
The effects of AUCAN on cell viability of HCT-116 and RKO cells. (a, b) The dose-response curve of IC50 from log(0) to log(1.5) for HCT-116 cells and from log(-1) to log(1.5) for RKO cells, n = 5/group. (c, d) Cell number of HCT-116 and RKO cells following AUCAN treatment in the control and AUCAN groups, respectively, n = 5/group. Scale bar = 50 μm. (e, f) Inhibition rate of different AUCAN concentrations on HCT-116 and RKO cells. All data are shown as the mean ± SD. ∗∗∗P < 0.001. IC50: 50% inhibition concentration; h: hours.
Figure 2
Figure 2
The efficacy of AUCAN treatment on the growth of HCT-116 cells and RKO cells. (a) Immunofluorescent staining of EDU for HCT-116 cells in the control, IC20, and IC50 groups. The nucleus is stained by blue, and EDU-positive cells are stained by red. (b) Immunofluorescent staining of EDU for RKO cells in the control, IC20, and IC50 groups. The nucleus is stained by blue and EDU-positive cells are stained by red. (c) The proliferation rate (EDU/DAPI) comparison of HCT-116 cells in the groups of control, IC20, and IC50. (d) The proliferation rate (EDU/DAPI) comparison of RKO cells in the groups of control, IC20, and IC50. All data are shown as the mean ± SD, n = 5/group. P < 0.05, ∗∗P < 0.01, and ∗∗∗P < 0.001. Scale bar = 100 μm. EDU: 5-ethynyl-2′-deoxyuridine; IC20: 20% inhibition concentration; IC50: 50% inhibition concentration; DAPI: 4′,6-diamidino-2-phenylindole.
Figure 3
Figure 3
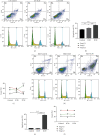
Effects of AUCAN treatment on the apoptosis of CRC cells by flow cytometry analysis. HCT-116 and RKO cells were, respectively, administrated with DMSO (control), AUCAN-IC20, and AUCAN-50 (HCT-116 cells: 8 μM DMSO, 8 μM AUCAN, and 3.2 μM AUCAN; RKO cells: 5 μM DMSO, 2 μM AUCAN, and 5 μM AUCAN). (a) The flow cytometry detection and (b) the apoptosis rate of HCT-116 cells in the control, IC20, and IC50 groups. (c) The cell cycle of HCT-116 cells in the control, IC20, and IC50 groups. P < 0.05 vs. the control group, ∗∗P < 0.01 vs. the control group, and ∗∗∗P < 0.001 vs. the IC20 group. (d) The flow cytometry detection and (e) the apoptosis rate in the indicated groups. (f) The cell cycle of RKO cells in the control, IC20, and IC50 groups. P < 0.05 vs. the IC20 group. All data are shown as the mean ± SD, n = 5/group. P < 0.05, ∗∗P < 0.01, and ∗∗∗P < 0.001. IC20: 20% inhibition concentration; IC50: half inhibition concentration; DMSO: dimethyl sulfoxide; 116: HCT-116 cells.
Figure 4
Figure 4
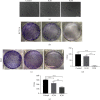
Effects of AUCAN on the survival status of CRC cells by colony formation assay. HCT-116 and RKO cells were, respectively, administrated with DMSO (control), AUCAN-IC20, and AUCAN-IC50 (HCT-116 cells: 8 μM DMSO, 8 μM AUCAN, and 3.2 μM AUCAN; RKO cells: 5 μM DMSO, 2 μM AUCAN, and 5 μM AUCAN). (a) The bright field images of RKO cells in the control, IC50, and IC20 groups. Scale bar = 50 μm. (b, d) The colony formation assay of HCT-116 and (c, e) RKO cell lines after AUCAN administration in the control, IC50, and IC20 groups. IC20: 20% inhibition concentration; IC50: half inhibition concentration; DMSO: dimethyl sulfoxide. All data are shown as the mean ± SD, n = 5/group. ∗∗P < 0.01 and ∗∗∗P < 0.001.
Figure 5
Figure 5
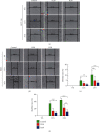
Effects of AUCAN on the metastasis of CRC cells by the wound healing test. HCT-116 and RKO cells were administered with DMSO (control) and AUCAN-IC20 and AUCAN-IC50 (HCT-116 cells: 8 μM DMSO, 8 μM AUCAN, and 3.2 μM AUCAN; RKO cells: 5 μM DMSO, 2 μM AUCAN, and 5 μM AUCAN). The cell migration was measured by wound healing assays in (a) HCT-116 cells and (b) RKO cells at 0 h, 12 h, and 24 h. Scale bar = 100 μm. (c) The quantitative analyses of the migration rate of HCT-116 cells and (d) RKO cells. All data are shown as the mean ± SD, n = 5/group. ∗∗P < 0.01 and ∗∗∗P < 0.001. IC20: 20% inhibition concentration; IC50: half inhibition concentration; h: hours.
Figure 6
Figure 6
Effect of AUCAN on metastasis of HCT-116 and RKO cells in vitro. HCT-116 and RKO cells were, respectively, treated with DMSO (control), IC20, and IC50 of AUCAN (HCT-116 cells: 8 μM DMSO, 8 μM AUCAN, and 3.2 μM AUCAN; RKO cells: 5 μm DMSO, 2 μM AUCAN, and 5 μM AUCAN). The cell migration and invasion in (a) HCT-116 cells and (b) RKO cells were analyzed by Transwell assay. Scale bar = 50 μm. (c, e) The migratory cells per field and (d, f) migration fold change of RKO cells and HCT-116 cells in the control, IC20, and IC50 groups. All data are shown as the mean ± SD, n = 5/group. P < 0.05, ∗∗P < 0.01, and ∗∗∗P < 0.001. IC20: 20% inhibition concentration; IC50: half inhibition concentration.
Figure 7
Figure 7
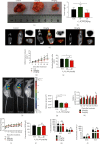
The effect of AUCAN administration on tumor growth in nude mice. The (a) morphology, (b) weight, (c) PET-CT assay, and (e) SUV of tumor in nude mice after administration of DMSO (control) and AUCAN with 10 mg/kg and 20 mg/kg. Scale bar = 1 cm. (d) The relative volume of tumor in nude mice in above groups at 3, 6, 9, 12, 15, and 18 d, respectively. (f, g) The radiance of the tumor in nude mice after the addition of DMSO (control) and AUCAN with 10 mg/kg and 20 mg/kg. (h) The proliferation rate of tumor in nude mice administered with 10 mg/kg and 20 mg/kg AUCAN at 3, 6, 9, 12, 15, and 18 d, respectively. (i) Ponderal growth of nude mice with tumor at 2, 4, 5, 8, 10, 12, 14, 16, 18, 20, and 22 d, respectively. (j) The HGB concentration of tumor and the concentration of (k) AST, ALT, (l) WBC, and PLT in the control and AUCAN with 10 mg/kg and 20 mg/kg groups. All data are shown as the mean ± SD, n = 10/group. P < 0.05 and ∗∗P < 0.01. Con: control; C17H17NO6: AUCAN; d: day; HGB: hemoglobin; ns: no significance; WBC: white blood cell; PLT: platelet; AST: aspartate aminotransferase; ALT: alanine transaminase.
Figure 8
Figure 8
The effects of AUCAN treatment on cell proliferation and cell apoptosis in nude mice in vivo. (a) The HE staining of tumor tissue in nude mice in vivo among the control, 10 mg/kg AUCAN, and 20 mg/kg AUCAN groups. Scale bar = 200 μm. (b) The immunohistochemistry Ki67 in nude mice in vivo among these four groups. Scale bar = 100 μm. (c) The TUNEL staining of tumor tissues in nude mice in vivo among the indicated groups. Apoptotic cells are stained by red, and the nucleus is stained by blue. Scale bar = 100 μm. (d) Ki67+ cell number and (e) TUNEL-positive cell number among the control, 10 mg/kg AUCAN, and 20 mg/kg AUCAN groups. All data are shown as the mean ± SD, n = 10/group. P < 0.05 the AUCAN 10 mg/kg group vs. the control group, #P < 0.05 the AUCAN 20 mg/kg vs. the control group, and &P <0.05 the AUCAN 20 mg/kg group vs. the AUCAN 10 mg/kg group. Con: control; C17H17NO6: AUCAN; HE: hematoxylin and eosin staining; DAPI: 4',6-diamidino-2-phenylindole; TUNEL: terminal deoxynucleotidyl transferase dUTP-biotin nick end labeling assay.
Figure 9
Figure 9
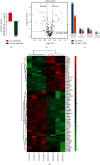
Screening of DEPs. (a) Identification of up- and downregulated proteins. (b) DEPs were exhibited by volcano plot. Fold change > 1.2 or <5/6 and P < 0.05 is considered to be significantly differentially expressed. Red indicates upregulated proteins, green for downregulated ones, and black for proteins without differential expression. (c) Enrichment analysis of biological functions of DEPs. (d) Heat maps of identified proteins in the control and AUCAN groups. All data are shown as the mean ± SD, n = 4/group. DEPs: differentially expressed proteins.
Figure 10
Figure 10
GO and pathway enrichment analysis of DEPs. (a, b) GO analysis and KEGG analysis of DEPs. (b) Protein-protein interaction networks of DEPs. Rich factor represents the ratio of DEP number annotated in this pathway term to all protein number annotated in this pathway term. Red dot indicates upregulated protein, and green for downregulated one. Biological processes, cellular localization, molecular functions, or signaling pathways were presented by rectangles. Blue indicates higher P value while yellow for lower. Solid lines represent interrelated protein (genes)-proteins (genes), and dashed lines represent interrelated metabolic pathways-proteins (genes). All data are shown as the mean ± SD. GO: Gene Ontology; KEGG: Kyoto Encyclopedia of Genes and Genomes pathway analysis.

Similar articles

Cited by

References

    1. Torre L. A., Bray F., Siegel R. L., Ferlay J., Lortet-Tieulent J., Jemal A. Global cancer statistics, 2012. CA: A Cancer Journal for Clinicians. 2015;65(2):87–108. doi: 10.3322/caac.21262. - DOI - PubMed
    1. US Preventive Services Task Force, Bibbins-Domingo K., Grossman D. C., et al. Screening for colorectal Cancer. JAMA. 2016;315(23):2564–2575. doi: 10.1001/jama.2016.5989. - DOI - PubMed
    1. Haggar F. A., Boushey R. P. Colorectal cancer epidemiology: incidence, mortality, survival, and risk factors. Clinics in Colon and Rectal Surgery. 2009;22(4):191–197. doi: 10.1055/s-0029-1242458. - DOI - PMC - PubMed
    1. Edwards B. K., Ward E., Kohler B. A., et al. Annual report to the nation on the status of cancer, 1975-2006, featuring colorectal cancer trends and impact of interventions (risk factors, screening, and treatment) to reduce future rates. Cancer. 2010;116(3):544–573. doi: 10.1002/cncr.24760. - DOI - PMC - PubMed
    1. Stein A., Atanackovic D., Bokemeyer C. Current standards and new trends in the primary treatment of colorectal cancer. European Journal of Cancer. 2011;47(3):S312–S314. doi: 10.1016/S0959-8049(11)70183-6. - DOI - PubMed

MeSH terms