. 2020 Sep 7;7(20):2001675.
doi: 10.1002/advs.202001675. eCollection 2020 Oct.

Radiation Dose-Enhancement Is a Potent Radiotherapeutic Effect of Rare-Earth Composite Nanoscintillators in Preclinical Models of Glioblastoma

Affiliations

Radiation Dose-Enhancement Is a Potent Radiotherapeutic Effect of Rare-Earth Composite Nanoscintillators in Preclinical Models of Glioblastoma

Anne-Laure Bulin et al. Adv Sci (Weinh). .

Abstract

To improve the prognosis of glioblastoma, innovative radiotherapy regimens are required to augment the effect of tolerable radiation doses while sparing surrounding tissues. In this context, nanoscintillators are emerging radiotherapeutics that down-convert X-rays into photons with energies ranging from UV to near-infrared. During radiotherapy, these scintillating properties amplify radiation-induced damage by UV-C emission or photodynamic effects. Additionally, nanoscintillators that contain high-Z elements are likely to induce another, currently unexplored effect: radiation dose-enhancement. This phenomenon stems from a higher photoelectric absorption of orthovoltage X-rays by high-Z elements compared to tissues, resulting in increased production of tissue-damaging photo- and Auger electrons. In this study, Geant4 simulations reveal that rare-earth composite LaF3:Ce nanoscintillators effectively generate photo- and Auger-electrons upon orthovoltage X-rays. 3D spatially resolved X-ray fluorescence microtomography shows that LaF3:Ce highly concentrates in microtumors and enhances radiotherapy in an X-ray energy-dependent manner. In an aggressive syngeneic model of orthotopic glioblastoma, intracerebral injection of LaF3:Ce is well tolerated and achieves complete tumor remission in 15% of the subjects receiving monochromatic synchrotron radiotherapy. This study provides unequivocal evidence for radiation dose-enhancement by nanoscintillators, eliciting a prominent radiotherapeutic effect. Altogether, nanoscintillators have invaluable properties for enhancing the focal damage of radiotherapy in glioblastoma and other radioresistant cancers.

Keywords: X‐ray‐induced photodynamic therapy; glioblastoma; nanoscintillators; radiation dose‐enhancement; synchrotron radiation.


Conflict of interest statement

The authors declare no conflict of interest.

Figures

Figure 1
Figure 1
Synthesis and characterization of the LaF3:Ce nanoparticles. A) Schematic representation of the chemistry synthesis. B) X‐ray diffractogram of the La0.9Ce0.1F3 nanoparticles – the crystallization phase is identified as being the trigonal tysonite LaF3 structure (JCPDS 32‐0483). C) Fourier transform infrared spectroscopy spectra of the LaF3:Ce nanoparticles (blue) and the triphosphate‐coated LaF3:Ce nanoparticles (LaF3:Ce@TPP, red). The attenuated total reflectance (ATR) is plotted as a function of the wavenumber. D) Dynamic light scattering quantifying the hydrodynamic radius of the functionalized nanoparticles. Polydispersity index = 0.12. E) TEM image of the well‐dispersed and well‐crystallized LaF3:Ce nanoparticles. Scale bar = 50 nm. Insert: High resolution TEM image. Scale bar = 10 nm. F) Photoluminescence spectrum of LaF3:Ce nanoparticles measured with λ exc = 214 nm. G) Radioluminescence spectrum (30 mA, 33 kV). The peak indexed as 1 corresponds to the transition 2D3/2 standard2F5/2, the peak indexed as 2 corresponds to 2D3/2 standard2F7/2 and the peak indexed as 3 corresponds to 2D3/2 perturbed2Fx /2.
Figure 2
Figure 2
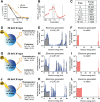
In silico simulations of the interactions between orthovoltage X‐ray photons and LaF3:Ce. A) Mass energy absorption coefficients as a function of the X‐ray energy for LaF3:Ce and soft tissues. Data obtained from.[ 53 ] B) Ratio between the mass energy‐absorption coefficient of LaF3:Ce and soft tissues. Dashed lines are plotted as eye‐guidance at 30 keV, 50 keV, 80 keV and 6 MeV. C) Energies of the K‐, L‐, and M‐edges for the La. D–L) Simulations of interactions between X‐ray photons and LaF3:Ce or water. Panels (D), (E), and (F) are obtained for 30 keV X‐rays, panels (G–I) for 50 keV photons, and panels (J–L) for 80 keV photons. For each X‐ray energy, the percentage of interactions occurring through photoelectric or Compton effects are indicated in panels (D), (G), and (J). (E,F), (H,I), and (K,L) Spectra of Compton, Auger and photo electrons generated after the interaction between an X‐ray photon and LaF3:Ce (E,H, and K) or water (F,I, and L).
Figure 3
Figure 3
LaF3:Ce strongly accumulate and distribute well within F98 models of glioblastoma at non‐toxic concentration. A) Viability heatmaps of F98 spheroids subjected to increasing concentration of LaF3:Ce nanoscintillators for 24 h. White pixels indicate a maximal viability, whereas black pixels depict minimal viability. Scale bar = 500 µm. B) Viability of F98 spheroids measured after 24 h of incubation with increasing concentrations of LaF3:Ce. Data represents average ± standard errors, N = 7–25 spheroids/group from two technical repeats. C) Normalized viability plotted as a function of the spheroid area for selected LaF3:Ce concentrations. Each data point represents a single spheroid. D) Quantification of the amount of Zn (physiological element present in the cells) and La contained in the spheroids by analyses of the images acquired by X‐ray fluorescence microtomography. Data represents mean ± standard deviation. E‐H) Images acquired using X‐ray fluorescence microtomography of a spheroid containing no nanoparticle (E,F) and of a spheroid that was exposed to 0.1 mg mL−1 LaF3:Ce for 24 h. E,G) Zn concentration. F,H) La concentration. The x, y, and z axis are expressed in µm.
Figure 4
Figure 4
LaF3:Ce nanoscintillators induce a radiation dose‐enhancement effect in vitro on F98 spheroids. A,B) Confocal fluorescence microscopy images of F98 spheroids taken on culture day 10, that is, 7 days following radiotherapy delivered in absence of nanoscintillators (A), or after a 24 h incubation with 0.1 mg mL−1 LaF3:Ce (B). Representative brightfield and propidium iodide emission (necrosis) images of each treatment conditions are shown. Scale bar  =  100 µm. C) Logistic growth curves of F98 spheroids treated with synchrotron radiation therapy (no nanoparticle) at 50 keV with a dose of 0 Gy (black), 2 Gy (purple), 4 Gy (pink), or 8 Gy (red). D) Radiotherapy dose‐response fitted as a function of spheroid necrosis. Data was normalized to the 0 Gy controls of each group, and fitted with linear regression. The slope was significantly different (p = 0.036). At each dose, the data from both groups was statistically different compared with a one‐way ANOVA and Sidak's multiple comparisons test. E) Analysis of spheroid necrosis following radiotherapy at photon energies of either 30, 50, or 80 keV. Data was pooled from various time‐points, and plotted as a fold‐change compared to the “No nano” control groups subjected to the same radiotherapy dose. Data was statistically analyzed with a with a one‐way ANOVA and Sidak's multiple comparisons test. In all panels, statistical significance is indicated as “*”(p < 0.05), “**”(p < 0.01), “***”(p < 0.005), or “****”(p < 0.001).
Figure 5
Figure 5
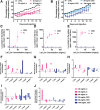
Toxicology investigation indicates that 35 and 50 mg mL−1 of LaF3:Ce can safely be injected by intravenous (iv) and CED, respectively. A,B) Growth curves of the animals that received LaF3:Ce nanoparticles by iv and CED injections, respectively. C–E) Concentration of La measured in the kidney, liver, and spleen, respectively, for increasing concentrations of LaF3:Ce injected by iv (pink) and CED (blue). Data represents mean ± standard deviation, N = three/groups. F–J) Concentration of aspartate transaminase (ASAT), alanine transaminase (ALAT), urea, creatinine, and creatine kinase, normalized on the values obtained for the control group, measured after LaF3:Ce injection by iv (pink) and CED (blue). The data show a bar ranging from the lowest to the highest value, N = 3 animals/group.
Figure 6
Figure 6
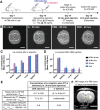
30 min is an optimal injection‐to‐irradiation delay. A) Experiment timeline: on day 1, F98 cells are implanted in Fischer rats. Fourteen days post‐implantation, the nanoparticles are injected by intravenous (iv) or CED. 30 min or 24 h after injection, animals are euthanized and their organs are collected for inductively coupled plasma mass spectrometry (ICP‐MS) analysis. In addition, computed tomography (CT) images are acquired 30 min and about 24 h post‐injection. B) Representative CT images of a control animal (no nanoparticles), as well as three animals that received an iv injection 30 min earlier, or a CED injection 30 min or 22 h earlier. Scale bar = 10 mm. C,D) La measured in each organ after iv (C), or CED injection (D). The caption is identical for both graphs. The data shows mean ± standard deviation. N = 4/group. LoD: limit of detection of the ICP‐MS system. E) La measured in the brain 30 min post‐injection by ICP‐MS and CT. The La concentration in the tumor was extrapolated from the ICP‐MS measurements (whole brain) and estimated at 6.8 mg mL−1 after CED, comparable to the value of 7.5 mg mL−1 measured by CT imaging. A similar extrapolation indicated a concentration 0.2 mg mL−1 La in the tumor 30 min post iv injection. F) Representative T2‐sequence magnetic resonance imaging (MRI) image of a rat bearing a F98‐tumor 12 days after tumor inoculation. Scale bar = 5 mm. Tumor tissue is delineated with a yellow dashed line.
Figure 7
Figure 7
Radiation dose‐enhancement by LaF3:Ce leads to a full recovery of 15% of the animals bearing a F98‐brain tumor. A) Survival curve obtained after treatment when LaF3:Ce nanoparticles are delivered by CED (20 µL of 50 mg mL−1). B) Growth curve of the animals, presented as a percentage of change compared to the mass of the animal on the day of tumor implantation. The two long‐term survivors were euthanized on day 129 (115 days after treatment), although they were showing no clinical signs of pathology. C) Correlation between the survival and the volume of tumor not overlapped by the distribution of nanoparticles. The two long‐term survivors do not appear on this graph as they were euthanized without clinical signs. D–G) Hematoxylin and eosin (H&E) staining of brain slices collected after euthanasia of a representative animal from the control group (D), the group receiving a CED injection only (E), the group receiving only the irradiation (F) and the group receiving the CED injection and the irradiation (G). For this last group, we chose an animal that died early (34 days post tumor inoculation). Scale bar = 1 mm. H) H&E staining of a slice of the brain of one of the two long‐term survivors. Scale bar = 1 mm. I) LIBS image of a consecutive slice of the brain of a long‐term survivor. LaF3:Ce nanoparticles are still visible in the brain 129 days post tumor implantation. Scale bar = 1 mm. J) La measured by ICP‐MS contained in the kidney, liver, and spleen of animals euthanized 30 min and 24 h post‐injection (data shown in Figure 6), together with the results obtained for the two long‐term survivor animals. 129 days post implantation (115 days after treatment), no signal was detected in any of these organs, hinting to a total elimination of the La present in the rest of the organism.

Similar articles

Cited by

References

    1. Stupp R., Mason W. P., van den Bent M. J., Weller M., Fisher B., Taphoorn M. J. B., Belanger K., Brandes A. A., Marosi C., Bogdahn U., Curschmann J., Janzer R. C., Ludwin S. K., Gorlia T., Allgeier A., Lacombe D., Cairncross J. G., Eisenhauer E., Mirimanoff R. O., N. Engl. J. Med. 2005, 352, 987. - PubMed
    1. Mann J., Ramakrishna R., Magge R., Wernicke A. G., Front. Neurol. 2017, 8, 748. - PMC - PubMed
    1. Kagan A. R., Steckel R. J., Cancilla P., Juillard G., Patin T., Int. J. Radiat. Oncol., Biol., Phys. 1976, 1, 729. - PubMed
    1. Dujardin C., Auffray E., Bourret‐Courchesne E., Dorenbos P., Lecoq P., Nikl M., Vasil'ev A. N., Yoshikawa A., Zhu R., IEEE Trans. Nucl. Sci. 2018, 65, 1977.
    1. Chen X., Song J., Chen X., Yang H., Chem. Soc. Rev. 2019, 48, 3073. - PubMed

LinkOut - more resources