. 2020 Nov 10;117(45):28344-28354.
doi: 10.1073/pnas.2016650117. Epub 2020 Oct 23.

SARS-CoV-2 Orf6 hijacks Nup98 to block STAT nuclear import and antagonize interferon signaling

Affiliations

SARS-CoV-2 Orf6 hijacks Nup98 to block STAT nuclear import and antagonize interferon signaling

Lisa Miorin et al. Proc Natl Acad Sci U S A. .

Abstract

Severe acute respiratory syndrome coronavirus 2 (SARS-CoV-2) is the causative agent of the ongoing coronavirus disease 2019 (COVID-19) pandemic that is a serious global health problem. Evasion of IFN-mediated antiviral signaling is a common defense strategy that pathogenic viruses use to replicate and propagate in their host. In this study, we show that SARS-CoV-2 is able to efficiently block STAT1 and STAT2 nuclear translocation in order to impair transcriptional induction of IFN-stimulated genes (ISGs). Our results demonstrate that the viral accessory protein Orf6 exerts this anti-IFN activity. We found that SARS-CoV-2 Orf6 localizes at the nuclear pore complex (NPC) and directly interacts with Nup98-Rae1 via its C-terminal domain to impair docking of cargo-receptor (karyopherin/importin) complex and disrupt nuclear import. In addition, we show that a methionine-to-arginine substitution at residue 58 impairs Orf6 binding to the Nup98-Rae1 complex and abolishes its IFN antagonistic function. All together our data unravel a mechanism of viral antagonism in which a virus hijacks the Nup98-Rae1 complex to overcome the antiviral action of IFN.

Keywords: Nup98; ORF6; SARS-CoV-2; STATs; interferon signaling antagonism.


Conflict of interest statement

The authors declare no competing interest.

Figures
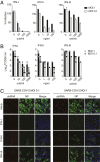
Fig. 1.
Fig. 1.
SARS-CoV-2 is sensitive to IFN pretreatment. (A) Vero E6 cells were treated for 16 h with the indicated concentrations of IFN-I, IFN-II, or IFN-III followed by infection with SARS-CoV-2 at the indicated MOI. After 24 of infection, cells were fixed and immunostained using antibodies against NP with a DAPI counterstain. The percentage of infected cells was calculated as the ratio of NP-positive versus total cells using a Celigo imaging cytometer. Data are represented as average ± SD (n = 3). (B) Supernatants from A were collected and used to assess changes in viral titers by TCID50 assay. Data are represented as average ± SEM (n = 3). (C) Confocal microscopy images of Vero E6 cells pretreated for 16 h with IFN-I (1,000 U/mL), IFN-II (100 ng/mL), or IFN-III (1,000 U/mL), and subsequently infected with SARS-CoV-2 at the indicated MOI. At 24 h postinfection, cells were stained with antibodies against NP or against the dsRNA intermediate of replication. (Scale bars, 20 µm.)
Fig. 2.
Fig. 2.
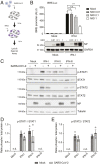
SARS-CoV-2 infection blocks IFN signaling downstream of STAT phosphorylation. (A) Schematic of the experimental setup. (B) hACE2-293T-ISRE-GF cells were seeded in 96-well format and infected with SARS-CoV-2 at the indicated MOI. After 24 h of infection, cells were stimulated with IFN-I (100 U/mL) for 16 h and then lysed to measure luciferase activity. Data are represented as average ± SD (n = 3). Significance was determined by unpaired two-tailed t test: P > 0.05 = n.s.; P < 0.001 = ***. ALU, absolute light unit. Cell lysates from the reporter assay were analyzed by Western blot to show NP expression. GAPDH was used as loading control. (C) Vero E6 cells were infected with SARS-CoV-2 at MOI 2 for 24 h and then treated with either IFN-I (1,000 U/mL), IFN-II (100 ng/mL), or IFN-III (1,000 U/mL) for 45 min. Expression of the indicated protein was determined by Western blot using tubulin as a loading control. (D and E) Western blot signals for phosphorylated STAT1 (D) and STAT2 (E) were quantified and compared to the corresponding total STAT1/STAT2 levels. Graphs show the mean p-STAT/STAT ratio and SEM from at least three independent experiments. n.d., not detected.
Fig. 3.
Fig. 3.
SARS-CoV-2 infection prevents nuclear translocation of STAT1 and STAT2. (A and B) Vero E6 cells were mock infected or infected with SARS-CoV-2 at an MOI of 2. At 24 h postinfection, cells were either mock treated or treated with IFN-I (1,000 U/mL) for 45 min. The subcellular localization of the indicated protein was analyzed by confocal microscopy. Nuclei were stained with DAPI. STAT nuclear translocation in infected and bystander cells was quantified from ≥200 cells per condition from two biological replicates and compared to translocation in mock-infected cells. Data are shown as average ± SEM. Significance was determined by unpaired two-tailed t test: P > 0.05 = n.s.; P < 0.0001 = ****. (C and D) Vero E6 cells were infected as described in A and then stimulated with IFN-II (100 ng/mL). The subcellular localization of the indicated protein was analyzed by confocal microscopy and quantified as described in A. Nuclei were stained with DAPI. White arrows show STAT translocation in bystander cells. (Scale bars, 20 µm.) n.d., not detected.
Fig. 4.
Fig. 4.
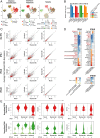
scRNA-Seq of SARS-CoV-2 infected, uninfected, and bystander cells. (A) Uniform manifold approximation and projection (UMAP) plots of Vero E6 cells treated with IFN-I, IFN-II, and IFN-III in the presence or absence of SARS-CoV-2. Points are colored by infection status as classified by SARS-CoV-2 sgmRNA expression (Left), IFN treatment (Center), or sample of origin (Right). (B) Median total number of transcript UMIs per cell derived from SARS-CoV-2 or from host genes by infection status and IFN condition. (C) Scatterplots of average normalized gene expression for all expressed genes in indicated conditions. Each row compares infected, mock, or bystander cells within an IFN condition. Red points indicate ISGs from all IFN treatments (Top) or from corresponding IFN treatment (IFN-I, IFN-II, or IFN-III, respectively, from the second row). Normalized expression values were calculated from downsampled transcript count data (to mitigate the effects of different host gene detection rates due to infection status, see Materials and Methods). (D) Genes with significant differential induction (IFN-I, IFN-II, or IFN-III stimulated versus unstimulated) between infection status groups (mock, bystander, and infected). *Gene ID ENSCSAG00000010250 and ENSCSAG00000019310 are labeled HSP90AA1 and HSPA1A, respectively, based on National Center for Biotechnology Information (NCBI)/Ensembl annotations. (E) Normalized expression (downsampled transcript counts) for several ISGs with significant differences in induction between infection status groups.
Fig. 5.
Fig. 5.
SARS-CoV-2 Orf6 inhibits IFN signaling by preventing nuclear translocation of STAT1 and STAT2. (A) HEK293T cells were transiently transfected with plasmids expressing the indicated viral proteins (0.5 ng, 2 ng, 5 ng, or 10 ng), a plasmid encoding an ISRE-firefly luciferase reporter, and plasmid expressing Renilla luciferase from the TK promoter. At 24 h posttransfection, cells were treated with IFN-I (1,000 U/mL) for 16 h prior to measuring luciferase activities. Data are representative of three independent experiments and shown as average ± SD (n = 3). Significance was determined by unpaired two-tailed t test: P < 0.001 = ***; P < 0.0001 = ****. Cell lysates from the reporter assay were analyzed by Western blot to show relative expression of each transfected viral protein. Tubulin was used as loading control. (B) Confocal microscopy images of HEK293T cells ectopically expressing SARS-CoV (SARS1) or SARS-CoV-2 (SARS2) Orf6 along with STAT1-GFP and STAT2-RFP. At 24 h posttransfection, cells were mock stimulated or stimulated for 45 min with IFN-I (1,000 U/mL) to monitor STAT1 and STAT2 subcellular localization. (C) Quantification of nuclear translocation of ectopically expressed STAT1 and STAT2 in control and Orf6-positive cells from four fields of view collected from two independent experiments. Data are shown as average ± SEM. Significance was determined by unpaired two-tailed t test: P < 0.0001 = ****. (D and E) Confocal microscopy images of IFN-I-treated Vero E6 cells ectopically expressing SARS-CoV-2 (D) or SARS-CoV (E) Orf6-HA. The subcellular localization of endogenous STAT2 and phosphorylated STAT1 (pSTAT1) is shown. (Scale bars, 20 µm.)
Fig. 6.
Fig. 6.
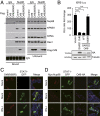
SARS-CoV-2 Orf6 directly interacts with Nup98-Rae1. (A) HEK293T cells were transfected for 24 h with Flag-Orf6, Flag-Orf6M58R, or vector control. Cell lysates were subjected to IP using anti-Flag antibody and followed by immunoblot (IB) with antibodies against the depicted proteins. (B) EMSA was carried out with 0.05 µM FITC-labeled Orf6 (–61) and increasing concentrations of purified Rae1•Nup98(157-213) complex as indicated. (C) HEK293T cells were transfected with Flag-Orf6 and costained with anti-Flag and anti-Nup98 antibodies. Representative images from a z-stack obtained using STED microscopy imaging are shown. (D) HEK293T cells were transfected with Flag-Orf6 or Flag-Orf6M58R and costained with anti-Flag and anti-Nup358 antibodies. The optical sections containing a flat surface of the nuclear envelope (the bottom of the nucleus) are presented. The regions indicated by the white rectangles are magnified and shown at Right. (Scale bars in the full field and the magnified images, 5 μm and 1 μm, respectively.) (E) The distance from each Flag-Orf6 or Flag-Orf6M58R spot to the nearest NPC spot was calculated, and the distribution of the measured distances is presented as a histogram with a bin width of 20 nm. The y axis represents the frequency relative to the total number of the distance measurements. Flag-Orf6 n = 22 nuclei; Flag-Orf6M58R n = 21 nuclei.
Fig. 7.
Fig. 7.
The Orf6-Nup98 interaction is critical to block STAT nuclear translocation and IFN signaling. (A) HEK293T cells were transfected for 24 h with Flag-Orf6, Flag-Orf6M58R, or vector control. Cell lysates were subjected to IP using anti-Nup98 antibody, or an isotype control (IgG), and followed by immunoblot with the antibodies indicated in the figure. (B) HEK293T cells were transiently transfected with plasmids expressing the indicated viral proteins, a plasmid encoding an ISRE-firefly luciferase reporter, and plasmid expressing Renilla luciferase from the TK promoter. At 24 h posttransfection, cells were treated with IFN-I (1,000 U/mL) for 16 h prior to measuring luciferase activities. Data are representative of three independent experiments and shown as average ± SD (n = 3). Significance was determined by unpaired two-tailed t test. P > 0.05 = n.s. ; P < 0.0001 = ****. Cell lysates from the reporter assay were analyzed by Western blot to show relative expression of each transfected viral protein. Tubulin was used as loading control. (C) Confocal microscopy images of HEK293T cells ectopically expressing SARS-CoV-2 Orf6M58R-HA along with STAT1-GFP. Cells were either mock stimulated or stimulated for 45 min with IFN-I (1,000 U/mL) prior to fixation in order to assess nuclear translocation of STAT1-GFP. (D) Confocal microscopy images of HEK293T cells ectopically expressing SARS-CoV-2 Orf6-HA along with Myc-Nup98 and STAT1-GFP. Cells were either mock stimulated or stimulated for 45 min with IFN-I (1,000 U/mL) prior to fixation in order to assess nuclear translocation of STAT1-GFP. (Scale bars, 20 µm.)

Similar articles

Cited by

References

    1. Lu R., et al. , Genomic characterisation and epidemiology of 2019 novel coronavirus: Implications for virus origins and receptor binding. Lancet 395, 565–574 (2020). - PMC - PubMed
    1. Coronaviridae Study Group of the International Committee on Taxonomy of Viruses , The species severe acute respiratory syndrome-related coronavirus: Classifying 2019-nCoV and naming it SARS-CoV-2. Nat. Microbiol. 5, 536–544 (2020). - PMC - PubMed
    1. Zhou P., et al. , A pneumonia outbreak associated with a new coronavirus of probable bat origin. Nature 579, 270–273 (2020). - PMC - PubMed
    1. Xu Z., et al. , Pathological findings of COVID-19 associated with acute respiratory distress syndrome. Lancet Respir. Med. 8, 420–422 (2020). - PMC - PubMed
    1. Blanco-Melo D., et al. , Imbalanced host response to SARS-CoV-2 drives Development of COVID-19. Cell 181, 1036–1045.e9 (2020). - PMC - PubMed

Publication types

MeSH terms