. 2020 Oct 21;12(566):eaay7856.
doi: 10.1126/scitranslmed.aay7856.

Down-regulation of Beclin1 promotes direct cardiac reprogramming

Affiliations

Down-regulation of Beclin1 promotes direct cardiac reprogramming

Li Wang et al. Sci Transl Med. .

Abstract

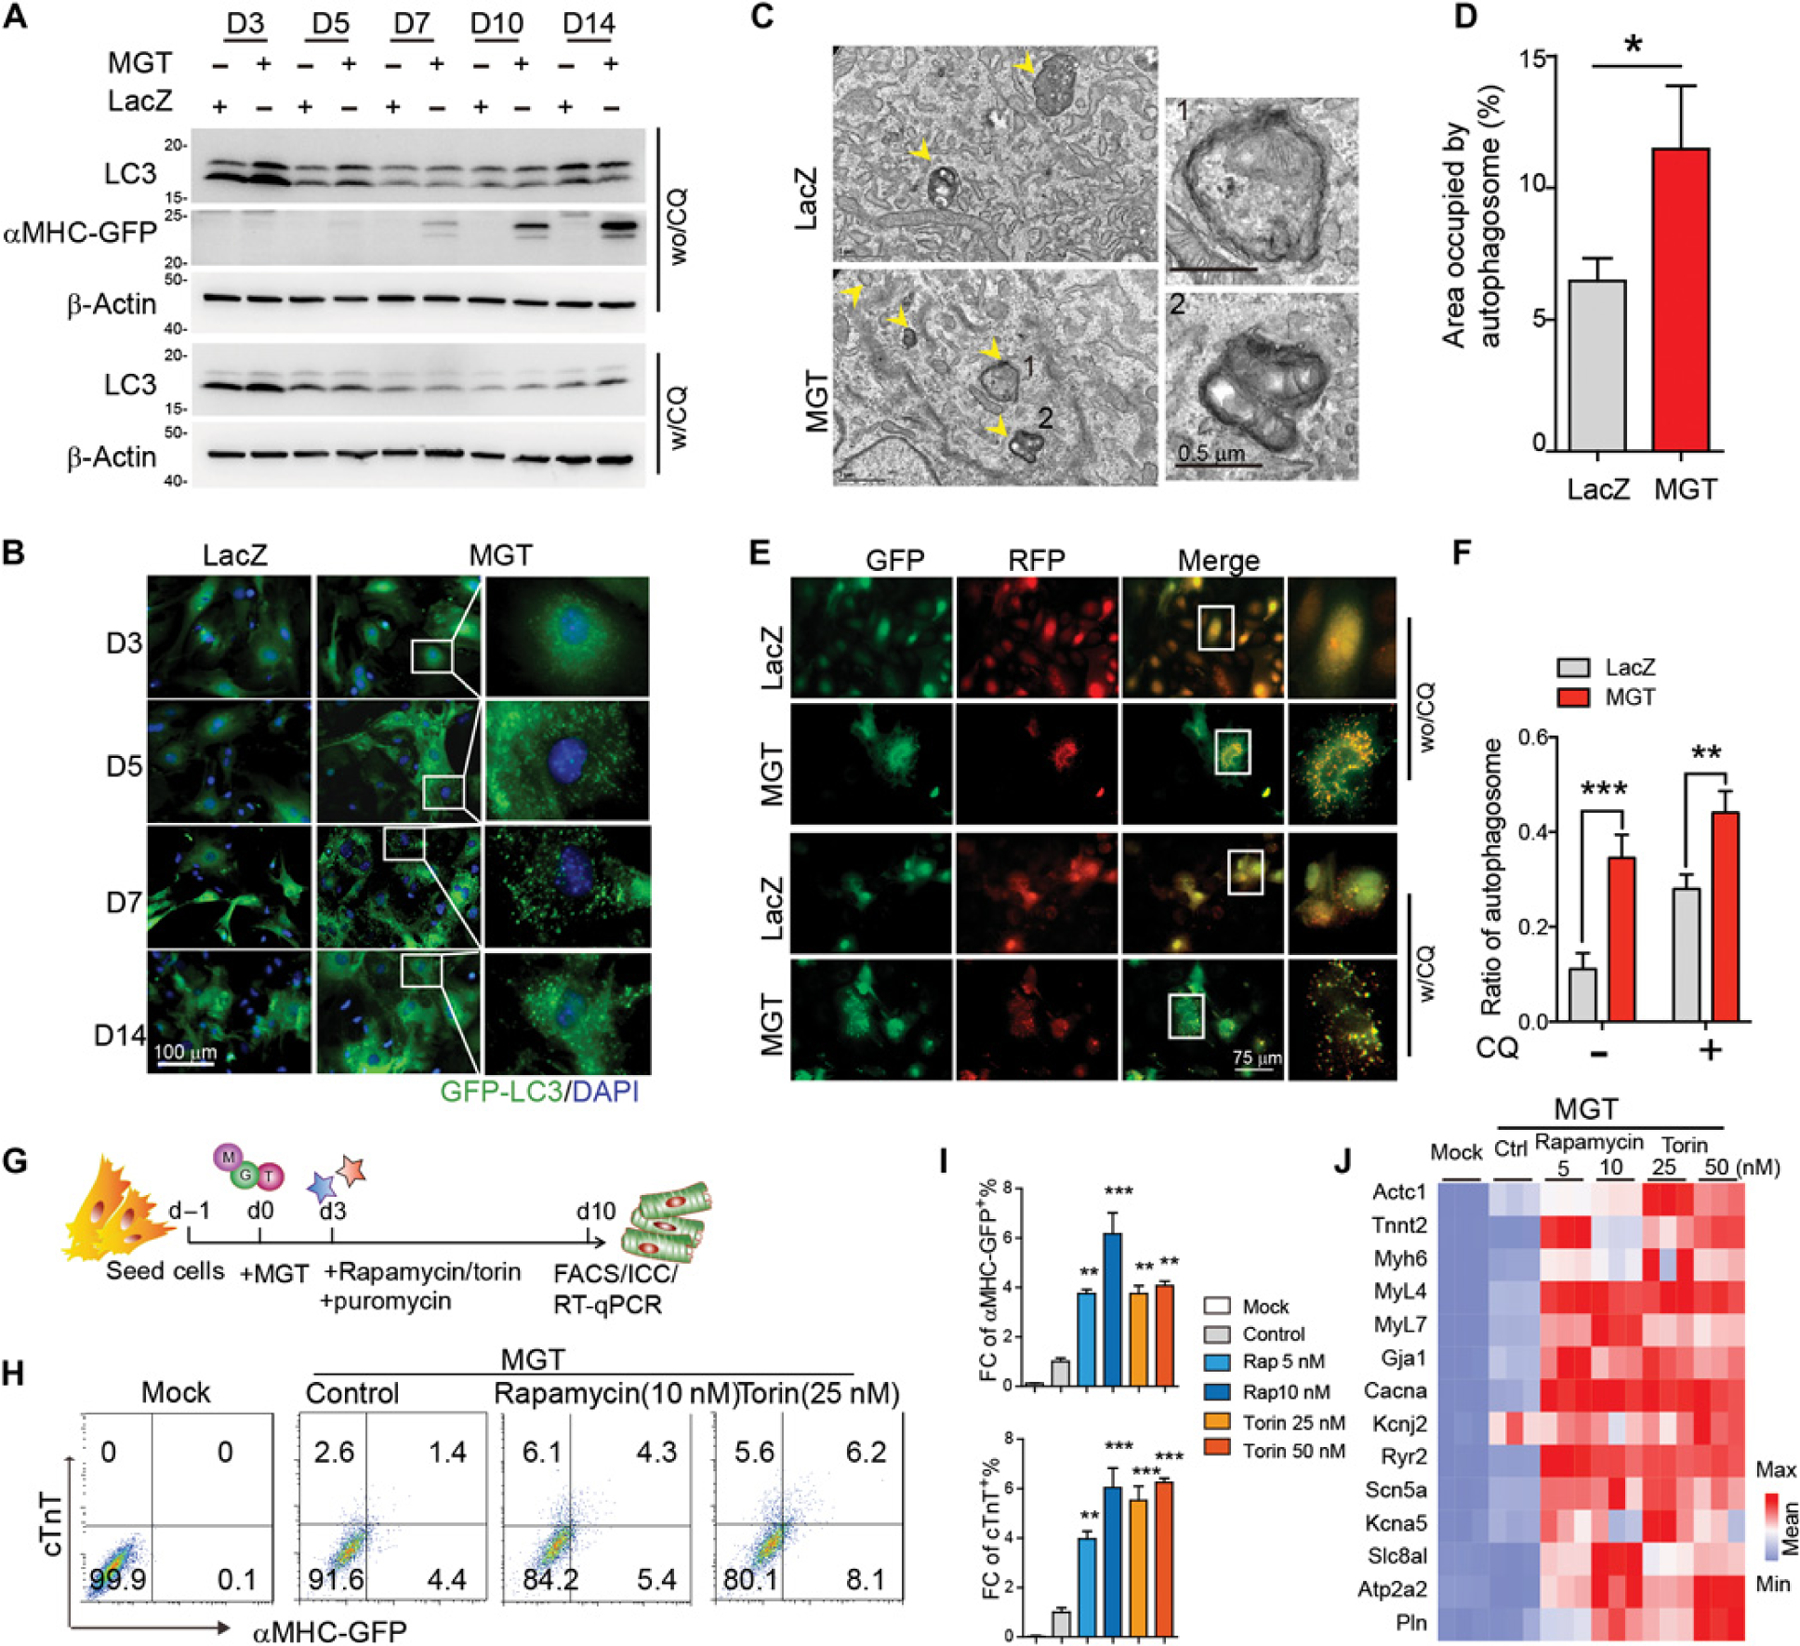
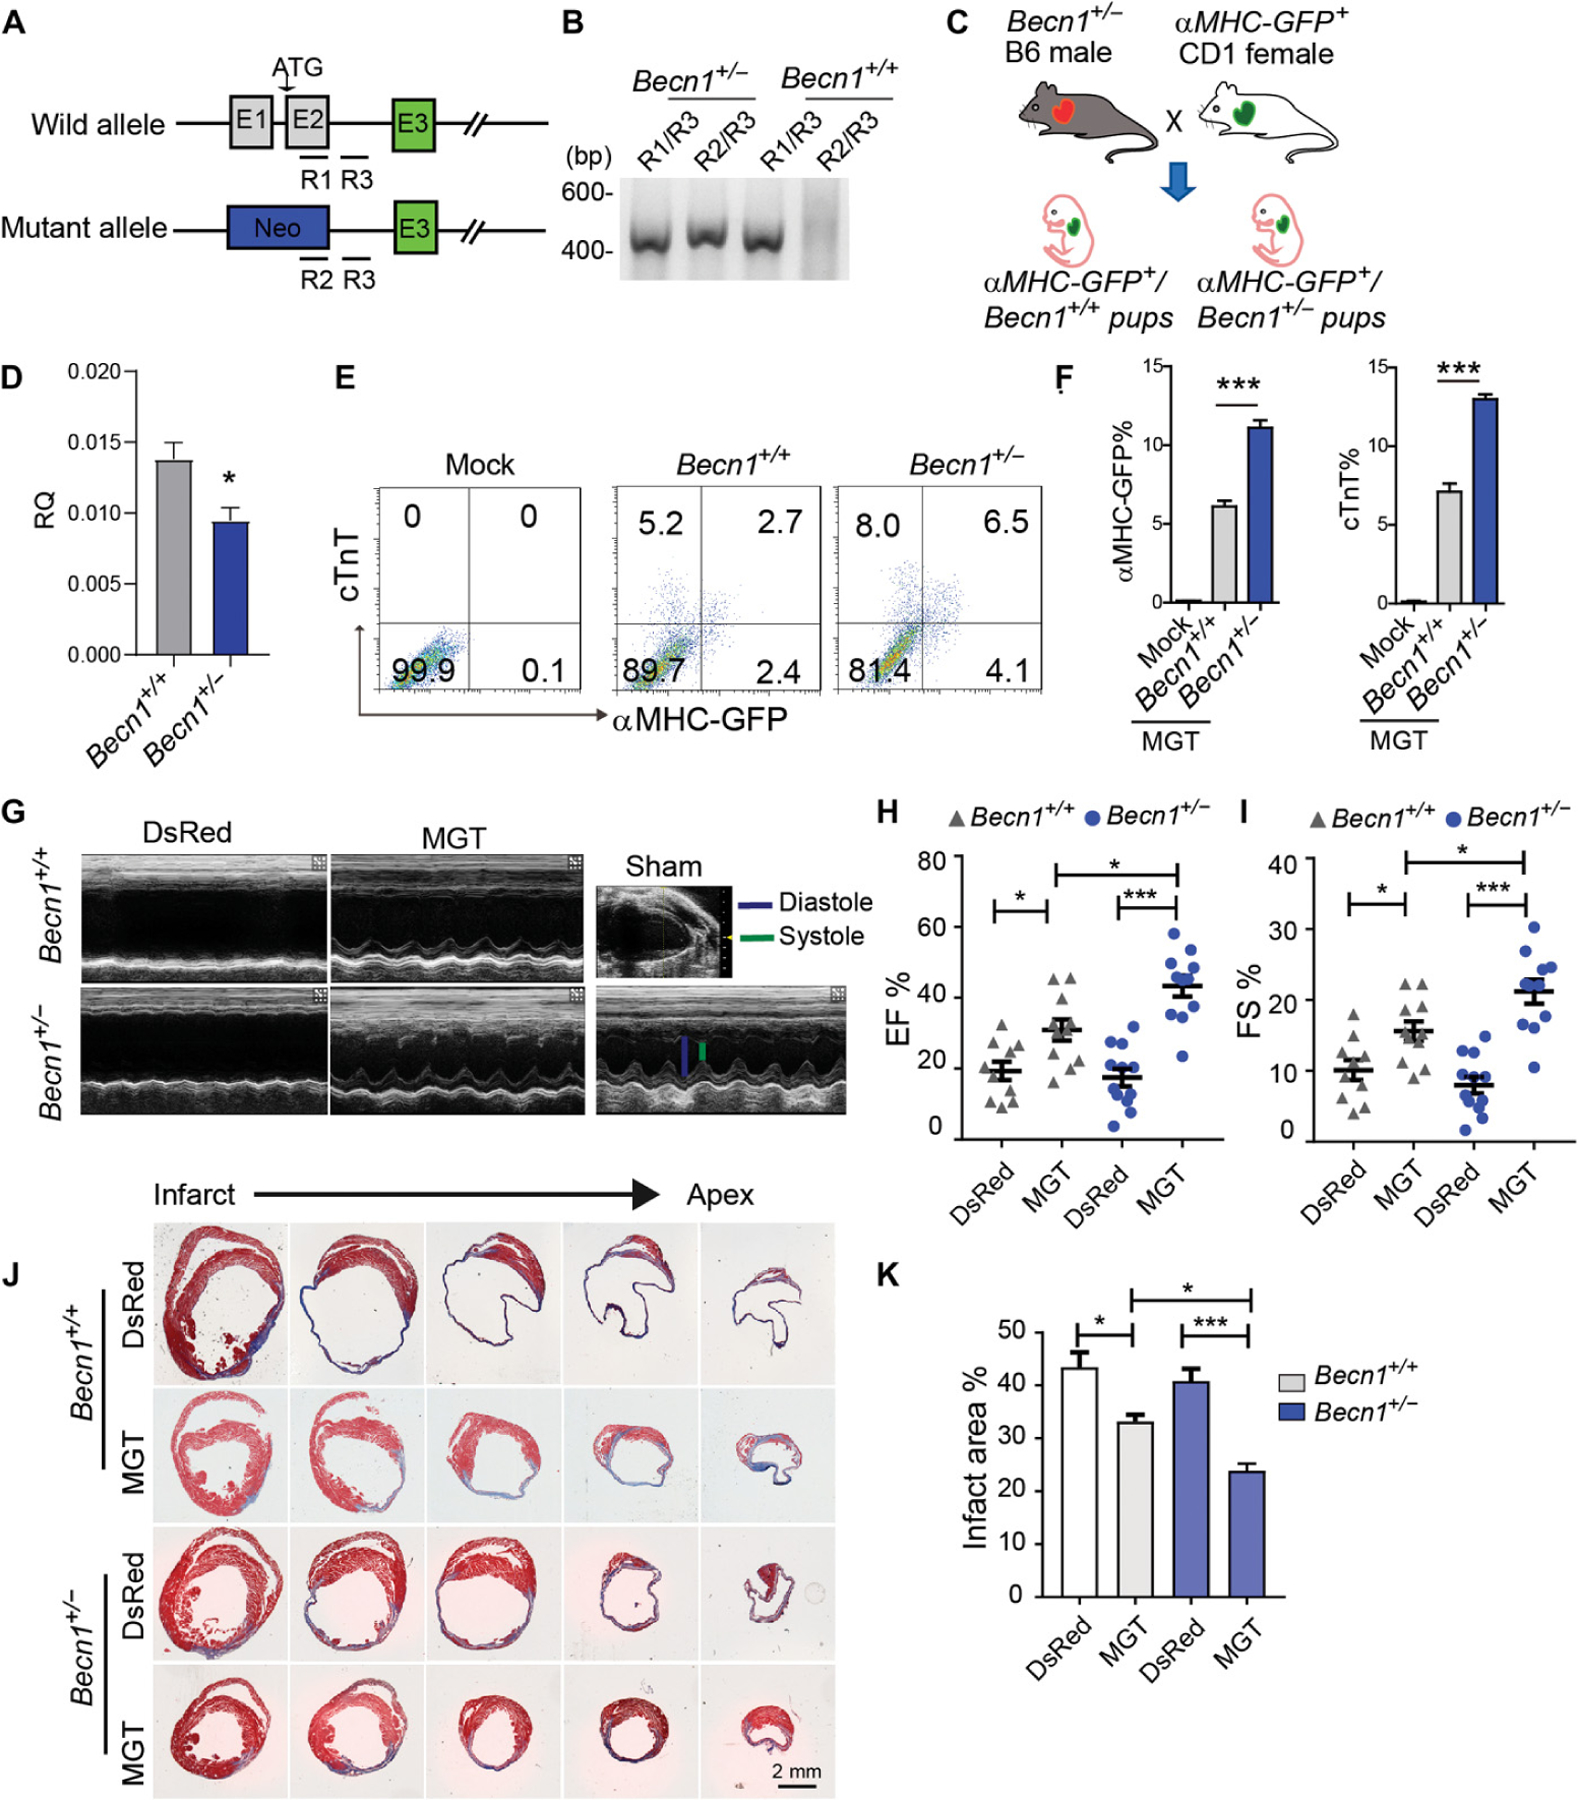
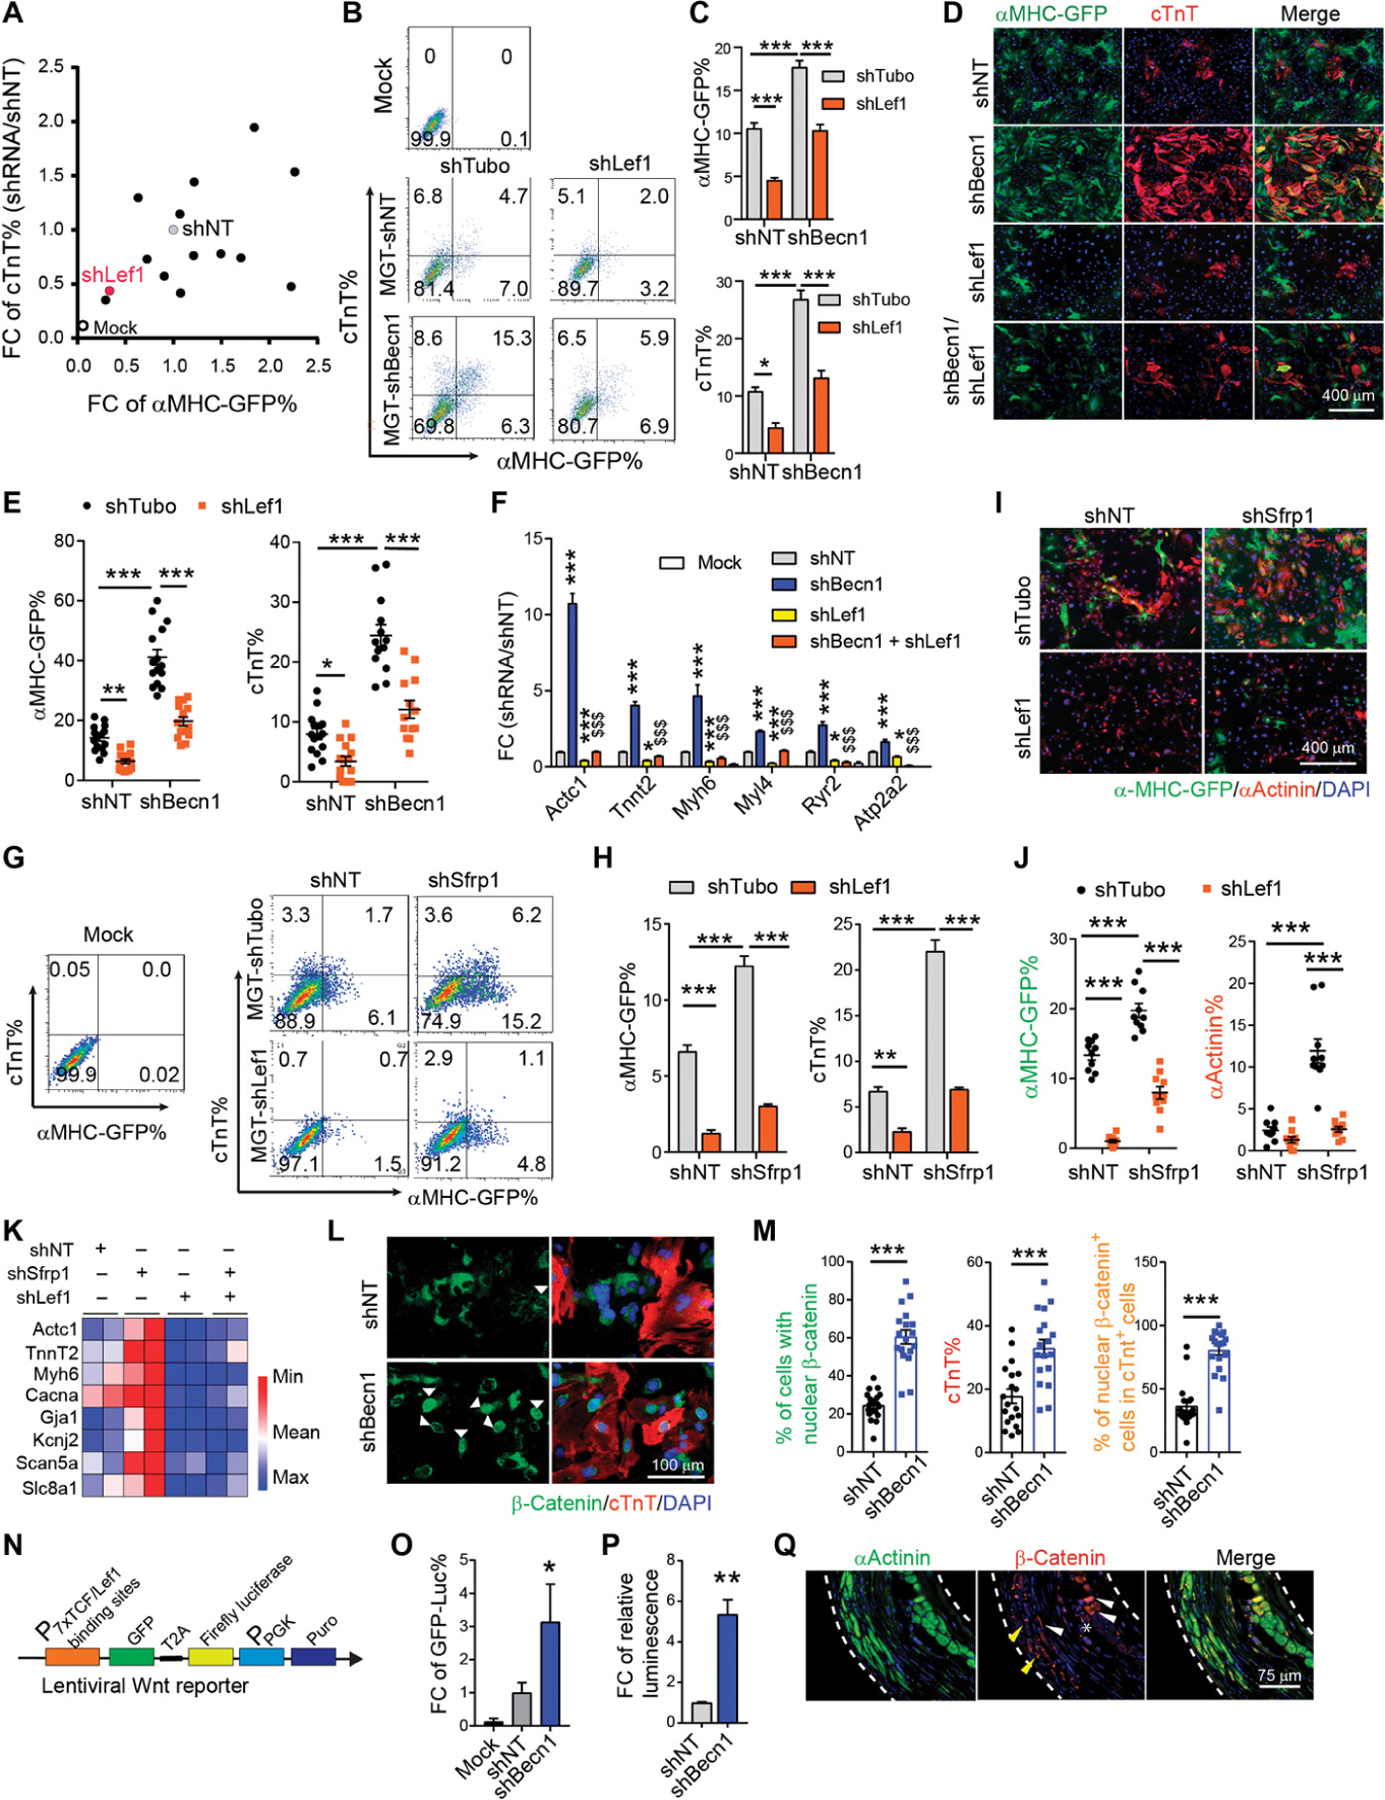
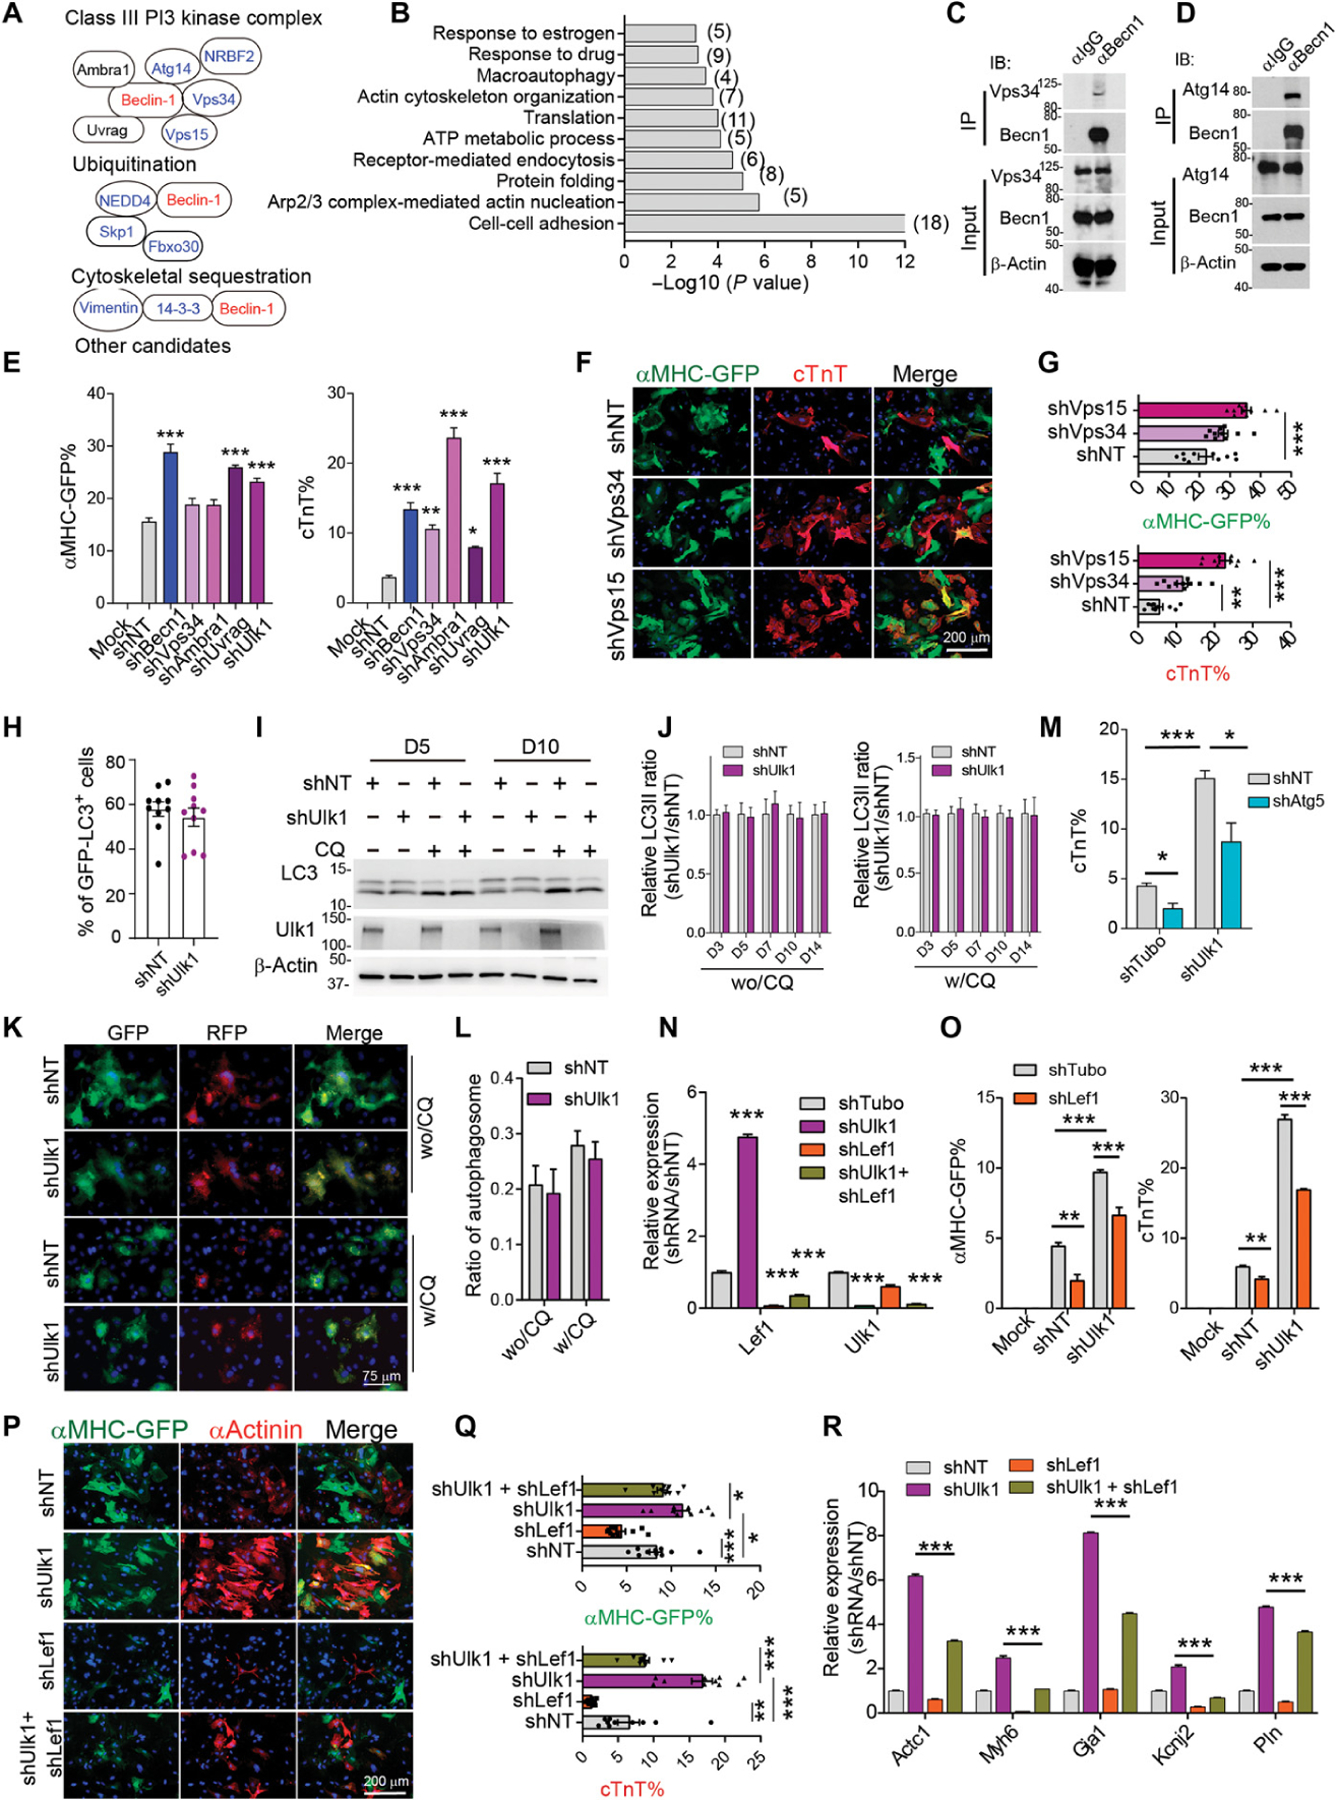
Direct reprogramming of fibroblasts to alternative cell fates by forced expression of transcription factors offers a platform to explore fundamental molecular events governing cell fate identity. The discovery and study of induced cardiomyocytes (iCMs) not only provides alternative therapeutic strategies for heart disease but also sheds lights on basic biology underlying CM fate determination. The iCM field has primarily focused on early transcriptome and epigenome repatterning, whereas little is known about how reprogramming iCMs remodel, erase, and exit the initial fibroblast lineage to acquire final cell identity. Here, we show that autophagy-related 5 (Atg5)-dependent autophagy, an evolutionarily conserved self-digestion process, was induced and required for iCM reprogramming. Unexpectedly, the autophagic factor Beclin1 (Becn1) was found to suppress iCM induction in an autophagy-independent manner. Depletion of Becn1 resulted in improved iCM induction from both murine and human fibroblasts. In a mouse genetic model, Becn1 haploinsufficiency further enhanced reprogramming factor-mediated heart function recovery and scar size reduction after myocardial infarction. Mechanistically, loss of Becn1 up-regulated Lef1 and down-regulated Wnt inhibitors, leading to activation of the canonical Wnt/β-catenin signaling pathway. In addition, Becn1 physically interacts with other classical class III phosphatidylinositol 3-kinase (PI3K III) complex components, the knockdown of which phenocopied Becn1 depletion in cardiac reprogramming. Collectively, our study revealed an inductive role of Atg5-dependent autophagy as well as a previously unrecognized autophagy-independent inhibitory function of Becn1 in iCM reprogramming.


Conflict of interest statement

Competing interests: The authors declare that they have no competing interests.

Figures

Fig. 1.
Fig. 1.. Autophagy was activated during iCM reprogramming.
(A) Western blot of autophagy markers in murine CFs transduced with MGT or LacZ. Chloroquine (CQ) was added to treat cells for 4 hours at the concentration of 20 µm. w/CQ, with CQ treatment; wo/CQ, without CQ treatment. (B) Representative ICC images of GFP–LC3 puncta formation in explanted CFs transduced with either MGT or LacZ control virus at different time courses of reprogramming. (C and D) Representative TEM images (C) and quantification data (D) showing autophagic vacuoles (highlighted with yellow arrowheads). High magnification of labeled areas is shown in the right panels. (E and F) Representative images (E) and quantification (F) of mFRP-GFP–LC3 puncta formation in CFs transduced with either MGT or LacZ control virus at reprogramming day 5. CQ was added to culture media at the final concentration of 20 µm for 4 hours before sample collection. (G) Schematic depiction of experimental design on pharmacological treatment of iCMs. (H and I) Representative flow cytometry plots (H) and quantification data (I) for αMHC-GFP+ and cTnT+ cells 10 days after transduction of MGT followed by rapamycin and torin treatment. (J) Heatmap of cardiac gene expression in uninfected (mock) and MGT-infected iCMs treated with rapamycin, torin, or vehicle control. All experiments were repeated at least three times. Mean values from technical triplicates [except n = 15 to 20 for (D) and (F)] were used for statistics. Groups were compared using two-tailed unpaired t test or one-way ANOVA with Tukey’s multiple comparisons test for multiple groups. Error bars indicate means ± SEM; *P < 0.05, **P < 0.01, and ***P < 0.001.
Fig. 2.
Fig. 2.. Activation of autophagy promoted iCM reprogramming.
(A) Schematic depiction of experimental design using MGT and shRNAs. (B and C) Representative flow cytometry plots (B) and quantification data (C) for cTnT+ and αMHC-GFP+ cTnT+ cells 10 days after transduction of MGT and shRNAs targeting Atg5 or nontargeting control (NT). Cells that were not transduced with retrovirus were used as mock. (D) qPCR analysis of knockdown efficiency of shRNAs targeting Atg5 and Atg7, respectively, on reprogramming day 10. RQ, relative quantification of gene expression. (E and F) Representative images (E) and quantification (F) of cells transduced with MGT followed by shRNAs targeting Atg5 and Atg7 on reprogramming day 14. (G) qPCR analysis of cardiac gene expression in iCMs transduced with MGT and shAtg5 on reprogramming day 10. Values were normalized to control cells without MGT delivery (mock). (H) Quantification of flow cytometric analysis of cTnT+ iCMs transduced with lentiviral shNT or shAtg5 at different time points. Cells were collected on reprogramming day 10. FC, fold change. (I and J) Representative images (I) and quantification (J) showing the formation of autophagosomes in iCMs treated with shNT or shAtg5 on reprogramming day 5. w/CQ, with CQ treatment for 4 hours; wo/CQ, without CQ treatment. (K) Representative Western blot showing the autophagy flux in iCMs treated with shNT or shAtg5 on reprogramming day 5 and day 10. CQ was added to cells for 4 hours before sample collection. β-Actin serves as loading control. wo/CQ, without CQ treatment; w/CQ, with CQ treatment (20 µm) for 4 hours. (L) Quantification of autophagy flux detected by Western blot in the presence of shAtg5 from day 3 to day 14. (M) Expression of Atg5 after overexpression. (N) Representative flow cytometry plots showing gating cTnT+ cells out of Atg5-EGFP+ or EGFP+ cells. (O) Quantification of cTnT% cells in (N). All experiments were repeated at least three times. Mean values from technical triplicates [except n = 10 to 20 for (E) and (J)] were used for statistics. Groups were compared using two-tailed unpaired t test or one-way ANOVA with Tukey’s multiple comparisons test for multiple groups. Error bars indicate means ± SEM; *P < 0.05, **P < 0.01, and ***P < 0.001.
Fig. 3.
Fig. 3.. Depletion of Beclin1 increased reprogramming efficiency and enhanced iCM maturation.
(A and B) Representative flow cytometry plots (A) and quantification data (B) for αMHC-GFP+ and cTnT+ cells 10 days after transduction of MGT together with shRNAs against Becn1 or nontargeting (NT) control on freshly isolated CFs. (C) Knockdown efficiency of shBecn1 evaluated by qPCR. (D) Morphology of iCMs treated with shNT or shBecn1 lentivirus on reprogramming day 7. (E to G) Representative ICC images (E and F) and quantification data (G) for αMHC-GFP (green), cTnT (magenta), and αActinin (red) on MGT-transduced CFs treated with indicated shRNAs. (H) Heatmap of cardiac gene expression in uninfected (CF) and MGT-infected iCMs treated with shNT or shBecn1 (biological duplicates in each group). (I) Quantification of fibroblast gene expression in MGT-transduced cells treated with shNT or shBecn1 by qPCR. FC, fold change. (J to L) Quantification of FACS data showing reprogramming efficiency of neonatal explanted cardiac fibroblast (ExCFs) (J), adult ExCFs (K), and MEFs (L). (M) Representative ICC images showing αMHC-GFP, cTnT, and connectin43 (CX43) in iCMs. Enlarged images showing the well-aligned CX43 molecules at two adjacent GFP+ cells and well-formed sarcomere structure in iCMs deficient for Becn1. (N) Quantification of cells showing sarcomere structure in shNT- or shBecn1-treated iCMs on reprogramming day 14. (O) Quantification of CX43+ iCMs on reprogramming day 14. (P and Q) iCM calcium transients (P) and quantification (Q) measured by Rhod3 dye labeling. Each trace corresponds to the spot numbered in the top panel. (R and S) Representative images (R) and quantification (S) of spontaneously contracting iCMs (yellow lines) 6 weeks after MGT and indicated shRNA transduction. (T) Distribution of iCMs aligned on MEA culture plate. Each white dotted cycle indicates individual microelectrode. (U) Representative simultaneous recordings of the iCMs 3 weeks after retroviral MGT plus shNT or shBecn1 transduction on the MEA culture plates. The number of individual electrodes corresponding to the plot is shown. (V and W) Representative flow plots (V) and quantification data (W) for percentage of cTnT 12 days after human MGT (hMGT) and indicated shRNA transduction into human H9F fibroblasts. hMGT, human MGT; hBecn1, human Becn1. (X) Knockdown efficiency of shRNA targeting human Becn1 accessed by qPCR. (Y) Representative ICC images and quantification data of human iCMs at 2 weeks after hMGT and indicated shRNA transduction. (Z) Heatmap of the relative expression of a set of cardiac genes determined by qPCR 2 weeks after hMGT and indicated shRNA transduction. All experiments were repeated at least three times. Mean values from technical triplicates [except n = 10 to 20 for (G), (N), (O), (Q) and (Y)] were used for statistics. Groups were compared using two-tailed unpaired t test or one-way ANOVA with Tukey’s multiple comparisons test for multiple groups. Error bars indicate means ± SEM; *P < 0.05, **P < 0.01, and ***P < 0.001.
Fig. 4.
Fig. 4.. Heterozygous loss of function of Becn1 enhanced reprogramming and improved heart function after MI.
(A) Schematic of Becn1 heterozygous mutant mouse. R1 to R3 indicate the location of PCR primers for genotyping. (B) Representative genotyping results from wild-type (Becn1+/+) or Becn1 heterozygous (Becn1+/−) mice. PCR primer pairs are listed above the gel plot. (C) Schematic of breeding strategy to cross αMHC-GFP reporter line with Becn1 mutant mouse line. (D) Relative expression of Becn1 in heterozygous ExCFs determined by qPCR. (E and F) Representative flow plots (E) and quantification data (F) for αMHC-GFP+ and cTnT+ cells 10 days after transduction of MGT to Becn1+/− and Becn1+/+ CFs. (G) Echocardiography to measure ventricular contractility 4 weeks after MI. (H and I) Quantification of 4-week ejection fraction (EF) (H) and FS (I) as absolute values is shown. (J and K) Representative histological heart sections with Masson trichrome staining and quantification (K) showing the areas of fibrosis among retroviral DsRed or G, M, and T delivered Becn1 mutant or wild-type mice. All experiments were repeated at least three times. Mean values from technical triplicates [except n = 4 for (F) and n = 5 to 10 in each group for (H) to (K)] were used for statistics. Groups were compared using two-tailed unpaired t test or one-way ANOVA with Tukey’s multiple comparisons test for multiple groups. Two-way ANOVA followed by Tukey post hoc test was used for (H), (I), and (K). Error bars indicate means ± SEM; *P < 0.05 and ***P < 0.001.
Fig. 5.
Fig. 5.. Becn1 inhibits iCM conversion independent of autophagy.
(A) Schematic of experimental design to determine the temporal requirement of Becn1 knockdown in cardiac reprogramming. (B) Quantification of αMHC-GFP% and cTnT% on reprogramming day 10 as designed in (A). (C) qPCR of gene expression at different time points upon MGT transduction and Becn1 knockdown. Values were normalized to uninfected control on day 3 (mock). (D) Western blot analysis of αMHC-GFP, Mef2c, Gata4, and Tbx5 expression. β-Actin serves as a loading control. (E) Schematic of experiment design to determine the time window of Becn1 knockdown. (F) Fold change (FC) of αMHC-GFP% and cTnT% in iCMs as described in (E). (G and H) Representative images showing GFP-LC3 puncta formation (G) and quantification (H) in iCMs transduced with shNT or shBecn1 on reprogramming day 5. Lentiviral GFP-LC3 constructs were transduced into iCMs on reprogramming day 1. (I and J) Representative Western blot (I) and quantification (J) showing the autophagy flux in iCMs treated with shNT or shBecn1 from reprogramming day 3 to day 14. Sample on the indicated dates were treated with or without CQ for 4 hours. β-Actin serves as loading control. wo/CQ, without CQ treatment; w/CQ, with CQ treatment. (K) Representative images showing autophagosome (yellow) and autolysosome (red) in iCMs transduced with mRFP-GFP-LC3 construct. shRNAs targeting Becn1 or control shRNA (shNT) were introduced into iCMs on day 1, and images were taken on reprogramming day 5 after cells were treated with or without CQ for 4 hours. (L) Quantification of autophagosome ratio in (K). (M and N) FACS analysis (M) and quantification (N) of iCMs upon lentiviral delivery of shNT, shBecn1, shAtg5, and shBecn1 plus shAtg5 on reprogramming day 10. All experiments were repeated at least three times. Mean values from technical triplicates [except n = 10 to 15 for (H) and (L)] were used for statistics. Groups were compared using one-way ANOVA with Tukey’s multiple comparisons test for multiple groups. Error bars indicate means ± SEM; **P < 0.01 and ***P < 0.001.
Fig. 6.
Fig. 6.. Loss of Becn1 minimal affected early chromatin accessibility of iCMs but altered transcriptomic profile at later stage.
(A) Signal intensity (top) and heatmap (bottom) of ATAC-seq signals in cells treated with LacZ + shNT, LacZ + shBecn1, MGT + shNT, and MGT+shBecn1 and collected 3 days after viral transduction. Average reads from a 2-kb region across the transcriptional start sites (TSSs) were used. The color in heatmap represents the intensity of chromatin accessibility. (B) Differential analysis of ATAC-seq peaks between LacZ versus MGT or shNT versus shBecn1 samples. Yellow indicates LacZ-transduced shNT or shBecn1 cells, and green indicates the MGT-transduced cells. Two-way arrows indicate the samples for differential analysis. The number of differential regions is shown. Gain, numbers of sites that gain chromatin accessibility; Loss, numbers of sites that lose chromatin accessibility. (C) Hierarchical clustering and heatmap showing the expression of cardiac and fibrotic genes in samples as in (A) at reprogramming day 3 and day 5. (D and E) GSEA analysis shows enrichment of indicated gene sets in MGT + shBecn1 cells compared to MGT + shNT cells on reprogramming day 3 (D) and day 5 (E). (F and G) Overlap of up-regulated (F) band down-regulated (G) differentially expressed genes (DEGs) induced by Becn1 knockdown between MGT and LacZ-transduced cells on reprogramming day 5. (H and I) GO analysis of up-regulated (H) and down-regulated (I) DEGs using gene list from (F) and (G), respectively. (J) qPCR analysis of indicated gene expression at different time points of reprogramming. All experiments were repeated at least three times. Mean values from technical triplicates were used for statistics. Two-tailed unpaired t test was used for (J) comparing shBecn1 versus shNT at each time point. Error bars indicate means ± SEM; **P < 0.01 and ***P < 0.001.
Fig. 7.
Fig. 7.. Becn1 knockdown activated Wnt/β-catenin signaling through regulating the expression of Lef1 and Wnt inhibitors.
(A) shRNA screen for identifying Becn1 downstream effectors. 2D scatterplot showing fold change (FC) in the percentage of αMHC-GFP+ and cTnT+ cells on freshly isolated CFs. (B and C) Representative flow cytometry plots (B) and quantification (C) of αMHC-GFP+ and cTnT+ cells 10 days after MGT and indicated lentiviral shRNA transduction on freshly isolated CFs. (D and E) Representative images (D) and quantification (E) of cells transduced with MGT followed by shRNAs targeting Becn1, Lef1, and both on reprogramming day 14. (F) qPCR for cardiac gene expression in uninfected (mock) or MGT-infected iCMs treated with shNT, shBecn1, shLef1, or shBecn1 + shLef1. *, compared to the MGT+shNT group; $, compared to the MGT + shBecn1 group. (G and H) Representative flow cytometry plots (G) and quantification (H) of αMHC-GFP+ and cTnT+ cells 10 days after MGT transduction and after infection of shRNAs targeting NT, Sfrp1, Lef1, and Sfrp1 + Lef1 on freshly isolated CFs. (I and J) Representative images (I) and quantification (J) of cells as in (G). (K) Heatmap of cardiac gene expression in cells as in (G). (L and M) Representative images (L) and quantification (M) showing nuclear translocation of β-catenin (green) in iCMs positive for cTnT (red). (N) Schematic of lentiviral Wnt reporter construct harboring both GFP and firefly luciferase expression. (O) Quantification of flow analysis showing the FC of GFP-luciferase+ percentage on freshly isolated wild-type CD1 CFs transduced with Wnt reporter on day 14. Cells in the mock group were not infected by any kind of virus. Values were normalized to the MGT + shNT group. (P) Quantification of relative luminescence in cells as in (O). (Q) Representative ICC images showing cellular localization of β-catenin in hearts of Becn1+/− mice 8 weeks after MI and MGT delivery. White dashed line, area of infarct zone; yellow arrowhead, intercalated discs; white arrowhead, cytoplasmic localization; star, nuclear localization. All experiments were repeated at least three times. Mean values from technical triplicates [except n = 10 to 20 for (E), (J), and (M)] were used for statistics. Groups were compared using one-way ANOVA with Tukey’s multiple comparisons test for multiple groups and two-way ANOVA followed by Tukey post hoc test was used for (C), (E), (H), and (J). Error bars indicate means ± SEM; *P < 0.05, **P < 0.01, and ***P < 0.001; $$$P < 0.001.
Fig. 8.
Fig. 8.. Becn1 suppresses iCM conversion by interacting with the PI3K complex downstream of ULK1.
(A) Known Becn1-interacting protein identified from mass spectral analysis. (B) Enriched GO terms from potential Becn1 binding partners identified by mass spectral analysis. (C and D) Representative Western blot analysis showing the immunoprecipitation of Becn1 with Vps34 (C) and Atg14 (D) in iCMs 5 days after MGT transduction. (E) Quantification of flow analysis showing the percentage of αMHC-GFP+ and cTnT+ cells 10 days after MGT transduction and after infection of indicated shRNAs targeting the PI3K III complex. (F and G) Representative images (F) and quantification (G) of cells transduced with MGT followed by infection of shRNAs targeting NT, Vps35, and Vps15 on reprogramming day 14. (H) Quantification of GFP-LC3 puncta formation in iCMs treated with shUlk1 or shNT at reprogramming day 5. (I) Representative Western blot showing the autophagy flux in iCMs treated with shUlk1 or control shNT on reprogramming day 5 and day 10. (J) Quantification of autophagy flux detected by Western blot in iCMs with Ulk1 knockdown from day 3 to day 14. wo/CQ, without CQ treatment; w/CQ, with CQ treatment (20 µm) for 4 hours. (K and L) Representative images (K) and quantification (L) showing the formation of autophagosomes in iCMs upon Ulk1 knockdown in the presence or absence of CQ treatment. (M) Quantification of flow analysis showing the percentage of cTnT+ cells 10 days after MGT plus indicated shRNA transduction. (N) qPCR analysis of Lef1 and Ulk1 expression in cells as in cells treated with indicated shRNA. (O) Quantification of FACS analysis showing the percentage of αMHC-GFP+ and cTnT+ cells 10 days after MGT plus indicated shRNAs transduction. (P and Q) Representative (P) and quantification (Q) of ICC images showing the percentage of αMHC-GFP+ and cTnT+ cells 14 days after MGT and indicated shRNA transduction. (R) qPCR analysis of indicated cardiac gene expression in cells treated as in (P). All experiments were repeated at least three times. Mean values from technical triplicates [except n = 10 to 15 for (G), (J), (M), and (Q)] were used for statistics. Groups were compared using two-tailed unpaired t test or one-way ANOVA with Tukey’s multiple comparisons test for multiple groups and two-way ANOVA followed by Tukey post hoc test was used for (K) and (O). Error bars indicate means ± SEM; *P < 0.05, **P < 0.01, and ***P < 0.001.

Similar articles

Cited by

References

    1. Takahashi K, Tanabe K, Ohnuki M, Narita M, Ichisaka T, Tomoda K, Yamanaka S, Induction of pluripotent stem cells from adult human fibroblasts by defined factors. Cell 131, 861–872 (2007). - PubMed
    1. Takahashi K, Yamanaka S, Induction of pluripotent stem cells from mouse embryonic and adult fibroblast cultures by defined factors. Cell 126, 663–676 (2006). - PubMed
    1. Song G, Pacher M, Balakrishnan A, Yuan Q, Tsay H-C, Yang D, Reetz J, Brandes S, Dai Z, Pützer BM, Araúzo-Bravo MJ, Steinemann D, Luedde T, Schwabe RF, Manns MP, Schöler HR, Schambach A, Cantz T, Ott M, Sharma AD, Direct reprogramming of hepatic myofibroblasts into hepatocytes in vivo attenuates liver fibrosis. Cell Stem Cell 18, 797–808 (2016). - PubMed
    1. Han DW, Greber B, Wu G, Tapia N, Araúzo-Bravo MJ, Ko K, Bernemann C, Stehling M, Schöler HR, Direct reprogramming of fibroblasts into epiblast stem cells. Nat. Cell Biol 13, 66–71 (2011). - PubMed
    1. Huang P, He Z, Ji S, Sun H, Xiang D, Liu C, Hu Y, Wang X, Hui L, Induction of functional hepatocyte-like cells from mouse fibroblasts by defined factors. Nature 475, 386–389 (2011). - PubMed

Publication types