

Tracking elemental changes in an ischemic stroke model with X-ray fluorescence imaging
- PMID: 33082455
- PMCID: PMC7575585
- DOI: 10.1038/s41598-020-74698-2
Tracking elemental changes in an ischemic stroke model with X-ray fluorescence imaging
Abstract
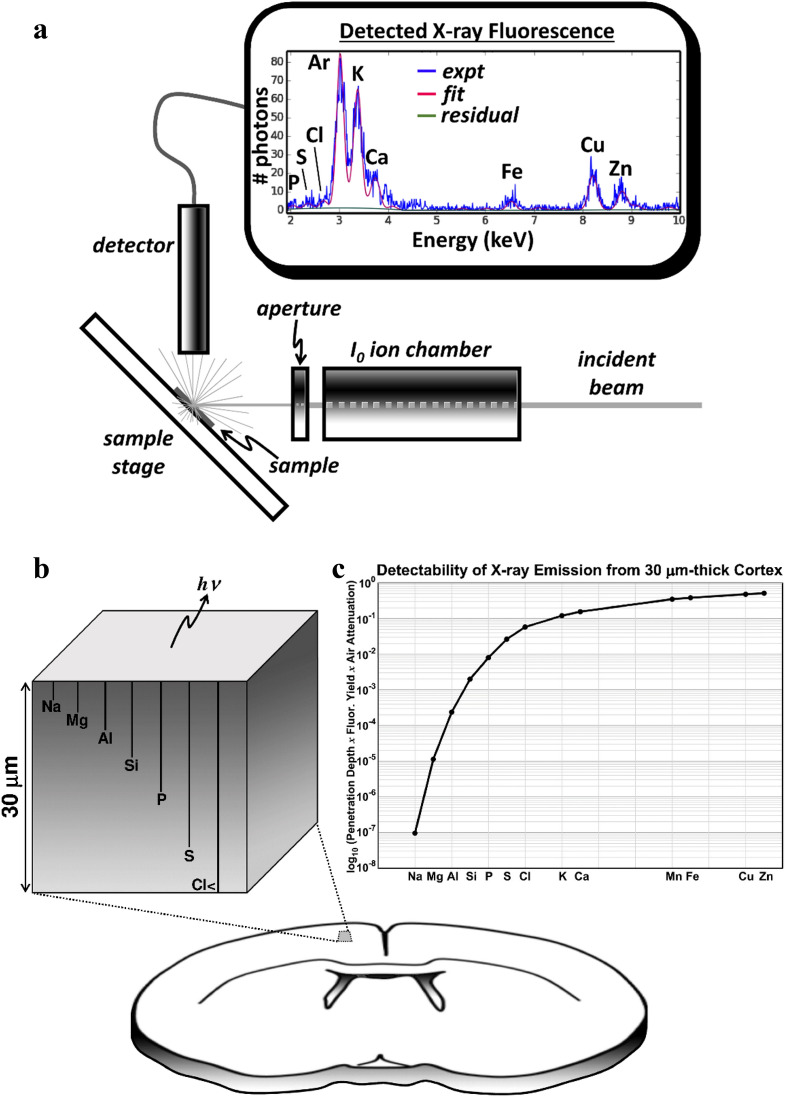
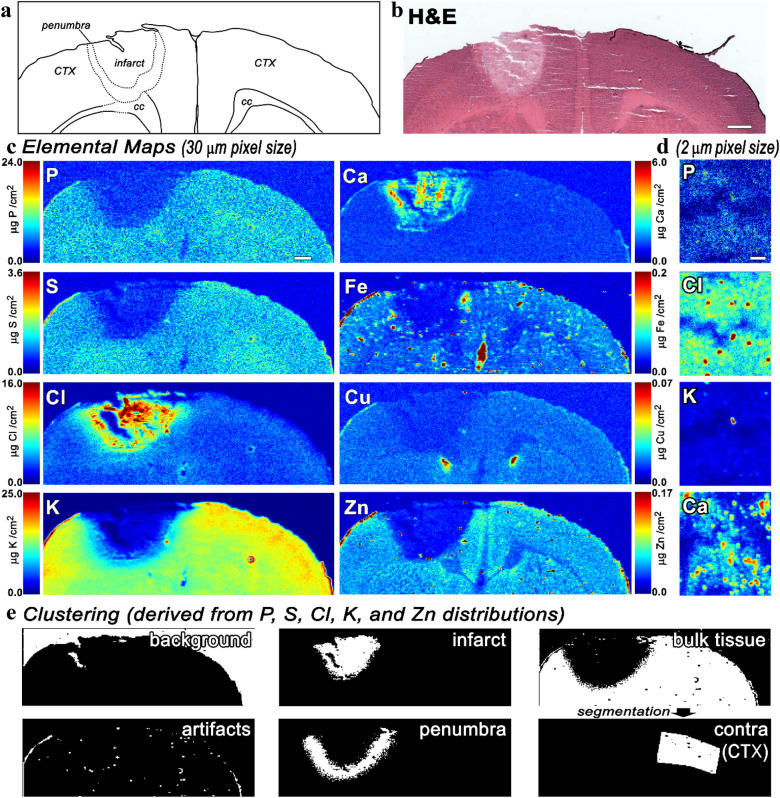
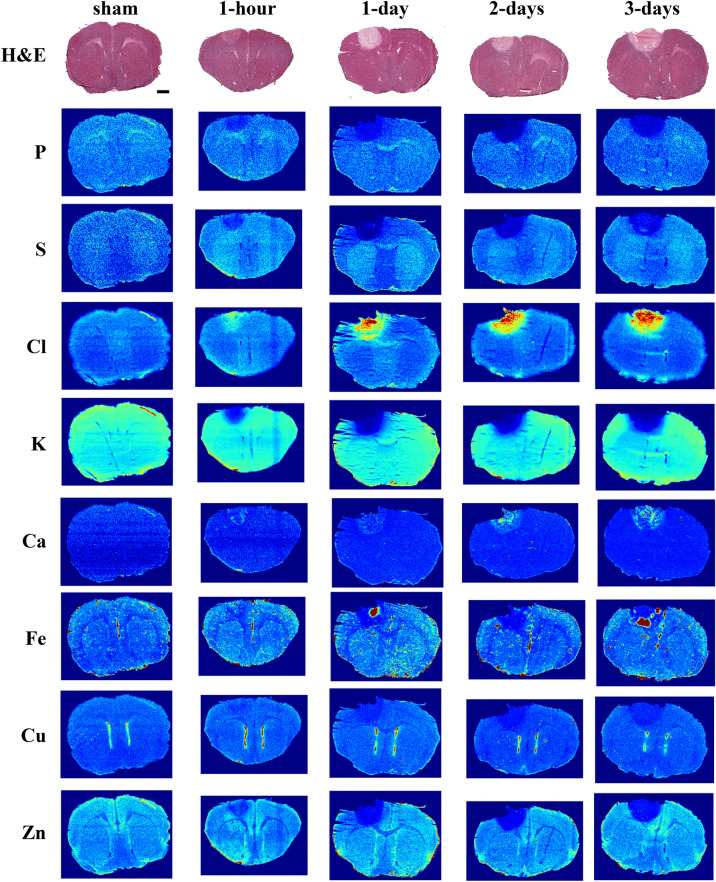
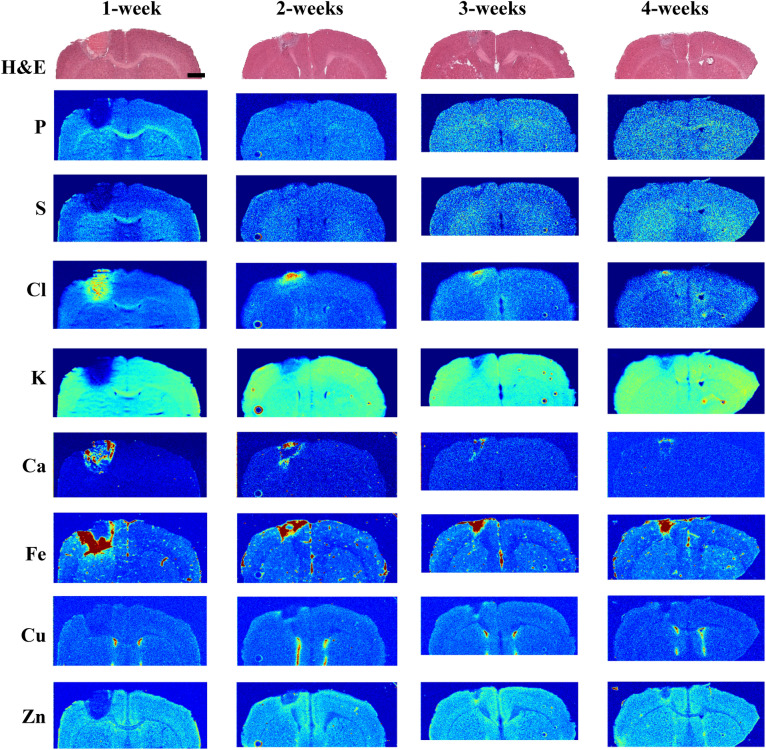
Stroke is a leading cause of long-term disability in adults and a leading cause of death in developed nations. The cascade of cellular events and signalling that occur after cerebral ischemia are complex, however, analyzing global element markers of metabolic state affords the means to monitor stroke severity, status of injury, and recovery. These markers provide a multi-parameter method for assessing changes through the post-stroke time course. We employ synchrotron-based elemental mapping to follow elemental changes in the brain at 1 h, 1-, 2-, and 3-days, and at 1-, 2-, 3-, and 4-weeks post-stroke in a photothrombotic stroke model in mice. Our analysis reveals a highly consistent metabolic penumbra that can be readily identified based on the level of dysregulated potassium and other key elements. Maps of elemental distributions are also useful to demarcate events in the cellular response to the inflammatory cascade, including ion dysregulation, recruitment of cells to the lesion, and glial scar formation.
Conflict of interest statement
The authors declare no competing interests.
Figures

Similar articles
-
Revealing the Penumbra through Imaging Elemental Markers of Cellular Metabolism in an Ischemic Stroke Model.ACS Chem Neurosci. 2018 May 16;9(5):886-893. doi: 10.1021/acschemneuro.7b00382. Epub 2018 Jan 30. ACS Chem Neurosci. 2018. PMID: 29370523
-
Ion Dyshomeostasis in the Early Hyperacute Phase after a Temporary Large-Vessel Occlusion Stroke.ACS Chem Neurosci. 2024 Jun 5;15(11):2132-2143. doi: 10.1021/acschemneuro.3c00685. Epub 2024 May 14. ACS Chem Neurosci. 2024. PMID: 38743904
-
Quantification of selected elements in ovarian tumours and their potentials as a tissue classifier.J Physiol Pharmacol. 2017 Oct;68(5):699-707. J Physiol Pharmacol. 2017. PMID: 29375044
-
Nuclear microprobe: a microanalytical technique in biology.Cell Mol Biol (Noisy-le-grand). 1996 Feb;42(1):1-16. Cell Mol Biol (Noisy-le-grand). 1996. PMID: 8833662 Review.
-
Elemental imaging of trace elements in bone samples using micro and nano-X-ray fluorescence spectrometry.Appl Radiat Isot. 2019 Jul;149:200-205. doi: 10.1016/j.apradiso.2019.04.033. Epub 2019 Apr 30. Appl Radiat Isot. 2019. PMID: 31077976 Review.
Cited by
-
Quantitative imaging approaches to understanding biological processing of metal ions.Curr Opin Chem Biol. 2022 Aug;69:102152. doi: 10.1016/j.cbpa.2022.102152. Epub 2022 May 11. Curr Opin Chem Biol. 2022. PMID: 35561425 Free PMC article. Review.
-
Quantification of human plasma metalloproteins in multiple sclerosis, ischemic stroke and healthy controls reveals an association of haptoglobin-hemoglobin complexes with age.PLoS One. 2022 Jan 12;17(1):e0262160. doi: 10.1371/journal.pone.0262160. eCollection 2022. PLoS One. 2022. PMID: 35020753 Free PMC article.
-
A review of the "metallome" within neurons and glia, as revealed by elemental mapping of brain tissue.BBA Adv. 2021 Dec 26;2:100038. doi: 10.1016/j.bbadva.2021.100038. eCollection 2022. BBA Adv. 2021. PMID: 37082604 Free PMC article. Review.
-
Multimodal imaging of hemorrhagic transformation biomarkers in an ischemic stroke model.Metallomics. 2022 Apr 30;14(4):mfac007. doi: 10.1093/mtomcs/mfac007. Metallomics. 2022. PMID: 35254441 Free PMC article.
-
Sex differences in the mouse photothrombotic stroke model investigated with X-ray fluorescence microscopy and Fourier transform infrared spectroscopic imaging.IBRO Neurosci Rep. 2022 Aug 2;13:127-135. doi: 10.1016/j.ibneur.2022.07.006. eCollection 2022 Dec. IBRO Neurosci Rep. 2022. PMID: 35989697 Free PMC article.
References
Publication types
MeSH terms
Substances
Grants and funding
LinkOut - more resources
Full Text Sources
Medical
