Evaluation of the impact of heat on wheat dormancy, late maturity α-amylase and grain size under controlled conditions in diverse germplasm
- PMID: 33082361
- PMCID: PMC7576155
- DOI: 10.1038/s41598-020-73707-8
Evaluation of the impact of heat on wheat dormancy, late maturity α-amylase and grain size under controlled conditions in diverse germplasm
Abstract
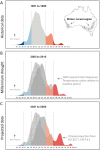
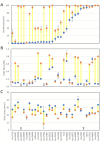
In the Australian wheat belts, short episodes of high temperatures or hot spells during grain filling are becoming increasingly common and have an enormous impact on yield and quality, bringing multi-billion losses annually. This problem will become recurrent under the climate change scenario that forecast increasing extreme temperatures, but so far, no systematic analysis of the resistance to hot spells has yet been performed in a diverse genetic background. We developed a protocol to study the effects of heat on three important traits: grain size, grain dormancy and the presence of Late Maturity α-Amylase (LMA), and we validated it by analysing the phenotypes of 28 genetically diverse wheat landraces and exploring the potential variability existing in the responses to hot spells. Using controlled growth environments, the different genotypes were grown in our standard conditions until 20 days after anthesis, and then moved for 10 days into a heat chamber. Our study showed that our elevated temperature treatment during mid-late filling triggered multiple detrimental effects on yield and quality. We observed a reduction in grain size, a reduction in grain dormancy and increased LMA expression in most of the tested genotypes, but potential resistant lines were identified for each analyzed trait opening new perspectives for future genetic studies and breeding for heat-insensitive commercial lines.
Conflict of interest statement
The authors declare no competing interests.
Figures


Similar articles
-
Late-maturity α-amylase (LMA): exploring the underlying mechanisms and end-use quality effects in wheat.Planta. 2021 Nov 27;255(1):2. doi: 10.1007/s00425-021-03749-3. Planta. 2021. PMID: 34837530 Free PMC article. Review.
-
Late-maturity α-amylase expression in wheat is influenced by genotype, temperature and stage of grain development.Planta. 2020 Jan 16;251(2):51. doi: 10.1007/s00425-020-03341-1. Planta. 2020. PMID: 31950359
-
Wheat grain preharvest sprouting and late maturity alpha-amylase.Planta. 2014 Dec;240(6):1167-78. doi: 10.1007/s00425-014-2172-5. Epub 2014 Sep 26. Planta. 2014. PMID: 25257145 Review.
-
Testing the responses of four wheat crop models to heat stress at anthesis and grain filling.Glob Chang Biol. 2016 May;22(5):1890-903. doi: 10.1111/gcb.13212. Epub 2016 Feb 27. Glob Chang Biol. 2016. PMID: 26725507
-
Heat tolerance around flowering in wheat identified as a key trait for increased yield potential in Europe under climate change.J Exp Bot. 2015 Jun;66(12):3599-609. doi: 10.1093/jxb/erv070. Epub 2015 Mar 7. J Exp Bot. 2015. PMID: 25750425 Free PMC article.
Cited by
-
Image facilitated assessment of intra-spike variation in grain size in wheat under high temperature and drought stress.Sci Rep. 2023 Nov 13;13(1):19850. doi: 10.1038/s41598-023-44503-x. Sci Rep. 2023. PMID: 37963937 Free PMC article.
-
Late-maturity α-amylase (LMA): exploring the underlying mechanisms and end-use quality effects in wheat.Planta. 2021 Nov 27;255(1):2. doi: 10.1007/s00425-021-03749-3. Planta. 2021. PMID: 34837530 Free PMC article. Review.
-
A 'wiring diagram' for source strength traits impacting wheat yield potential.J Exp Bot. 2023 Jan 1;74(1):72-90. doi: 10.1093/jxb/erac415. J Exp Bot. 2023. PMID: 36264277 Free PMC article. Review.
-
Late-Maturity Alpha-Amylase in Wheat (Triticum aestivum) and Its Impact on Fresh White Sauce Qualities.Foods. 2021 Jan 20;10(2):201. doi: 10.3390/foods10020201. Foods. 2021. PMID: 33498449 Free PMC article.
-
Potential abiotic stress targets for modern genetic manipulation.Plant Cell. 2023 Jan 2;35(1):139-161. doi: 10.1093/plcell/koac327. Plant Cell. 2023. PMID: 36377770 Free PMC article. Review.
References
-
- Hertel TW, Burke MB, Lobell DB. The poverty implications of climate-induced crop yield changes by 2030. Glob. Environ. Change-Hum. Policy Dimens. 2010;20:577–585. doi: 10.1016/j.gloenvcha.2010.07.001. - DOI
-
- Lobell DB. Climate change adaptation in crop production: Beware of illusions. Glob. Food Secur.-Agric. Policy Econ. Environ. 2014;3:72–76. doi: 10.1016/j.gfs.2014.05.002. - DOI
-
- Porfirio, L. L., Newth, D., Finnigan, J. J. & Cai, Y. Y. Economic shifts in agricultural production and trade due to climate change. Palgrave Commun.4, 10.1057/s41599-018-0164-y (2018).
Publication types
MeSH terms
Substances
LinkOut - more resources
Full Text Sources

