. 2020 Oct 20;11(1):5304.
doi: 10.1038/s41467-020-18949-w.

Selective neuronal degeneration in MATR3 S85C knock-in mouse model of early-stage ALS

Affiliations

Selective neuronal degeneration in MATR3 S85C knock-in mouse model of early-stage ALS

Ching Serena Kao et al. Nat Commun. .

Abstract

A missense mutation, S85C, in the MATR3 gene is a genetic cause for amyotrophic lateral sclerosis (ALS). It is unclear how the S85C mutation affects MATR3 function and contributes to disease. Here, we develop a mouse model that harbors the S85C mutation in the endogenous Matr3 locus using the CRISPR/Cas9 system. MATR3 S85C knock-in mice recapitulate behavioral and neuropathological features of early-stage ALS including motor impairment, muscle atrophy, neuromuscular junction defects, Purkinje cell degeneration and neuroinflammation in the cerebellum and spinal cord. Our neuropathology data reveals a loss of MATR3 S85C protein in the cell bodies of Purkinje cells and motor neurons, suggesting that a decrease in functional MATR3 levels or loss of MATR3 function contributes to neuronal defects. Our findings demonstrate that the MATR3 S85C mouse model mimics aspects of early-stage ALS and would be a promising tool for future basic and preclinical research.


Conflict of interest statement

The authors declare no competing interests.

Figures
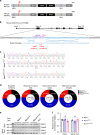
Fig. 1
Fig. 1. Generation of MATR3 S85C knock-in mice using CRISPR-Cas9 technology.
a Schematic representation comparing the identity of protein sequences between human and mouse MATR3. The serine 85 residue in red is conserved between humans and mice. Yellow lines in mouse MATR3 indicate residues that are not conserved in human MATR3. Nuclear export sequence, NES; zinc finger motif, ZnF; RNA recognition motif, RRM; nuclear localization sequence, NLS. b A guide RNA and repair template were designed to introduce the S85C mutation (red asterisk) within the mouse Matr3 locus (Chr18qB2) in exon 2. The addition of two silent mutations (red hash) disrupted the PAM sequence and prevented re-cleavage of the repaired template. c Sanger sequence verification of the S85C and silent mutations in the endogenous mouse Matr3 locus. d Matr3S85C/S85C mice are born at the expected Mendelian ratio. No significant (ns) differences between observed and expected numbers using the chi-squared test for goodness of fit. e Matr3 mRNA levels in the brain and spinal cord at 3 weeks of age by RT-PCR. Gapdh primers were used as a control. f Quantification of e, n = 3 biological replicates per genotype. Data are presented as mean ± SEM and show no significant (ns) differences in Matr3 mRNA levels between the littermates as determined by unpaired two-tailed t-test. Source data are provided as a Source Data file.
Fig. 2
Fig. 2. Homozygous S85C knock-in mice reach humane endpoint at over one year of age.
a Homozygous S85C animals (both males and females) exhibited significant differences in weight starting at around 15 and 21 weeks of age for males and females, respectively. Each dot represents mean ± SEM, where males: n = at least 10 Matr3+/+, 10 Matr3S85C/+, 5 Matr3S85C/S85C; females: n = at least 8 Matr3+/+, 10 Matr3S85C/+, 8 Matr3S85C/S85C (exact n numbers for each age are presented in Supplementary Information). Two-way ANOVA, Dunnett correction for multiple comparisons, see Supplementary Information for p-values at each age (*p < 0.05). b The phenotype score for wild-type, heterozygous and homozygous S85C male and female animals at over 1 year of age. Mice with a score of 60 were considered to be at the endpoint. Each dot represents a single animal (males: n = 10 Matr3+/+, 12 Matr3S85C/+, 6 Matr3S85C/S85C; females: n = 10 Matr3+/+, 12 Matr3S85C/+, 11 Matr3S85C/S85C), with data presented as mean ± SEM. Significance was determined by unpaired two-tailed t-test; ****p < 0.0001. c Size difference between wild-type and homozygous S85C mice at endpoint. Source data are provided as a Source Data file.
Fig. 3
Fig. 3. Homozygous S85C knock-in mice exhibit progressive motor deficits.
a, b Motor coordination was assessed by (a) Rotarod (6 weeks: n = 20 Matr3+/+, 30 Matr3S85C/+, 24 Matr3S85C/S85C; 10 weeks: n = 19 Matr3+/+, 29 Matr3S85C/+, 23 Matr3S85C/S85C, ****p < 0.0001; 20 weeks: n = 17 Matr3+/+, 27 Matr3S85C/+, 22 Matr3S85C/S85C, ****p < 0.0001; 30 weeks: n = 17 Matr3+/+, 27 Matr3S85C/+, 22 Matr3S85C/S85C, ****p < 0.0001) and by (b) dowel test (10 weeks: n = 19 Matr3+/+, 28 Matr3S85C/+, 23 Matr3S85C/S85C, **p = 0.0057; 20 weeks: n = 17 Matr3+/+, 27 Matr3S85C/+, 22 Matr3S85C/S85C ****p < 0.0001; 30 weeks: 17 Matr3+/+, 27 Matr3S85C/+, 22 Matr3S85C/S85C, ***p = 0.0001). c Rearing time (time standing on hind limbs) was measured using Open-field analysis (10 weeks: 21 Matr3+/+, 22 Matr3S85C/+, 18 Matr3S85C/S85C, **p = 0.0027; 20 weeks: 20 Matr3+/+, 19 Matr3S85C/+, 16 Matr3S85C/S85C, ****p < 0.0001; 30 weeks: 21 Matr3+/+, 22 Matr3S85C/+, 14 Matr3S85C/S85C, **p = 0.0044). d, e Muscle strength was tested using the inverted grid test at d 30 weeks of age (n = 21 Matr3+/+, 23 Matr3S85C/+, 15 Matr3S85C/S85C, *p = 0.0146) and e 55 weeks of age (n = 17 Matr3+/+, 25 Matr3S85C/+, 22 Matr3S85C/S85C, **p = 0.0088). f Delayed righting reflex was measured as the time an animal takes to right itself after being flipped on each side (40 weeks: n = 13 Matr3+/+, 11 Matr3S85C/+, 7 Matr3S85C/S85C, *p = 0.0102; 50 weeks: n = 21 Matr3+/+, 23 Matr3S85C/+, 16 Matr3S85C/S85C, ***p = 0.0006; 60 weeks: 20 Matr3+/+, 25 Matr3S85C/+, 17 Matr3S85C/S85C, ****p < 0.0001). g Representative image of the footprint analysis for homozygous S85C and wild-type mice. The hind-limb stride length (mm) was measured for five consecutive steps, for two replicates per mouse and three mice per genotype. h Example of a homozygous S85C knock-in mouse dragging its hind limb. Graph shows percentage of end-stage animals exhibiting hind-limb dragging (n = 7 Matr3+/+, 8 Matr3S85C/+, 7 Matr3S85C/S85C, *p = 0.0113). i Graph shows the number of times the mice drag their hind limbs in a 3 min time span (n = 4 Matr3+/+, 4 Matr3S85C/+, 4 Matr3S85C/S85C, ***p = 0.0001). Data shown in a to i are displayed as mean ± SEM. A single dot represents a single animal in bi. Significance was determined using an unpaired two-tailed t-test. Source data are provided as a Source Data file.
Fig. 4
Fig. 4. A striking loss of Purkinje cells in homozygous S85C mice.
a Representative images of the whole cerebellum (upper row) and magnified images of calbindin-positive Purkinje cells (bottom row) of 6-week-old mice. Scale bars indicate 800 µm (upper row) and 50 µm (bottom row). b, c Graphs show (b) cerebellum size (n = 3 Matr3+/+, 3 Matr3S85C/+, 3 Matr3S85C/S85C, ns = not significant) and (c) the total number of calbindin-positive Purkinje cells in the whole cerebellum (n = 3 Matr3+/+, 3 Matr3S85C/+, 3 Matr3S85C/S85C, ns = not significant) of 6-week-old mice. d Representative images of the whole cerebellum (upper row) and magnified images of calbindin-positive Purkinje cells (bottom row) of endpoint mice (or over 60 weeks of age). Scale bars indicate 800 µm (upper row) and 50 µm (bottom row). e, f Graphs show (e) cerebellum size (n = 3 Matr3+/+, 3 Matr3S85C/+, 3 Matr3S85C/S85C, *p = 0.0194) and (f) the total number of calbindin-positive Purkinje cells in the whole cerebellum (n = 3 Matr3+/+, 3 Matr3S85C/+, 3 Matr3S85C/S85C, **p = 0.0015) of endpoint mice. Data shown in b, c, e and f are displayed as mean ± SEM and each dot represents a single animal. Significance was determined by unpaired two-tailed t-test. Source data are provided as a Source Data file.
Fig. 5
Fig. 5. Neuromuscular junction defects in homozygous S85C mice at endpoint.
a Representative images of lower lumbar spinal cords (L4–L6) with magnified images showing ChAT-and NeuN-positive α-motor neurons (MNs) and ChAT-positive, NeuN-negative γ-MNs in the ventral horns of the spinal cord. Scale bars indicate 500 µm (left column) and 100 µm (magnified images). b Graph shows the number of α- and γ-MNs in the lumbar spinal cord at disease end-stage (n = 10 Matr3+/+, 10 Matr3S85C/+, 13 Matr3S85C/S85C). c Images showing synaptophysin and synapsin staining of presynaptic terminals, neurofilament H staining of presynaptic axons and α-bungarotoxin (BTX) staining of post-synaptic terminals in the TA muscles at end-stage. White arrows indicate partially denervated NMJs. Scale bar indicates 50 µm. d Graph shows the percentage of partially denervated NMJs (n = 3 Matr3+/+, 3 Matr3S85C/S85C, **p = 0.0053). e Representative images showing synaptophysin and synapsin staining of presynaptic terminals, neurofilament H staining of presynaptic axons and α-bungarotoxin staining of post-synaptic terminals in the TA muscles at end-stage. White arrow indicates axonal bleb proximal to the NMJ. Scale bar indicates 50 µm. f Graph shows the percentage of neurofilament-positive axon swelling (n = 9 Matr3+/+, 9 Matr3S85C/S85C, **p = 0.0017). g Representative images showing α-bungarotoxin staining of endplates in the TA muscles at end-stage. Scale bar indicates 60 µm. h Graph shows average TA endplate size (n = 6 Matr3+/+, 7 Matr3S85C/S85C, **p = 0.0019). Data shown in b, d, f and h are displayed as mean ± SEM and each dot represents a single animal. Significance was determined by unpaired two-tailed t-test. Source data are provided as a Source Data file.
Fig. 6
Fig. 6. Reduced MATR3 immunoreactivity in the nucleus of Purkinje cells and α-motor neurons in homozygous S85C knock-in mice.
a, b Representative images showing MATR3 (green) localization and levels (detected with MATR3-C antibody) in the calbindin-positive Purkinje cells (red) and other cells in the cerebellum in mice at (a) disease end-stage and at (b) 6 weeks. Scale bars indicate 30 µm. White arrows in a indicate MATR3 loss in Purkinje cells in homozygous S85C mouse. c, d Graphs show the percentage of calbindin-positive Purkinje cells with reduced MATR3 staining in c at disease end-stage (n = 3 Matr3+/+, 3 Matr3S85C/+, 3 Matr3S85C/S85C, ****p < 0.0001) and in d at 6 weeks old (n = 3 Matr3+/+, 3 Matr3S85C/+, 3 Matr3S85C/S85C, ****p < 0.0001). e Representative images showing MATR3 (green) staining (detected with MATR3-N antibody) in ChAT-positive only γ-MNs or ChAT-positive and NeuN-positive α-MNs in the ventral horn of the lumbar spinal cord at disease end-stage. Yellow arrow indicates γ-MN and white arrow indicates α-MN. White asterisks indicate α-MNs with reduced MATR3 staining. Scale bar indicates 50 µm. f, g Graphs show the percentage of f α-MNs (n = 10 Matr3+/+, 10 Matr3S85C/+, 13 Matr3S85C/S85C, ****p < 0.0001) and g γ-MNs (n = 10 Matr3+/+, 10 Matr3S85C/+, 13 Matr3S85C/S85C, ns = not significant) with reduced MATR3 staining. h Images showing MATR3 staining (detected by SC-81318 antibody) in ChAT-positive MNs in the ventral horn of the lumbar spinal cord at disease end-stage. White arrows and insets show MNs with reduced MATR3 staining or MATR3-positive nuclear inclusions. Scale bar indicates 30 µm. i Graph shows the percentage of α-MNs with nuclear MATR3 inclusions (n = 10 Matr3+/+, 10 Matr3S85C/+, 13 Matr3S85C/S85C, ****p < 0.0001). Data shown in c, d, f, g, and i are displayed as mean ± SEM and each dot represents a single animal. Significance was determined by unpaired two-tailed t-test. Source data are provided as a Source Data file.
Fig. 7
Fig. 7. Upregulation of immune response genes in homozygous S85C mice at early disease stage.
ac Volcano plots showing differentially expressed genes in the a cerebellum, b spinal cord, and c cortex of wild-type and homozygous S85C mice at 8–10 weeks old. FDR p < 0.05, absolute fold change (abs(FC)) > 1.5. The top five genes with significant expression changes are labeled with gene names. c In the cortex, no genes are significantly differentially expressed including immune response genes. d, e GO analysis for upregulated (red) or downregulated (blue) genes in the d cerebellum and e spinal cord. f Representative images showing IBA1 and GFAP staining of the cerebellum at 30 weeks of age. Scale bars indicates 300 µm. g, h Graphs show the integrated density of g IBA1 (n = 3 Matr3+/+, 3 Matr3S85C/+, 3 Matr3S85C/S85C, *p = 0.023) and h GFAP (n = 3 Matr3+/+, 3 Matr3S85C/+, 3 Matr3S85C/S85C, *p = 0.0157) staining in the cerebellum at 30 weeks old. Data shown in g and h are displayed as mean ± SEM and each dot represents a single animal. Significance was determined by unpaired two-tailed t-test. Source data are provided as a Source Data file.
Fig. 8
Fig. 8. Timeline of disease progression of homozygous S85C mice.
Homozygous S85C mice show motor impairments starting at around 10 weeks of age, progressively worsen with age and reach endpoint at around 60 weeks of age. These mutant mice also exhibit neuroinflammation, Purkinje cell loss and NMJ defects.

Similar articles

Cited by

References

    1. Saxena S, Caroni P. Selective neuronal vulnerability in neurodegenerative diseases: from stressor thresholds to degeneration. Neuron. 2011;71:35–48. doi: 10.1016/j.neuron.2011.06.031. - DOI - PubMed
    1. Fu H, Hardy J, Duff KE. Selective vulnerability in neurodegenerative diseases. Nat. Neurosci. 2018;21:1350–1358. doi: 10.1038/s41593-018-0221-2. - DOI - PMC - PubMed
    1. Rowland LP, Shneider NA. Amyotrophic lateral sclerosis. N. Engl. J. Med. 2001;344:1688–1700. doi: 10.1056/NEJM200105313442207. - DOI - PubMed
    1. Pun S, Santos AF, Saxena S, Xu L, Caroni P. Selective vulnerability and pruning of phasic motoneuron axons in motoneuron disease alleviated by CNTF. Nat. Neurosci. 2006;9:408–419. doi: 10.1038/nn1653. - DOI - PubMed
    1. Fischer LR, et al. Amyotrophic lateral sclerosis is a distal axonopathy: evidence in mice and man. Exp. Neurol. 2004;185:232–240. doi: 10.1016/j.expneurol.2003.10.004. - DOI - PubMed

Publication types

Substances