. 2021 May;236(5):3579-3598.
doi: 10.1002/jcp.30113. Epub 2020 Oct 20.

Cancer-associated mutations in the condensin II subunit CAPH2 cause genomic instability through telomere dysfunction and anaphase chromosome bridges

Affiliations

Cancer-associated mutations in the condensin II subunit CAPH2 cause genomic instability through telomere dysfunction and anaphase chromosome bridges

Emily Weyburne et al. J Cell Physiol. 2021 May.

Abstract

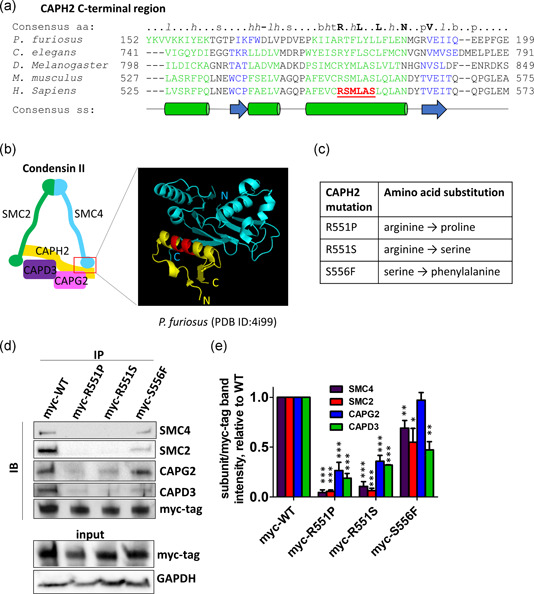
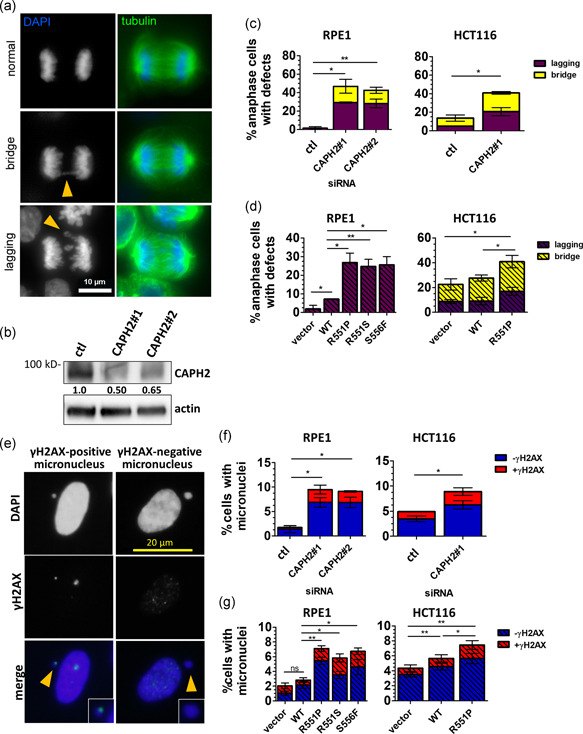
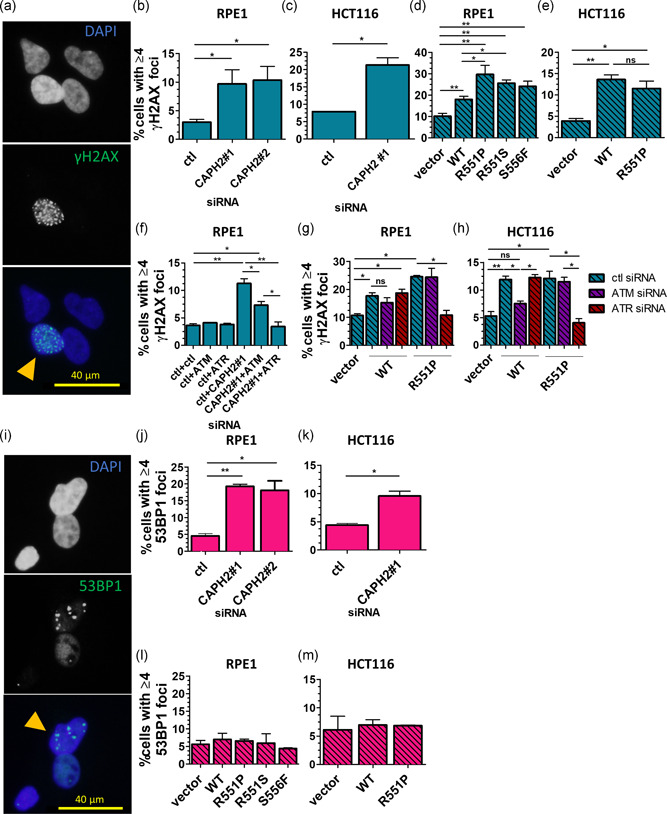
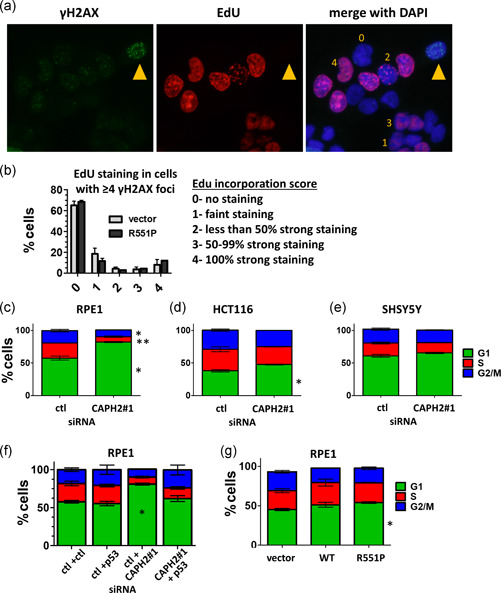
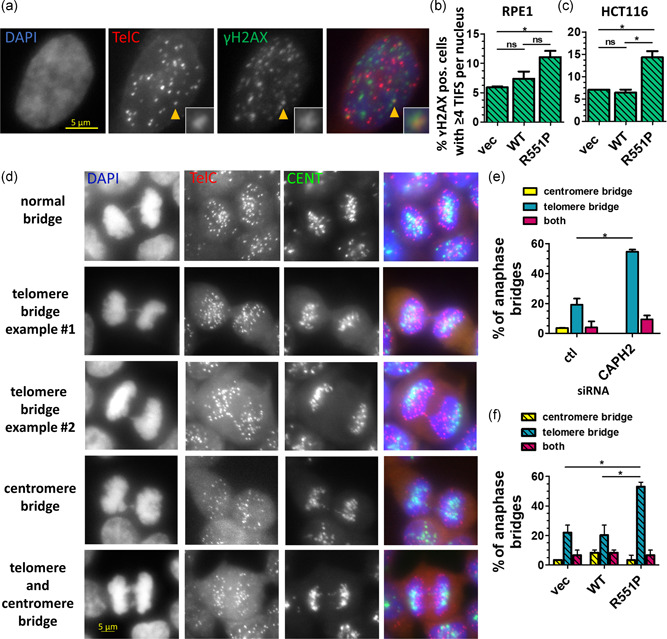
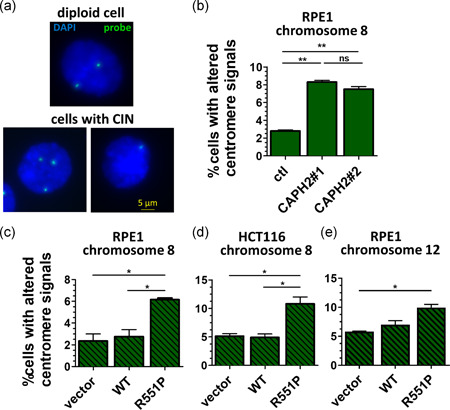
Genome instability in cancer drives tumor heterogeneity, undermines the success of therapies, and leads to metastasis and recurrence. Condensins are conserved chromatin-binding proteins that promote genomic stability, mainly by ensuring proper condensation of chromatin and mitotic chromosome segregation. Condensin mutations are found in human tumors, but it is not known how or even if such mutations promote cancer progression. In this study, we focus on condensin II subunit CAPH2 and specific CAPH2 mutations reported to be enriched in human cancer patients, and we test how CAPH2 cancer-specific mutations may lead to condensin II complex dysfunction and contribute to genome instability. We find that R551P, R551S, and S556F mutations in CAPH2 cause genomic instability by causing DNA damage, anaphase defects, micronuclei, and chromosomal instability. DNA damage and anaphase defects are caused primarily by ataxia telangiectasia and Rad3-related-dependent telomere dysfunction, as anaphase bridges are enriched for telomeric repeat sequences. We also show that these mutations decrease the binding of CAPH2 to the ATPase subunit SMC4 as well as the rest of the condensin II complex, and decrease the amount of CAPH2 protein bound to chromatin. Thus, in vivo the R551P, R551S, and S556F cancer-specific CAPH2 mutant proteins are likely to impair condensin II complex formation, impede condensin II activity during mitosis and interphase, and promote genetic heterogeneity in cell populations that can lead to clonal outgrowth of cancer cells with highly diverse genotypes.

Keywords: DNA damage; anaphase bridge; condensin; genome instability; telomere.


Conflict of interest statement

The authors declare that there are no conflicts of interests.

Figures

Figure 1
Figure 1
R551P, R551S, and S556F mutations in CAPH2 are located in the α‐helix that binds SMC4 and cause decreased binding of CAPH2 to other condensin II subunits. (a) Multisequence alignment of a C‐terminal region of CAPH2. The region containing a significant cluster of missense mutations is indicated in red. Green cylinders indicate α‐helices, blue arrows indicate β‐sheets. (b) Crystal structure of the Smc Head (blue) bound to the winged‐helix domain of ScpA (yellow) in Pyrococcus furiosus. The region containing a significant cluster of missense mutations is indicated in red. (c) R551P, R551S, and S556F amino acid substitutions. (d) RPE1 cells were transfected with myc‐tagged mutant or wild‐type (WT) CAPH2 constructs. Cells were harvested after 24 h, coimmunoprecipitation (co‐IPs) was performed with myc‐tag antibody, and the lysates were immunoblotted. (e) Quantification of immunoblots. Two–three co‐IPs were performed per construct and averaged. aa, amino acid; ss, secondary structure. *p < .05, **p < .01, ***p < .001, two‐tailed unpaired t‐test. Error bars = SEM
Figure 2
Figure 2
R551P mutant CAPH2 protein exhibits decreased protein stability and decreased binding to chromatin. (a) Expression construct used to express CAPH2 and EGFP. Both CAPH2 and EGFP are expressed separately from the same messenger RNA transcript, allowing the use of EGFP as a normalization factor for CAPH2 transcription. (b) RPE1 cells were harvested 24 h after plasmid transfection of expression constructs, and soluble fraction lysates were immunoblotted. (c) Quantification of soluble fraction myc‐tag band intensity normalized to EGFP band intensity, relative to wild‐type (WT). (d) Immunoblots of the chromatin‐bound fraction. (e–i) Quantification of chromatin fraction band intensities normalized to histone H3 band intensity, relative to WT. Two or three westerns were averaged in each quantification. *p < .05, **p < .01, ***p < .001, two‐tailed unpaired t‐test. Error bars = SEM
Figure 3
Figure 3
Expression of R551P, R551S, and S556F CAPH2 proteins causes anaphase defects and micronuclei. (a) Representative immunofluorescence microscopy images of anaphase defects in HCT116 cells. Yellow arrowheads mark defects. (b) HCT116 cells were transfected with small interfering RNA (siRNA), harvested after 48, and immunoblotted. (c, d) Quantification of anaphase defects in either RPE1 or HCT116 cells transfected with siRNA (c) or expression constructs (d) and fixed at 48 h. (e) Representative immunofluorescence microscopy images of micronuclei. Yellow arrowheads mark micronuclei. (f, g) Quantification of micronuclei in RPE1 or HCT116 cells transfected with siRNA (f) or expression constructs (g) and fixed at 48 h. To aid visualization, graphs with siRNA knockdown are depicted with open bars and graphs with CAPH2 overexpression are depicted with diagonal crosshatches. Statistics were performed for the overall number of anaphase defects or micronuclei, disregarding the type of defect or γH2AX positivity. See Figure S4 for additional significance tests not displayed on graphs. DAPI, 4′,6‐diamidino‐2‐phenylindole; WT, wild‐type. *p < .05, **p < .01, ***p < .001, two‐tailed unpaired t‐test. Error bars = SEM
Figure 4
Figure 4
Expression of R551P, R551S, and S556F CAPH2 proteins causes DNA damage. (a) Representative immunofluorescence microscopy images of γH2AX foci. Yellow arrowheads mark cells with ≥4 foci. (b, c) Quantification of γH2AX foci in RPE1 (b) or HCT116 (c) cells transfected with small interfering RNA (siRNA) and fixed at 48 h. (d, e) Quantification of γH2AX foci in RPE1 (d) or HCT116 (e) cells transfected with expression constructs and fixed at 48 h. (f) Quantification of γH2AX foci in RPE1 cells transfected with two siRNAs. Cells were fixed 48 h posttransfection. (g, h) Quantification of γH2AX foci in RPE1 (g) or HCT116 (h) cells transfected with one siRNA (indicated by bar color) and one expression construct. Cells were fixed 48 h posttransfection. (i) Example immunofluorescence microscopy images of 53BP1 foci. Yellow arrowheads mark cells with ≥4 foci. (j, k) Quantification of 53BP1 foci in RPE1 (j) or HCT116 (k) cells transfected with siRNA and fixed at 48 h. (l, m) Quantification of 53BP1 foci in RPE1 (l) or HCT116 (m) cells transfected with expression constructs and fixed at 48 h. To aid visualization, graphs with siRNA knockdown are depicted with open bars and graphs with CAPH2 overexpression are depicted with diagonal crosshatches. See Figure S5 for additional significance tests not displayed on graphs. DAPI, 4′,6‐diamidino‐2‐phenylindole; WT, wild‐type. *p < .05, **p < .01, ***p < .001, two‐tailed unpaired t‐test. Error bars = SEM
Figure 5
Figure 5
R551P CAPH2 causes DNA damage outside of S‐phase. (a) Representative immunofluorescence microscopy images of 5‐ethynyl‐2′‐deoxyuridine (EdU) staining and γH2AX foci in RPE1 cells. Yellow arrowhead marks a cell with ≥4 γH2AX foci. Yellow numbers are example scores for the quantitation system described in (b). b) Quantification of EdU staining in RPE1 cells with ≥4γH2AX foci. Cells were transfected with expression constructs, and pulsed with EdU for 30 min immediately before fixation at 48 h after transfection. EdU staining was scored from 0 to 4 using the indicated system, where 0 = no detectable EdU incorporation (arrowhead) and 4 = 100% of the nucleus exhibits EdU labeling. (c–e) Cell cycle analysis. Cells were transfected with small interfering RNA (siRNA) and fixed after 4d, DNA was stained with propidium iodide and DNA content was determined with flow cytometry. (f) Cell cycle analysis was performed as above in (c–e) in RPE1 cells transfected with two siRNAs. (g) Cell cycle analysis was performed as above in (c–e) in RPE1 cells transfected with expression constructs. *p < .05, **p < .01, ***p < .001, two‐tailed unpaired t‐test. Error bars = SEM
Figure 6
Figure 6
Expression of R551P CAPH2 causes an increase in damaged telomeres and an increase in telomere‐containing anaphase bridges. (a) Representative immunofluorescence microscopy images of IF‐fluorescence in situ hybridization (IF‐FISH) in RPE1 cells. (b, c) Quantification of telomere dysfunction‐induced foci (TIFs) from IF‐FISH. Cells were fixed 48 h after transfection with expression constructs, labeled with a telomere FISH probe (TelC), and probed for γH2AX. Only cells with ≥4γH2AX foci were quantified and represented in the graph. Two biological replicates were performed for each condition, and 70 cells were counted per biological replicate. See Figure S6 for a histogram of the number of TIFs per nucleus. (d) Representative immunofluorescence microscopy images of centromere and telomere FISH in HCT116 cells. Note example number 2 contains multiple telomere signals. (e, f) Quantification of anaphase bridges with centromere or telomere spots from FISH in HCT116 cells. Cells were fixed 48 h after transfection with siRNA (d) or expression constructs (e) and labeled with telomere (TelC) or centromere (CENT) FISH probes. Only cells with anaphase bridges were quantified and represented in the graph. Two biological replicates were performed for each condition, and 30 cells were counted per biological replicate. To aid visualization, graphs with siRNA knockdown are depicted with open bars and graphs with CAPH2 overexpression are depicted with diagonal crosshatches. DAPI, 4′,6‐diamidino‐2‐phenylindole; WT, wild‐type. *p < .05, **p < .01, ***p < .001, two‐tailed unpaired t‐test. Error bars = SEM
Figure 7
Figure 7
Expression of R551P CAPH2 causes an increase in cells exhibiting chromosomal instability (CIN). (a) Representative DNA fluorescence in situ hybridization (FISH) images. DNA FISH was performed with a probe for a centromeric α‐satellite region of chromosome 8. Cells with two probe spots were scored as unaltered disomic, and cells with one or three or more probe spots were scored as exhibiting CIN. (b–e) Quantification of cells with altered centromere signals for indicated chromosome in cells with small interfering RNA (siRNA) knockdown of CAPH2 (b) or cells with overexpression of wild‐type (WT) and mutant CAPH2 (c–e). To aid visualization, graphs with siRNA knockdown are depicted with open bars and graphs with CAPH2 overexpression are depicted with diagonal crosshatches. Two–three biological replicates were performed for each condition, with at least 100 cells counted per biological replicate. DAPI, 4′,6‐diamidino‐2‐phenylindole. *p < .05, **p < .01, ***p < .001, two‐tailed unpaired t‐test. Error bars = SEM

Similar articles

Cited by

References

    1. Aalbers, A. M. , Kajigaya, S. , van den Heuvel‐Eibrink, M. M. , van der Velden, V. H. J. , Calado, R. T. , & Young, N. S. (2012). Human telomere disease due to disruption of the CCAAT box of the TERC promoter. Blood, 119, 3060–3063. - PMC - PubMed
    1. d'Adda di Fagagna, Reaper, P. M. , Clay‐Farrace, L. , Fiegler, H. , Carr, P. , Von Zglinicki, T. , Saretzki, G. , Carter, N. P. , & Jackson, S. P. (2003). A DNA damage checkpoint response in telomere‐initiated senescence. Nature, 426, 194–198. - PubMed
    1. Baergen, A. K. , Jeusset, L. M. , Lichtensztejn, Z. , & McManus, K. J. (2019). Diminished condensin gene expression drives chromosome instability that may contribute to colorectal cancer pathogenesis. Cancers (Basel), 11(8), 1066. - PMC - PubMed
    1. Bakhoum, S. F. , & Landau, D. A. (2017). Chromosomal instability as a driver of tumor heterogeneity and evolution. Cold Spring Harbor Perspectives in Medicine, 7, a029611. - PMC - PubMed
    1. Bakr, A. , Oing, C. , Kocher, S. , Borgmann, K. , Dornreiter, I. , Petersen, C. , Dikomey, E. , & Mansour, W. Y. (2015). Involvement of ATM in homologous recombination after end resection and RAD51 nucleofilament formation. Nucleic Acids Research, 43, 3154–3166. - PMC - PubMed

Publication types

MeSH terms

LinkOut - more resources