Comparison of transgenic and adenovirus hACE2 mouse models for SARS-CoV-2 infection
- PMID: 33073694
- PMCID: PMC7655046
- DOI: 10.1080/22221751.2020.1838955
Comparison of transgenic and adenovirus hACE2 mouse models for SARS-CoV-2 infection
Abstract
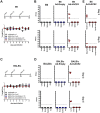
Severe acute respiratory syndrome CoV-2 (SARS-CoV-2) is currently causing a worldwide pandemic with high morbidity and mortality. Development of animal models that recapitulate important aspects of coronavirus disease 2019 (COVID-19) is critical for the evaluation of vaccines and antivirals, and understanding disease pathogenesis. SARS-CoV-2 has been shown to use the same entry receptor as SARS-CoV-1, human angiotensin-converting enzyme 2 (hACE2) [1-3]. Due to amino acid differences between murine and hACE2, inbred mouse strains fail to support high titer viral replication of SARS-CoV-2 virus. Therefore, a number of transgenic and knock-in mouse models, as well as viral vector-mediated hACE2 delivery systems have been developed. Here we compared the K18-hACE2 transgenic model to adenovirus-mediated delivery of hACE2 to the mouse lung. We show that K18-hACE2 mice replicate virus to high titers in the nasal turbinates, lung and brain, with high lethality, and cytokine/chemokine production. In contrast, adenovirus-mediated delivery results in viral replication to lower titers limited to the nasal turbinates and lung, and no clinical signs of infection. The K18-hACE2 model provides a stringent model for testing vaccines and antivirals, whereas the adenovirus delivery system has the flexibility to be used across multiple genetic backgrounds and modified mouse strains.
Keywords: ACE2; COVID-19; SARS-CoV-2; adenovirus; mouse models.
Conflict of interest statement
No potential conflict of interest was reported by the author(s).
Figures


Update of
-
Comparison of Transgenic and Adenovirus hACE2 Mouse Models for SARS-CoV-2 Infection.bioRxiv [Preprint]. 2020 Jul 6:2020.07.06.190066. doi: 10.1101/2020.07.06.190066. bioRxiv. 2020. Update in: Emerg Microbes Infect. 2020 Dec;9(1):2433-2445. doi: 10.1080/22221751.2020.1838955. PMID: 32676603 Free PMC article. Updated. Preprint.
Similar articles
-
Comparison of Transgenic and Adenovirus hACE2 Mouse Models for SARS-CoV-2 Infection.bioRxiv [Preprint]. 2020 Jul 6:2020.07.06.190066. doi: 10.1101/2020.07.06.190066. bioRxiv. 2020. Update in: Emerg Microbes Infect. 2020 Dec;9(1):2433-2445. doi: 10.1080/22221751.2020.1838955. PMID: 32676603 Free PMC article. Updated. Preprint.
-
SARS-CoV-2 infection of human ACE2-transgenic mice causes severe lung inflammation and impaired function.Nat Immunol. 2020 Nov;21(11):1327-1335. doi: 10.1038/s41590-020-0778-2. Epub 2020 Aug 24. Nat Immunol. 2020. PMID: 32839612 Free PMC article.
-
Mouse model of SARS-CoV-2 reveals inflammatory role of type I interferon signaling.J Exp Med. 2020 Dec 7;217(12):e20201241. doi: 10.1084/jem.20201241. J Exp Med. 2020. PMID: 32750141 Free PMC article.
-
SARS-CoV replication and pathogenesis in an in vitro model of the human conducting airway epithelium.Virus Res. 2008 Apr;133(1):33-44. doi: 10.1016/j.virusres.2007.03.013. Epub 2007 Apr 23. Virus Res. 2008. PMID: 17451829 Free PMC article. Review.
-
COVID-19 preclinical models: human angiotensin-converting enzyme 2 transgenic mice.Hum Genomics. 2020 Jun 4;14(1):20. doi: 10.1186/s40246-020-00272-6. Hum Genomics. 2020. PMID: 32498696 Free PMC article. Review.
Cited by
-
SARS-CoV-2 Rapidly Infects Peripheral Sensory and Autonomic Neurons, Contributing to Central Nervous System Neuroinvasion before Viremia.Int J Mol Sci. 2024 Jul 28;25(15):8245. doi: 10.3390/ijms25158245. Int J Mol Sci. 2024. PMID: 39125815 Free PMC article.
-
Protection of K18-hACE2 Mice against SARS-CoV-2 Challenge by a Capsid Virus-like Particle-Based Vaccine.Vaccines (Basel). 2024 Jul 12;12(7):766. doi: 10.3390/vaccines12070766. Vaccines (Basel). 2024. PMID: 39066404 Free PMC article.
-
Evaluation of two inoculation routes of an adenovirus-mediated viral protein inhibitor in a Crimean-Congo hemorrhagic fever mouse model.Virus Res. 2024 Jul;345:199398. doi: 10.1016/j.virusres.2024.199398. Epub 2024 May 20. Virus Res. 2024. PMID: 38754786 Free PMC article.
-
The lethal K18-hACE2 knock-in mouse model mimicking the severe pneumonia of COVID-19 is practicable for antiviral development.Emerg Microbes Infect. 2024 Dec;13(1):2353302. doi: 10.1080/22221751.2024.2353302. Epub 2024 May 26. Emerg Microbes Infect. 2024. PMID: 38753462 Free PMC article.
-
A measles-vectored vaccine candidate expressing prefusion-stabilized SARS-CoV-2 spike protein brought to phase I/II clinical trials: candidate selection in a preclinical murine model.J Virol. 2024 May 14;98(5):e0169323. doi: 10.1128/jvi.01693-23. Epub 2024 Apr 2. J Virol. 2024. PMID: 38563763 Free PMC article.
References
-
- Li F, Li W, Farzan M, et al. . Structure of SARS coronavirus spike receptor-binding domain complexed with receptor. Science. 2005;309:1864–1868. - PubMed
Publication types
MeSH terms
Substances
Grants and funding
LinkOut - more resources
Full Text Sources
Other Literature Sources
Molecular Biology Databases
Miscellaneous

