. 2020;2(1):17.
doi: 10.1186/s42522-020-00024-5. Epub 2020 Sep 18.

Controlling emerging zoonoses at the animal-human interface

Affiliations

Controlling emerging zoonoses at the animal-human interface

Riley O Mummah et al. One Health Outlook. 2020.

Abstract

Background: For many emerging or re-emerging pathogens, cases in humans arise from a mixture of introductions (via zoonotic spillover from animal reservoirs or geographic spillover from endemic regions) and secondary human-to-human transmission. Interventions aiming to reduce incidence of these infections can be focused on preventing spillover or reducing human-to-human transmission, or sometimes both at once, and typically are governed by resource constraints that require policymakers to make choices. Despite increasing emphasis on using mathematical models to inform disease control policies, little attention has been paid to guiding rational disease control at the animal-human interface.

Methods: We introduce a modeling framework to analyze the impacts of different disease control policies, focusing on pathogens exhibiting subcritical transmission among humans (i.e. pathogens that cannot establish sustained human-to-human transmission). We quantify the relative effectiveness of measures to reduce spillover (e.g. reducing contact with animal hosts), human-to-human transmission (e.g. case isolation), or both at once (e.g. vaccination), across a range of epidemiological contexts.

Results: We provide guidelines for choosing which mode of control to prioritize in different epidemiological scenarios and considering different levels of resource and relative costs. We contextualize our analysis with current zoonotic pathogens and other subcritical pathogens, such as post-elimination measles, and control policies that have been applied.

Conclusions: Our work provides a model-based, theoretical foundation to understand and guide policy for subcritical zoonoses, integrating across disciplinary and species boundaries in a manner consistent with One Health principles.

Keywords: Cross-species spillover transmission; Emerging infectious diseases; Epidemiological control; Human-to-human transmission; Infectious disease dynamics; Stuttering zoonoses; Subcritical zoonoses.


Conflict of interest statement

Competing interestsThe authors declare no competing interests.

Figures

Fig. 1
Fig. 1
The expected source of infection for cases is determined by the reproductive number for human-to-human transmission
Fig. 2
Fig. 2
The cost function for control measures. The solid black line indicates equal cost between implementing spillover control and reducing human-to-human transmission. The x-axis shows an arbitrary scale of resource investment. The dashed and dotted lines show a 2-fold and 10-fold difference, respectively, in the costs of the two control measures. Each line is marked by the relative cost of reducing spillover by a given proportion compared to the cost of reducing human-to-human transmission by the same proportion
Fig. 3
Fig. 3
Impacts of different control measures on incidence of a zoonotic infection with initial value of R (i.e. before control) between 0 and 1. Panel a illustrates the effects of control on the total incidence expected in a focal population, whereas panel b shows the proportional reduction in expected incidence when compared to the incidence level without control (black line). In a, the black line shows how the expected total incidence increases nonlinearly with R, for a fixed rate of zoonotic spillover. Colored lines show the total incidence that would result from interventions that cause 50% reductions in spillover transmission (red), human-to-human transmission (blue), or both types of transmission (purple). Green lines show the incidence resulting from a reactive intervention strategy, where effort is focused on reducing spillover transmission but is shifted to reducing human-to-human transmission once an outbreak is detected. The three green lines show the total incidence resulting when control is shifted after one, two, or three generations of transmission among humans, respectively from top to bottom
Fig. 4
Fig. 4
Impacts of control measures with varying resource investments on incidence of a zoonotic infection with R between 0 and 1. Each panel shows a different R (before control) value. The black lines show the incidence under no control. Colored lines show the change in total incidence that would result from increasing investment for interventions that cause reductions in spillover transmission (red), human-to-human transmission (blue), or both types of transmission (purple). The green line shows the incidence for increasing investment resulting from a reactive intervention strategy, where effort is focused on reducing spillover transmission but is shifted to reducing human-to-human transmission once an outbreak is detected (Detection after two generations of transmission is shown). Controls measures targeting spillover transmission are assumed to be equally costly as measures targeting human-to-human transmission, i.e. α = 1
Fig. 5
Fig. 5
Policy guidance whether incidence will be reduced more by focusing on reducing spillover transmission or human-to-human transmission, for different values of R (before control) and the reduction in spillover that is achievable given resource constraints. The solid line shows the boundary between preferred strategies when costs of the two types of control are equal, as defined by Eq. (5). The dashed and dotted lines show how the boundary shifts due to differences in relative cost (each line is labeled by the relative cost of reducing spillover by a given proportion compared to the cost of reducing R by the same proportion)
Fig. 6
Fig. 6
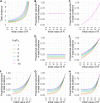
Impacts of different control measures on the total incidence of a zoonotic infection with R (before control) between 0 and 1 with a varying ratio of high and low spillover rates. Panel a shows how total incidence increases with R for varying ratios of high-to-low zoonotic spillover. Panels b-e illustrate proportional reduction in incidence for controls that would cause 50% reductions in all spillover transmission (b), human-to-human transmission (c), spillover transmission into the high-risk group (d), or jointly high-risk spillover and human-to-human transmission (e). Panels f-h show the proportional reduction in incidence given a reactive strategy that first targets high-risk spillover and then switches to reducing human-to-human transmission after 1, 2, or 3 generations of transmission, respectively. Note that longer delays cause the results to resemble Panel d over increasing ranges of R values, since at low R many transmission chains don’t last multiple generations. The proportion of high-risk individuals in the population was set to 0.10
Fig. 7
Fig. 7
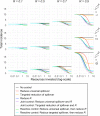
Impacts of different control measures with varying resource investment on the total incidence of a zoonotic infection with R (before control) between 0 and 1 with different ratios of high-to-low spillover rates. Columns (left to right) show increasing values of R. Rows (top to bottom) represent an increasing ratio of spillover rates in high-risk versus low-risk groups (λH/λL). The black lines indicate total incidence under no control. Colored lines represent the reduction in incidence for increasing resource investment. These scenarios were explored earlier in Fig. 4 but now include the added comparison of targeted versus universal spillover control for all strategies

Similar articles

Cited by

References

    1. Karesh WB, Dobson A, Lloyd-Smith JO, Lubroth J, Dixon MA, Bennett M, et al. Ecology of zoonoses: natural and unnatural histories. Lancet. 2012;380(9857):1936–1945. - PMC - PubMed
    1. Plowright RK, Parrish CR, McCallum H, Hudson PJ, Ko AI, Graham AL, et al. Pathways to zoonotic spillover. Nat Rev Microbiol. 2017;15(8):502–510. - PMC - PubMed
    1. Loh EH, Zambrana-Torrelio C, Olival KJ, Bogich TL, Johnson CK, Mazet JAK, et al. Targeting transmission pathways for emerging zoonotic disease surveillance and control. Vector Borne Zoonotic Dis. 2015;15(7):432–437. - PMC - PubMed
    1. McMahon BJ, Morand S, Gray JS. Ecosystem change and zoonoses in the Anthropocene. Zoonoses Public Health. 2018;65(7):755–765. - PubMed
    1. Kreuder Johnson C, Hitchens PL, Smiley Evans T, Goldstein T, Thomas K, Clements A, et al. Spillover and pandemic properties of zoonotic viruses with high host plasticity. Sci Rep. 2015;5:1–8. - PMC - PubMed