. 2020 Oct 16;11(1):5225.
doi: 10.1038/s41467-020-19095-z.

Metformin enhances anti-mycobacterial responses by educating CD8+ T-cell immunometabolic circuits

Affiliations

Metformin enhances anti-mycobacterial responses by educating CD8+ T-cell immunometabolic circuits

Julia Böhme et al. Nat Commun. .

Abstract

Patients with type 2 diabetes (T2D) have a lower risk of Mycobacterium tuberculosis infection, progression from infection to tuberculosis (TB) disease, TB morality and TB recurrence, when being treated with metformin. However, a detailed mechanistic understanding of these protective effects is lacking. Here, we use mass cytometry to show that metformin treatment expands a population of memory-like antigen-inexperienced CD8+CXCR3+ T cells in naive mice, and in healthy individuals and patients with T2D. Metformin-educated CD8+ T cells have increased (i) mitochondrial mass, oxidative phosphorylation, and fatty acid oxidation; (ii) survival capacity; and (iii) anti-mycobacterial properties. CD8+ T cells from Cxcr3-/- mice do not exhibit this metformin-mediated metabolic programming. In BCG-vaccinated mice and guinea pigs, metformin enhances immunogenicity and protective efficacy against M. tuberculosis challenge. Collectively, these results demonstrate an important function of CD8+ T cells in metformin-derived host metabolic-fitness towards M. tuberculosis infection.


Conflict of interest statement

The authors declare no competing interests.

Figures

Fig. 1
Fig. 1. Metformin-educated CD8+ T cells protect against M. tuberculosis.
a Experimental strategy and assessed readouts. b, c Bacterial load in the lung of recipient mice 21 days post transfer, from two different experiments. No transfer—Irradiated recipients that did not receive any cells. Metformin-educated—CD4+ or CD8+ cells from donor mice treated with metformin; Control—cells from untreated mice. n = 5–6 mice/group/experiment. d Flow cytometric analysis of splenic CD8+ T cells from mice of experiment 1 b. TM - memory T cells, CD44+CD62L+; TE effector T cells, CD44+CD62L; TN - naive T cells, CD44CD62L+. e Frequency and number of CD8+ TE, TM, and TN cells in the recipient mice of experiment 1. n = 5 mice/group. f Frequency and number of IFNγ+, TNF+, or Perforin+ CD8+ TM cells from e. n = 5 mice/group. g Frequency and number of IFNγ+ and/or Perforin+ CD45.1+CD8+ TM cells in the recipient mice of experiment 2. n = 5 mice per group. Box-and-whisker plots show the median, 5 and 95 percentiles. All data are analyzed using Kruskal–Wallis test with Dunn’s multiple comparison.
Fig. 2
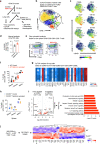
Fig. 2. Metformin treatment expands CD8+CXCR3+ TM cell population in spleen and lungs of mice.
a Experimental set-up of in vivo experiments. b Visualized t-SNE map of CD8+ T cells from spleen of wild-type (WT) mice with automated cluster gating. t-SNE was performed on live CD45+CD90+TCRαβ+CD4CD8+ cells after gating out B cells. c Normalized expression intensities of indicated marker was calculated and overlaid on the t-SNE plot, characterizing all clusters of CD8+ T cells in spleen. Means ± SD of four mice per group, one-tailed Mann–Whitney U test. d Manual gating analysis of CD8+CXCR3+ TM cells in control and metformin-treated WT mice. e, f Flow cytometric analysis of splenic CD8+ T-cell subsets from control and metformin-treated WT mice. Pooled data from three independent experiments. Means ± SD of n = 13–15 mice per group, two-tailed Mann–Whitney U test. g Heat map displaying frequency of various surface markers in lung CD8+ T cells of control and metformin-treated WT mice. n = 4. *p ≤ 0.05 by two-tailed paired t test. h Flow cytometric analysis of spleen CD8+ TE, TM, and TN cells of control and metformin-treated Cxcr3−/− mice. Data shown one out of two experiments, mean ± SD of five mice per group. i Left—volcano plot showing DEGs from RNA sequencing data of CD8+ T cells from Cxcr3−/− and WT mice. n = 5 mice/group. Right—Canonical pathway enrichment via Ingenuity pathway analysis (IPA) of 202 DEGs. j Heat map displaying the expression level of 35 FOXO1 targets in data shown in i. NS not significant.
Fig. 3
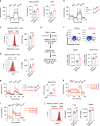
Fig. 3. Metformin promotes CD8+ T-cell SRC, mitochondrial mass, survival, and FAO.
a Oxygen consumption rate (OCR) and spare respiratory capacity (SRC) in spleen CD8+ T cells from control and metformin-treated WT mice in response to different drugs. n = 4 control mice, n = 5 metformin-treated mice. b OCR in spleen CD8+ T cells from control and metformin-treated Cxcr3−/− mice. n = 6 mice/group. c Mitotracker green staining of CD8+ T cells from control and metformin-treated WT mice. MFI - median fluorescence intensity. n = 4 mice/group. d TMRM staining of CD8+ T cells from control and metformin-treated WT mice. n = 4 mice/group. e Experimental schematic of adoptive transfer of CD8+ T cells into congenic WT mice. f Frequency of CD45.1+ cells in the spleen and lymph node of recipient mice. n = 4 mice/group. g OCR in spleen CD8+ T cells from control and metformin-treated WT mice in response to different drugs under low glucose (LG) condition in the presence and absence of palmitate. n = 5 mice/group. h, i OCR in spleen CD8+ T cells from metformin-treated WT mice in response to different drugs under LG condition in the presence of palmitate. h n = 5 mice/group; i n = 8 mice/group. j Glucose uptake (2-NBDG) in CD8+ TM cells, analyzed by flow cytometry. n = 5 mice/group. Data in a, c, d, f, g, and j are presented as mean ± SD, two-tailed Mann–Whitney U test.
Fig. 4
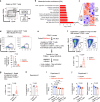
Fig. 4. Metformin reprograms gene expression of CD8+ TM cells.
a Schematic depicting sorting of CD8+ TM cells for RNA sequencing and identification of DEGs in metformin-educated CD8+ TM cells. b Molecular function enrichment via Ingenuity pathway analysis (IPA) of DEGs in a. c Heat map displaying the expression level of 86 genes related to cell death and survival. d Flow cytometric analysis of caspase-1 in splenic CD8+ T cells from Mtb-infected mice treated or not with metformin. n = 5 mice/group. e Experimental set-up for the transfer of CD8+ TM or TE cells into TCRβδ−/− mice followed by Mtb or BCG infection. Three experiments were performed. f, g Flow cytometric analysis of the frequency of CD45.1+ lung f and splenic g cells in recipient mice. n = 4 control group, n = 6 metformin group. h Bacterial load in the lung of Mtb-infected TCRβδ−/− recipient mice. i, j Bacterial load in the lung of BCG-infected TCRβδ−/− recipient mice. Data of mean ± SD of 4–5 mice per group, Kruskal–Wallis test with Dunn’s multiple correction. Data in d, f, g, and h is presented as mean ± SD, two-tailed Mann–Whitney U test.
Fig. 5
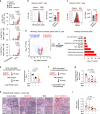
Fig. 5. Metformin promotes BCG vaccine immunogenicity and efficacy.
a PPD-specific response of spleen cells, analyzed by flow cytometry. Data on IFNγ producing CD8+ T, TM, and TE cells. n = 5 mice/group. Box-and-whisker plot show the median, 5 and 95 percentiles, one-way ANOVA with Turkey’s multiple comparison test. b, c Mitotracker green b TMRM c staining of splenic CD8+ T cells from control and metformin-treated BCG-vaccinated WT mice. b n = 4 mice/group; c n = 5 mice/group. means ± SD, Mann–Whitney U test. d Changes in gene expression in CD8+ TM cells from BCG-vaccinated mice treated or not with metformin. IPA analysis of 607 DEGs. n = 5 mice/group. e Schematic of Mtb infection of metformin-treated BCG-vaccinated mice. Lung bacillary load at 30 days post infection (p.i) is shown. n = 6 mice/group. f Schematic of Mtb infection of metformin-treated unvaccinated and BCG-vaccinated guinea pigs. g Lung bacillary load in unvaccinated and BCG-vaccinated Mtb-infected guinea pigs treated or not with metformin. n = 6–7 animals/group. h Light micrographs of hematoxylin and eosin (H&E) staining of lung sections from animals in g. Magnification for main image ×40 (scale bars, 50 μm) and insert ×100. i Morphometric analysis of lung sections shown in h indicating the mean lesion lung involvement from each guinea pig. n = 6–7 animals/group. Data in ac, e is representative of two independent experiments. Guinea pig data in g and i is from one experiment. Data in e, g, and i, means ± SD, Kruskal–Wallis test with Dunn’s multiple correction.
Fig. 6
Fig. 6. Metformin treatment expands CD8+CXCR3+ TM cell population in humans.
a Strategy of analyzing PBMCs from metformin-treated healthy individuals. b t-SNE map of human peripheral CD8+ T cells with manually cluster gating for TE, TM, and TN cells. c Normalized expression intensities of indicated markers were calculated and overlaid on the t-SNE plot, characterizing all cluster of human CD8+ T cells. d Manual gating identified differential expression of CD127 and CXCR3, distinguishing two CD8+ TM subpopulations, TM1 and TM2. e Frequency of CD8+CD127+CXCR3+ TM cells before and after metformin treatment. n = 8 subjects, analysis by Wilcoxon matched-pairs signed rank test. f Overlay plot showing expression of BCL2 in CD8+CD127+CXCR3- and CD8+CD127+CXCR3+ TM cells. BCL2 expression in CD8+ TN cells is also indicated. Data shown from one representative donor. g Flow cytometric analysis of frequency of peripheral CD8+CXCR3+ TM cells in T2D patients receiving either metformin or other diabetic monotherapy, n = 18 other monotherapy group, n = 42 metformin group. Box-and-whisker plot show the median, 5 and 95 percentiles. Analysis by two-tailed t test with Welch’s correction.

Similar articles

Cited by

References

    1. Wallis RS, Hafner R. Advancing host-directed therapy for tuberculosis. Nat. Rev. Immunol. 2015;15:255–263. doi: 10.1038/nri3813. - DOI - PubMed
    1. Kaufmann SHE, Dorhoi A, Hotchkiss RS, Bartenschlager R. Host-directed therapies for bacterial and viral infections. Nat. Rev. Drug Disco. 2018;17:35–56. doi: 10.1038/nrd.2017.162. - DOI - PMC - PubMed
    1. Singhal A, et al. Metformin as adjunct antituberculosis therapy. Sci. Transl. Med. 2014;6:263ra159. doi: 10.1126/scitranslmed.3009885. - DOI - PubMed
    1. Magee, M. J., Salindri, A. D., Kornfeld, H. & Singhal, A. Reduced prevalence of latent tuberculosis infection in diabetes patients using metformin and statins. Eur. Respir. J.53, 1801695 (2019). - PMC - PubMed
    1. Pan SW, et al. The risk of TB in patients with type 2 diabetes initiating metformin vs sulfonylurea treatment. Chest. 2018;153:1347–1357. doi: 10.1016/j.chest.2017.11.040. - DOI - PubMed

Publication types

MeSH terms