

MiR-302 Regulates Glycolysis to Control Cell-Cycle during Neural Tube Closure
- PMID: 33066028
- PMCID: PMC7589003
- DOI: 10.3390/ijms21207534
MiR-302 Regulates Glycolysis to Control Cell-Cycle during Neural Tube Closure
Abstract
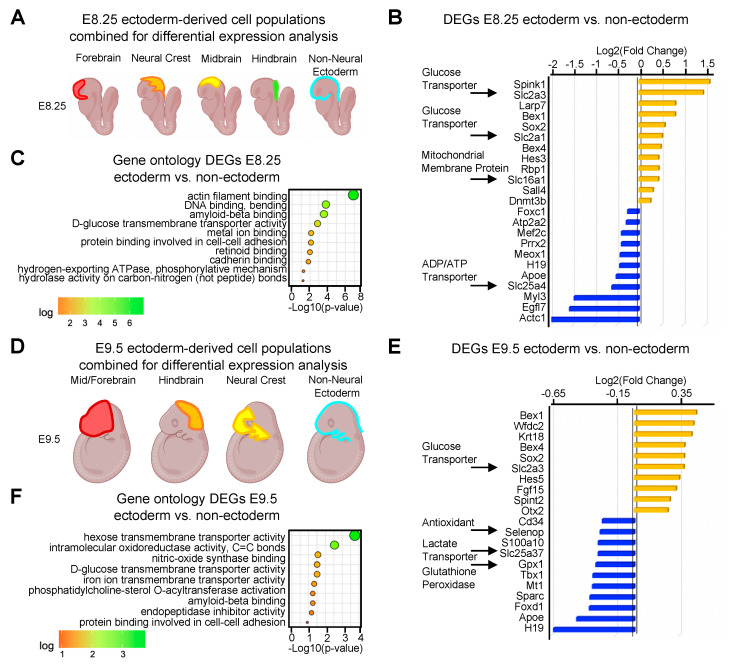
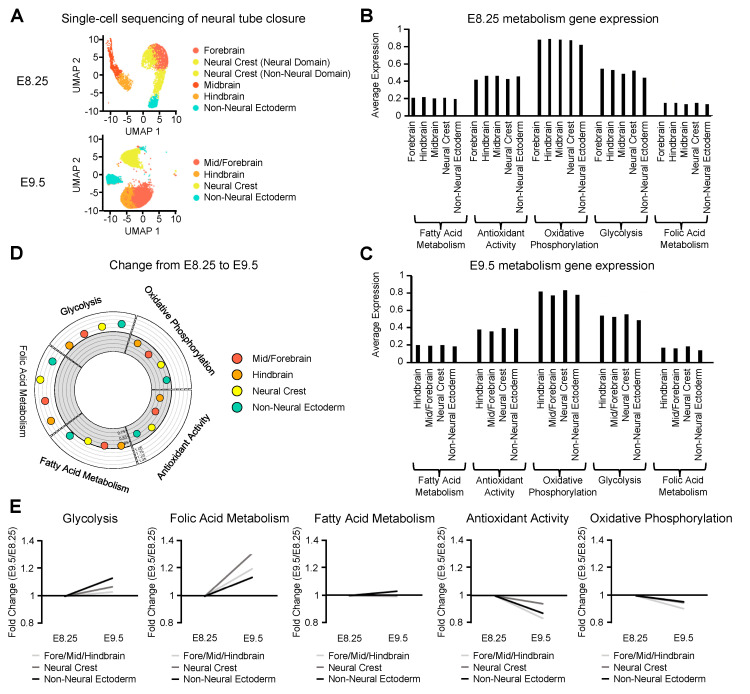
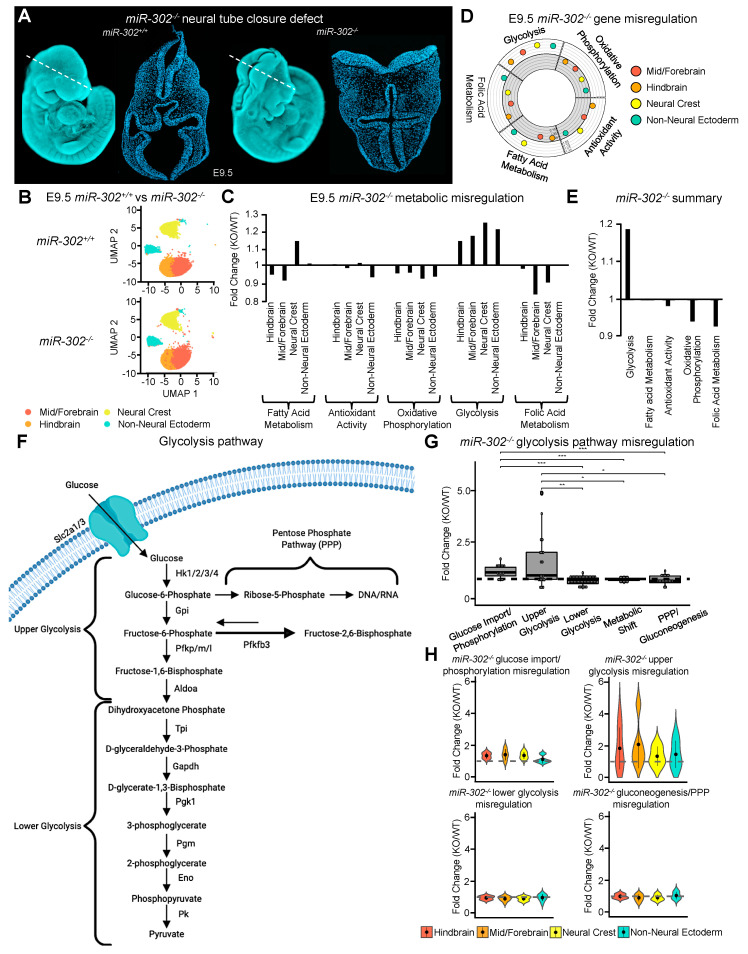
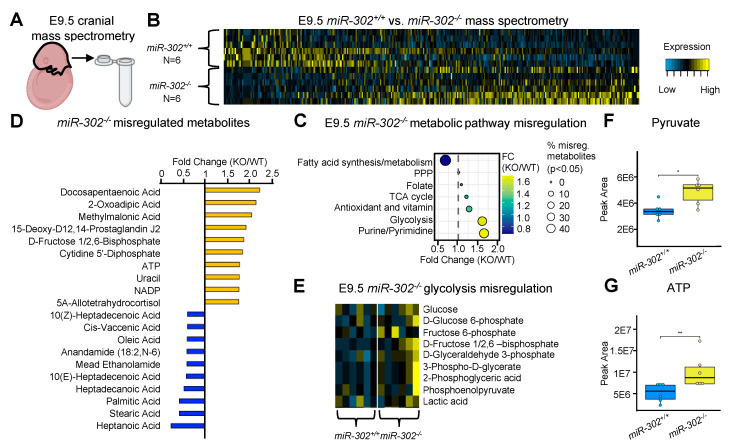
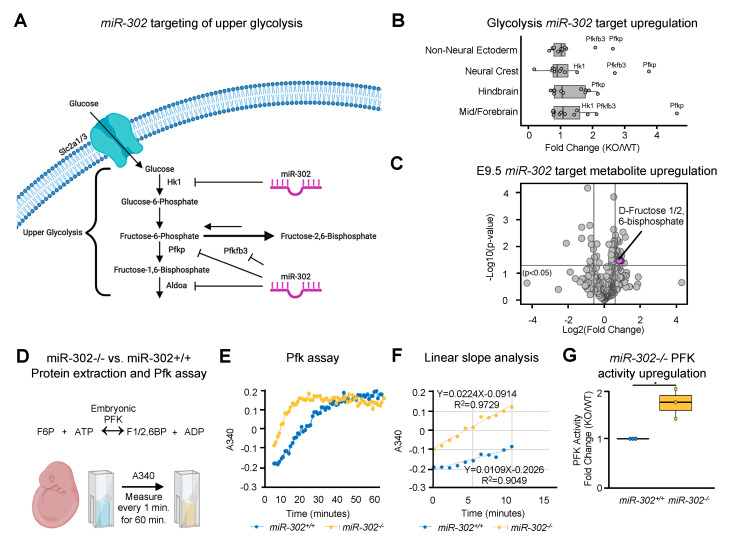
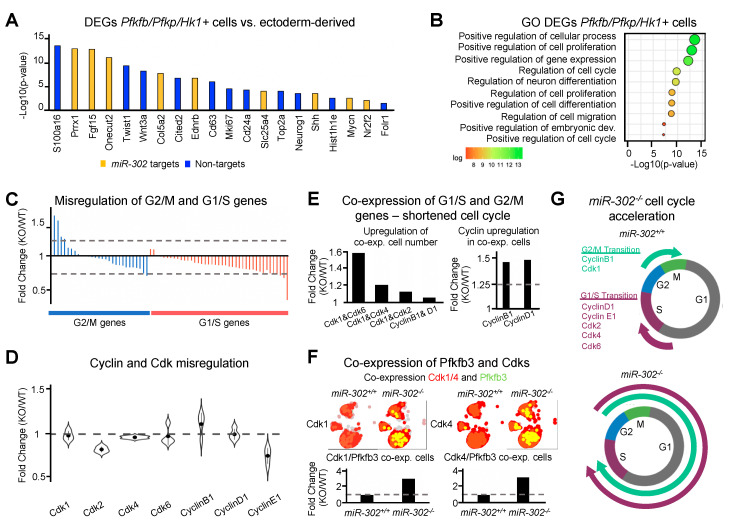
Neural tube closure is a critical early step in central nervous system development that requires precise control of metabolism to ensure proper cellular proliferation and differentiation. Dysregulation of glucose metabolism during pregnancy has been associated with neural tube closure defects (NTDs) in humans suggesting that the developing neuroepithelium is particularly sensitive to metabolic changes. However, it remains unclear how metabolic pathways are regulated during neurulation. Here, we used single-cell mRNA-sequencing to analyze expression of genes involved in metabolism of carbon, fats, vitamins, and antioxidants during neurulation in mice and identify a coupling of glycolysis and cellular proliferation to ensure proper neural tube closure. Using loss of miR-302 as a genetic model of cranial NTD, we identify misregulated metabolic pathways and find a significant upregulation of glycolysis genes in embryos with NTD. These findings were validated using mass spectrometry-based metabolite profiling, which identified increased glycolytic and decreased lipid metabolites, consistent with a rewiring of central carbon traffic following loss of miR-302. Predicted miR-302 targets Pfkp, Pfkfb3, and Hk1 are significantly upregulated upon NTD resulting in increased glycolytic flux, a shortened cell cycle, and increased proliferation. Our findings establish a critical role for miR-302 in coordinating the metabolic landscape of neural tube closure.
Keywords: cell cycle; glycolysis; hyperglycemia; maternal diabetes; miR-302; microRNA; neural tube closure; neural tube defects; oxidative stress; proliferation.
Conflict of interest statement
R.H.F. formerly held a leadership position in the now dissolved consulting company TeratOmic Consulting LLC.
Figures
Similar articles
-
Maternal metabolism influences neural tube closure.Trends Endocrinol Metab. 2023 Sep;34(9):539-553. doi: 10.1016/j.tem.2023.06.005. Epub 2023 Jul 17. Trends Endocrinol Metab. 2023. PMID: 37468429 Free PMC article. Review.
-
Mammalian embryos show metabolic plasticity toward the surrounding environment during neural tube closure.Genes Cells. 2018 Sep;23(9):794-802. doi: 10.1111/gtc.12626. Epub 2018 Aug 8. Genes Cells. 2018. PMID: 30088697
-
Transcriptome profiling of genes involved in neural tube closure during human embryonic development using long serial analysis of gene expression (long-SAGE).Birth Defects Res A Clin Mol Teratol. 2012 Sep;94(9):683-92. doi: 10.1002/bdra.23040. Epub 2012 Jul 18. Birth Defects Res A Clin Mol Teratol. 2012. PMID: 22806986 Free PMC article.
-
Untargeted metabolite profiling of murine embryos to reveal metabolic perturbations associated with neural tube closure defects.Birth Defects Res A Clin Mol Teratol. 2014 Aug;100(8):623-32. doi: 10.1002/bdra.23272. Epub 2014 Aug 13. Birth Defects Res A Clin Mol Teratol. 2014. PMID: 25115437 Free PMC article.
-
Genetic backgrounds and modifier genes of NTD mouse models: An opportunity for greater understanding of the multifactorial etiology of neural tube defects.Birth Defects Res. 2017 Jan 30;109(2):140-152. doi: 10.1002/bdra.23554. Birth Defects Res. 2017. PMID: 27768235 Review.
Cited by
-
Proteomics and disease network associations evaluation of environmentally relevant Bisphenol A concentrations in a human 3D neural stem cell model.Front Cell Dev Biol. 2023 Aug 16;11:1236243. doi: 10.3389/fcell.2023.1236243. eCollection 2023. Front Cell Dev Biol. 2023. PMID: 37664457 Free PMC article.
-
SMPD3 expression is spatially regulated in the developing embryo by SOXE factors.Dev Biol. 2024 Feb;506:31-41. doi: 10.1016/j.ydbio.2023.11.011. Epub 2023 Dec 3. Dev Biol. 2024. PMID: 38052296 Free PMC article.
-
Crosstalk between MicroRNA and Oxidative Stress in Physiology and Pathology 2.0.Int J Mol Sci. 2022 Jun 20;23(12):6831. doi: 10.3390/ijms23126831. Int J Mol Sci. 2022. PMID: 35743274 Free PMC article.
-
Mitochondria in Early Forebrain Development: From Neurulation to Mid-Corticogenesis.Front Cell Dev Biol. 2021 Nov 23;9:780207. doi: 10.3389/fcell.2021.780207. eCollection 2021. Front Cell Dev Biol. 2021. PMID: 34888312 Free PMC article. Review.
-
Maternal metabolism influences neural tube closure.Trends Endocrinol Metab. 2023 Sep;34(9):539-553. doi: 10.1016/j.tem.2023.06.005. Epub 2023 Jul 17. Trends Endocrinol Metab. 2023. PMID: 37468429 Free PMC article. Review.
References
-
- Curtin J.A., Quint E., Tsipouri V., Arkell R.M., Cattanach B., Copp A.J., Henderson D.J., Spurr N., Stanier P., Fisher E.M., et al. Mutation of Celsr1 disrupts planar polarity of inner ear hair cells and causes severe neural tube defects in the mouse. Curr. Biol. 2003;13:1129–1133. doi: 10.1016/S0960-9822(03)00374-9. - DOI - PubMed
MeSH terms
Substances
Grants and funding
LinkOut - more resources
Full Text Sources
Molecular Biology Databases
Miscellaneous
