Loading [MathJax]/jax/output/PreviewHTML/jax.js
Skip to main page content
U.S. flag

An official website of the United States government

Access keys NCBI Homepage MyNCBI Homepage Main Content Main Navigation
Comparative Study
. 2020 Dec 4;370(6521):eabe9403.
doi: 10.1126/science.abe9403. Epub 2020 Oct 15.

Comparative host-coronavirus protein interaction networks reveal pan-viral disease mechanisms

David E Gordon #  1   2   3   4 Joseph Hiatt #  1   4   5   6   7 Mehdi Bouhaddou #  1   2   3   4 Veronica V Rezelj #  8 Svenja Ulferts #  9 Hannes Braberg #  1   2   3   4 Alexander S Jureka #  10 Kirsten Obernier #  1   2   3   4 Jeffrey Z Guo #  1   2   3   4 Jyoti Batra #  1   2   3   4 Robyn M Kaake #  1   2   3   4 Andrew R Weckstein #  11 Tristan W Owens #  12 Meghna Gupta #  12 Sergei Pourmal #  12 Erron W Titus #  12 Merve Cakir #  1   2   3   4 Margaret Soucheray  1   2   3   4 Michael McGregor  1   2   3   4 Zeynep Cakir  1   2   3   4 Gwendolyn Jang  1   2   3   4 Matthew J O'Meara  13 Tia A Tummino  1   2   14 Ziyang Zhang  1   2   3   15 Helene Foussard  1   2   3   4 Ajda Rojc  1   2   3   4 Yuan Zhou  1   2   3   4 Dmitry Kuchenov  1   2   3   4 Ruth Hüttenhain  1   2   3   4 Jiewei Xu  1   2   3   4 Manon Eckhardt  1   2   3   4 Danielle L Swaney  1   2   3   4 Jacqueline M Fabius  1   2 Manisha Ummadi  1   2   3   4 Beril Tutuncuoglu  1   2   3   4 Ujjwal Rathore  1   2   3   4 Maya Modak  1   2   3   4 Paige Haas  1   2   3   4 Kelsey M Haas  1   2   3   4 Zun Zar Chi Naing  1   2   3   4 Ernst H Pulido  1   2   3   4 Ying Shi  1   2   3   15 Inigo Barrio-Hernandez  16 Danish Memon  16 Eirini Petsalaki  16 Alistair Dunham  16 Miguel Correa Marrero  16 David Burke  16 Cassandra Koh  8 Thomas Vallet  8 Jesus A Silvas  10 Caleigh M Azumaya  12 Christian Billesbølle  12 Axel F Brilot  12 Melody G Campbell  12   17 Amy Diallo  12 Miles Sasha Dickinson  12 Devan Diwanji  12 Nadia Herrera  12 Nick Hoppe  12 Huong T Kratochvil  12 Yanxin Liu  12 Gregory E Merz  12 Michelle Moritz  12 Henry C Nguyen  12 Carlos Nowotny  12 Cristina Puchades  12 Alexandrea N Rizo  12 Ursula Schulze-Gahmen  12 Amber M Smith  12 Ming Sun  12   18 Iris D Young  12 Jianhua Zhao  12 Daniel Asarnow  12 Justin Biel  12 Alisa Bowen  12 Julian R Braxton  12 Jen Chen  12 Cynthia M Chio  12 Un Seng Chio  12 Ishan Deshpande  12 Loan Doan  12 Bryan Faust  12 Sebastian Flores  12 Mingliang Jin  12 Kate Kim  12 Victor L Lam  12 Fei Li  12 Junrui Li  12 Yen-Li Li  12 Yang Li  12 Xi Liu  12 Megan Lo  12 Kyle E Lopez  12 Arthur A Melo  12 Frank R Moss 3rd  12 Phuong Nguyen  12 Joana Paulino  12 Komal Ishwar Pawar  12 Jessica K Peters  12 Thomas H Pospiech Jr  12 Maliheh Safari  12 Smriti Sangwan  12 Kaitlin Schaefer  12 Paul V Thomas  12 Aye C Thwin  12 Raphael Trenker  12 Eric Tse  12 Tsz Kin Martin Tsui  12 Feng Wang  12 Natalie Whitis  12 Zanlin Yu  12 Kaihua Zhang  12 Yang Zhang  12 Fengbo Zhou  12 Daniel Saltzberg  1   2   19 QCRG Structural Biology ConsortiumAnthony J Hodder  20 Amber S Shun-Shion  20 Daniel M Williams  20 Kris M White  21   22 Romel Rosales  21   22 Thomas Kehrer  21   22 Lisa Miorin  21   22 Elena Moreno  21   22 Arvind H Patel  23 Suzannah Rihn  23 Mir M Khalid  4 Albert Vallejo-Gracia  4 Parinaz Fozouni  4   5   7 Camille R Simoneau  4   7 Theodore L Roth  5   6   7 David Wu  5   7 Mohd Anisul Karim  24   25 Maya Ghoussaini  24   25 Ian Dunham  16   25 Francesco Berardi  26 Sebastian Weigang  27 Maxime Chazal  28 Jisoo Park  29 James Logue  30 Marisa McGrath  30 Stuart Weston  30 Robert Haupt  30 C James Hastie  31 Matthew Elliott  31 Fiona Brown  31 Kerry A Burness  31 Elaine Reid  31 Mark Dorward  31 Clare Johnson  31 Stuart G Wilkinson  31 Anna Geyer  31 Daniel M Giesel  31 Carla Baillie  31 Samantha Raggett  31 Hannah Leech  31 Rachel Toth  31 Nicola Goodman  31 Kathleen C Keough  4 Abigail L Lind  4 Zoonomia ConsortiumReyna J Klesh  32 Kafi R Hemphill  33 Jared Carlson-Stevermer  34 Jennifer Oki  34 Kevin Holden  34 Travis Maures  34 Katherine S Pollard  4   35   36 Andrej Sali  1   2   14   19 David A Agard  1   2   12   37 Yifan Cheng  1   2   12   15   37 James S Fraser  1   2   12   19 Adam Frost  1   2   12   37 Natalia Jura  1   2   3   12   38 Tanja Kortemme  1   2   12   19   39 Aashish Manglik  1   2   12   14 Daniel R Southworth  1   12   37 Robert M Stroud  1   2   12   37 Dario R Alessi  31 Paul Davies  31 Matthew B Frieman  30 Trey Ideker  29   40 Carmen Abate  26 Nolwenn Jouvenet  27   28 Georg Kochs  27 Brian Shoichet  1   2   14 Melanie Ott  4   41 Massimo Palmarini  23 Kevan M Shokat  1   2   3   15 Adolfo García-Sastre  42   22   43   44 Jeremy A Rassen  45 Robert Grosse  46   47 Oren S Rosenberg  48   2   12   36   37   41 Kliment A Verba  48   2   12   14 Christopher F Basler  49 Marco Vignuzzi  50 Andrew A Peden  51 Pedro Beltrao  52 Nevan J Krogan  48   2   3   4   21
Collaborators, Affiliations
Comparative Study

Comparative host-coronavirus protein interaction networks reveal pan-viral disease mechanisms

David E Gordon et al. Science. .

Abstract

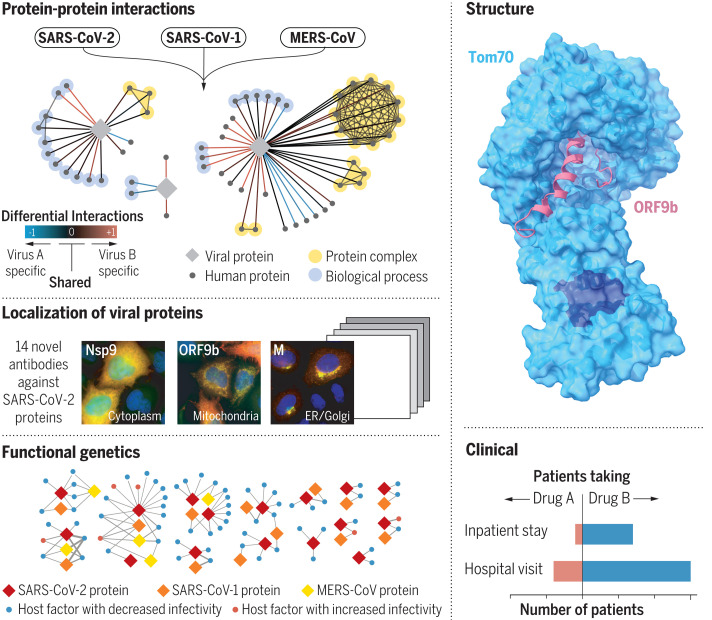
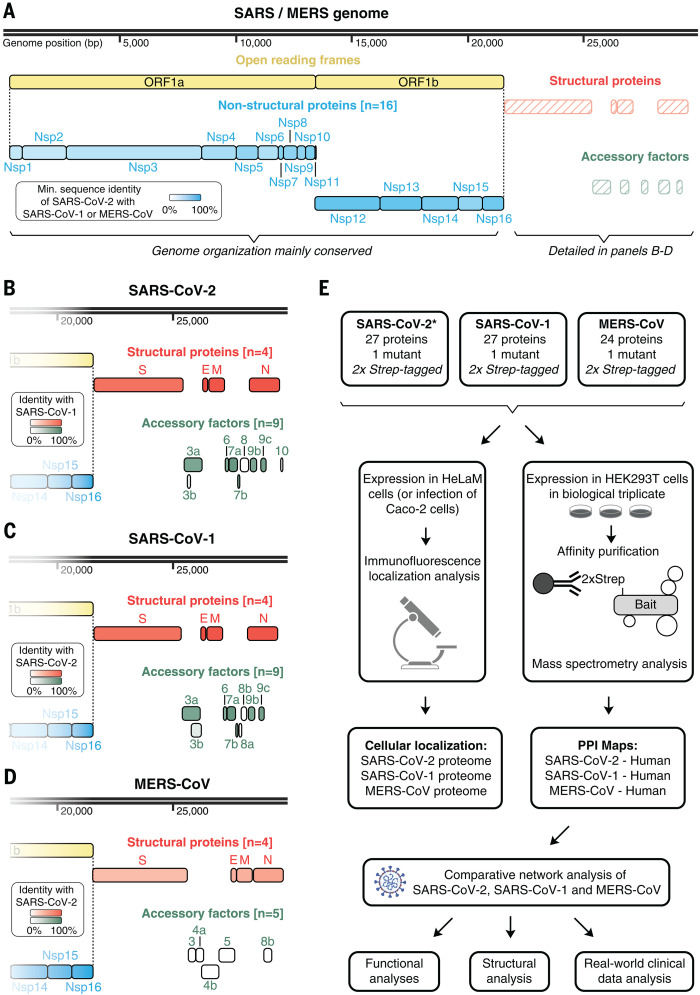
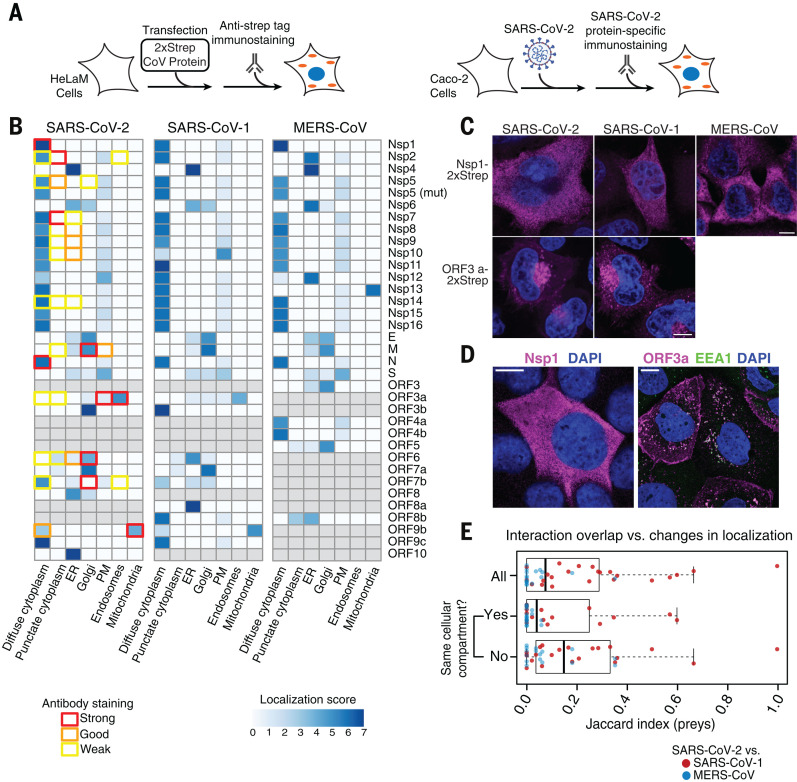
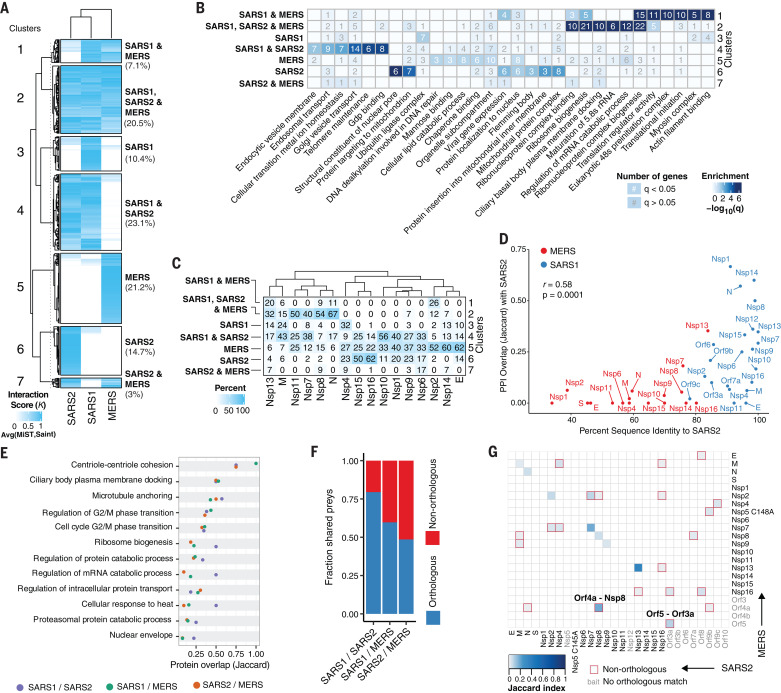
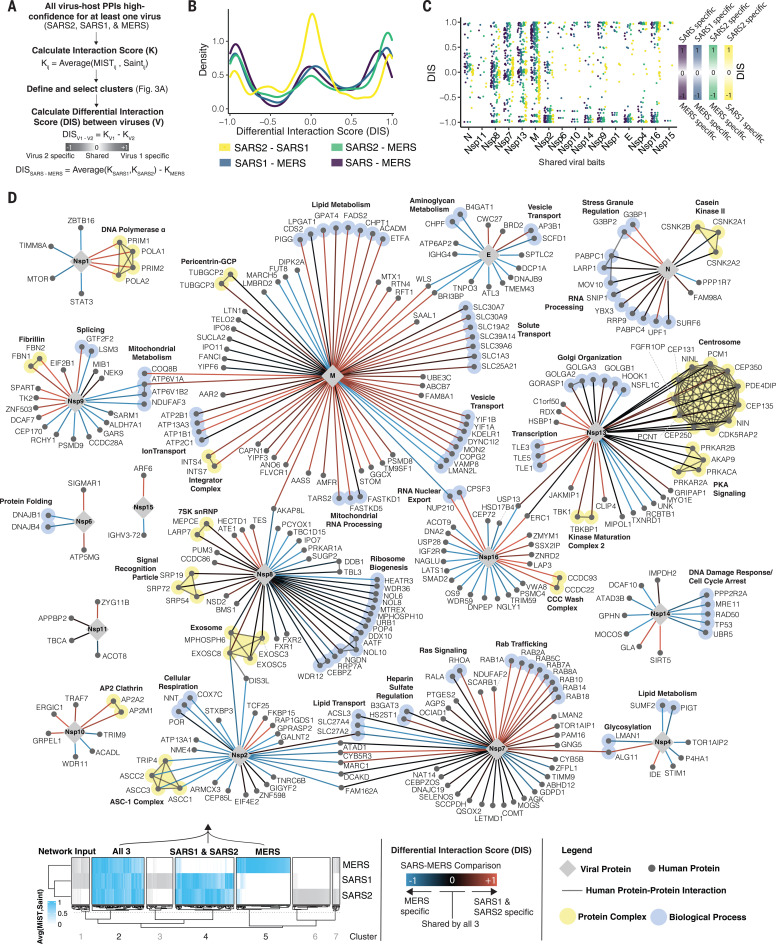
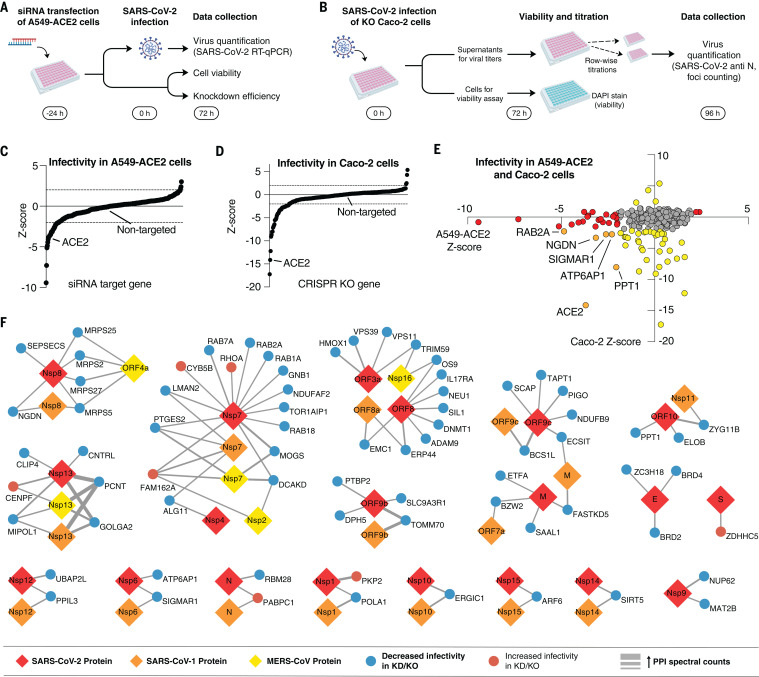
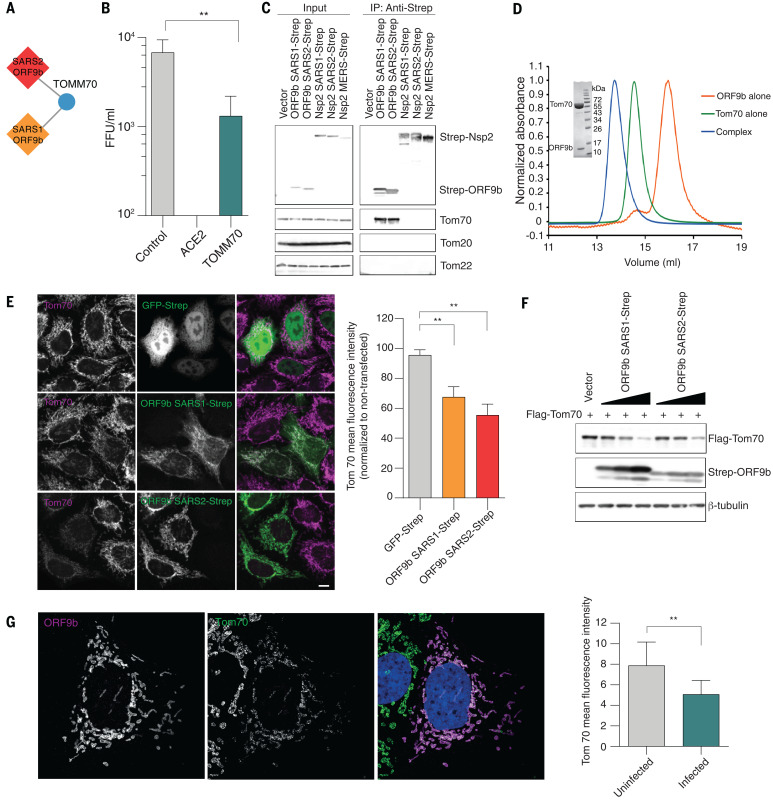
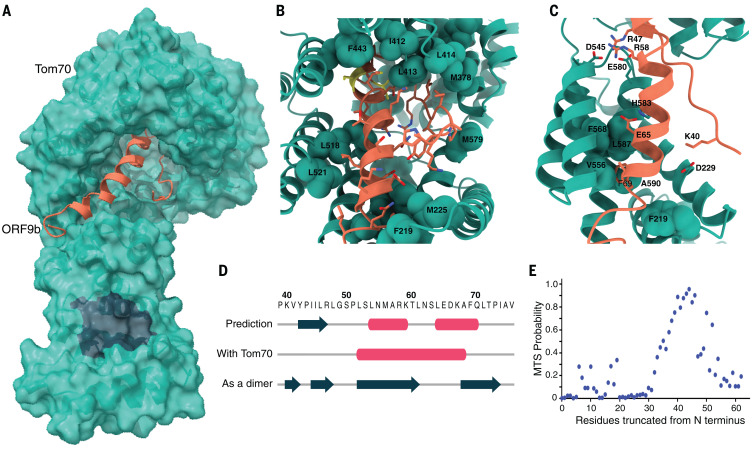
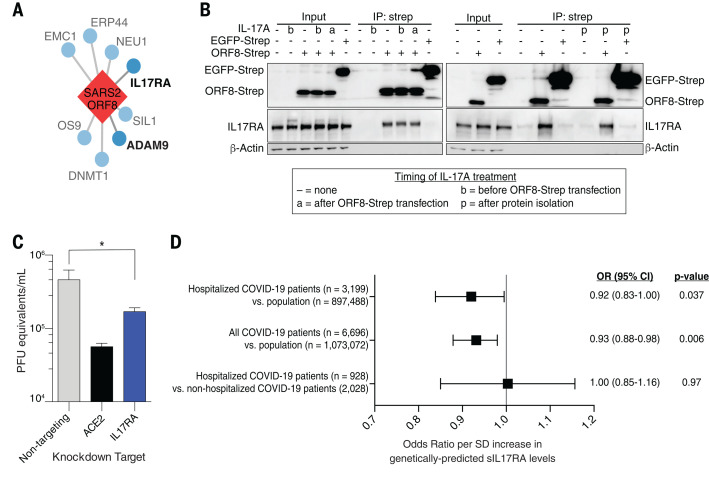
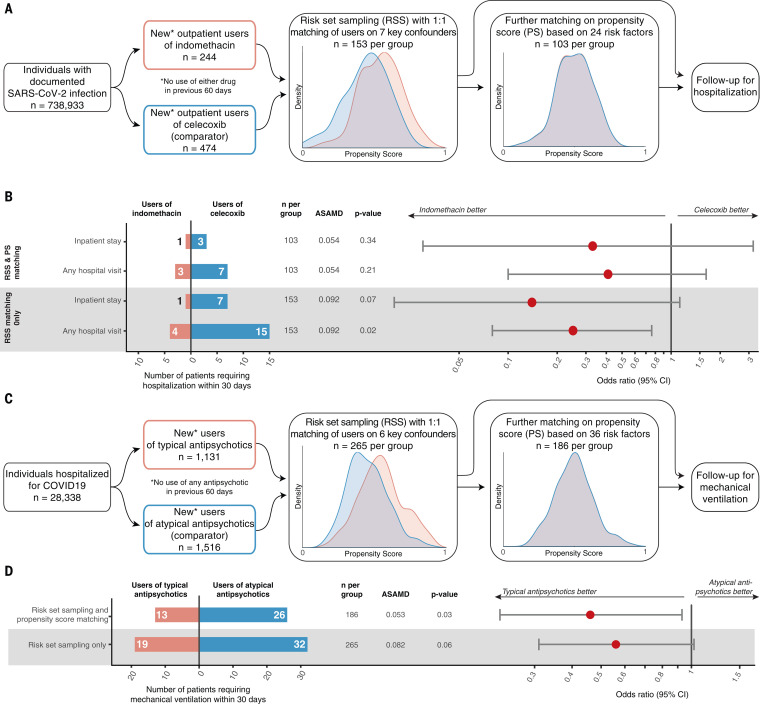
The COVID-19 pandemic, caused by severe acute respiratory syndrome coronavirus 2 (SARS-CoV-2), is a grave threat to public health and the global economy. SARS-CoV-2 is closely related to the more lethal but less transmissible coronaviruses SARS-CoV-1 and Middle East respiratory syndrome coronavirus (MERS-CoV). Here, we have carried out comparative viral-human protein-protein interaction and viral protein localization analyses for all three viruses. Subsequent functional genetic screening identified host factors that functionally impinge on coronavirus proliferation, including Tom70, a mitochondrial chaperone protein that interacts with both SARS-CoV-1 and SARS-CoV-2 ORF9b, an interaction we structurally characterized using cryo-electron microscopy. Combining genetically validated host factors with both COVID-19 patient genetic data and medical billing records identified molecular mechanisms and potential drug treatments that merit further molecular and clinical study.


Figures

None
Overview of the approaches taken for systemic and functional comparison of pathogenic human coronaviruses.
(Left) Viral-human protein-protein interaction network mapping, viral protein localization studies, and functional genetic screens provide key insights into the shared and individual characteristics of each virus. (Right) Structural studies and hypothesis testing in clinical datasets demonstrate the utility of this approach for prioritizing therapeutic strategies. Nsp, nonstructural protein; ORF, open reading frame; ER, endoplasmic reticulum.
Fig. 1
Fig. 1. Coronavirus genome annotations and integrative analysis overview.
(A) Genome annotation of SARS-CoV-2, SARS-CoV-1, and MERS-CoV with putative protein coding genes highlighted. Intensity of filled color indicates the lowest sequence identity between SARS-CoV-2 and SARS-CoV-1 or between SARS-CoV-2 and MERS. (B to D) Genome annotation of structural protein genes for SARS-CoV-2 (B), SARS-CoV-1 (C), and MERS-CoV (D). Color intensity indicates sequence identity to specified virus. (E) Overview of comparative coronavirus analysis. Proteins from SARS-CoV-2, SARS-CoV-1, and MERS-CoV were analyzed for their protein interactions and subcellular localization, and these data were integrated for comparative host interaction network analysis, followed by functional, structural, and clinical data analyses for exemplary virus-specific and pan-viral interactions. The asterisk indicates that the SARS-CoV-2 interactome was previously published in a separate study (5). SARS, both SARS-CoV-1 and SARS-CoV-2; MERS, MERS-CoV; Nsp, nonstructural protein; ORF, open reading frame.
Fig. 2
Fig. 2. Coronavirus protein localization analysis.
(A) Overview of experimental design to determine localization of Strep-tagged SARS-CoV-2, SARS-CoV-1, and MERS-CoV proteins in HeLaM cells (left) or of viral proteins upon SARS-CoV-2 infection in Caco-2 cells (right). (B) Relative localization for all coronavirus proteins across viruses expressed individually (blue color bar) or in SARS-CoV-2–infected cells (colored box outlines). (C and D) Localization of Nsp1 and ORF3a expressed individually (C) or during infection (D); for representative images of all tagged constructs and viral proteins imaged during infection, see figs. S8 to S14 and fig. S15, respectively. Scale bars, 10 μm. (E) Prey overlap per bait measured as Jaccard index comparing SARS-CoV-2 versus SARS-CoV-1 (red dots) and SARS-CoV-2 versus MERS-CoV (blue dots) for all viral baits (all), viral baits found in the same cellular compartment (yes), and viral baits found in different compartments (no).
Fig. 3
Fig. 3. Comparative analysis of coronavirus-host interactomes.
(A) Clustering analysis (K-means) of interactors from SARS-CoV-2, SARS-CoV-1, and MERS-CoV, weighted according to the average between their MiST and SAINT scores (interaction score K). Included are only viral protein baits represented amongst all three viruses and interactions that pass the high-confidence scoring threshold for at least one virus. Seven clusters highlight all possible scenarios of shared versus individual interactions, and percentages of total interactions are noted. (B) GO enrichment analysis of each cluster from (A), with the top six most-significant terms per cluster. Color indicates −log10(q), and the number of genes with significant (q < 0.05; white) or nonsignificant enrichment (q > 0.05; gray) is shown. (C) Percentage of interactions for each viral protein belonging to each cluster identified in (A). (D) Correlation between protein sequence identity and PPI overlap (Jaccard index) comparing SARS-CoV-2 and SARS-CoV-1 (blue) or MERS-CoV (red). Interactions for PPI overlap are derived from the final thresholded list of interactions per virus. (E) GO biological process terms significantly enriched (q < 0.05) for all three virus PPIs with Jaccard index indicating overlap of genes from each term for pairwise comparisons between SARS-CoV-1 and SARS-CoV-2 (purple), SARS-CoV-1 and MERS-CoV (green), and SARS-CoV-2 and MERS-CoV (orange). (F) Fraction of shared preys between orthologous (blue) and nonorthologous (red) viral protein baits. (G) Heatmap depicting overlap in PPIs (Jaccard index) between each bait from SARS-CoV-2 and MERS-CoV. Baits in gray were not assessed, do not exist, or do not have high-confidence interactors in the compared virus. Nonorthologous bait interactions are highlighted with a red square. GO, gene ontology; PPI, protein-protein interaction; SARS2, SARS-CoV-2; SARS1, SARS-CoV-1; MERS, MERS-CoV.
Fig. 4
Fig. 4. Comparative differential interaction analysis reveals shared virus-host interactions.
(A) Flowchart depicting calculation of DIS values using the average between the SAINT and MiST scores between every bait (i) and prey (j) to derive interaction score (K). The DIS is the difference between the interaction scores from each virus. The modified DIS (SARS-MERS) compares the average K from SARS-CoV-1 and SARS-CoV-2 to that of MERS-CoV (see Materials and methods). Only viral bait proteins shared between all three viruses are included. (B) Density histogram of the DISs for all comparisons. (C) Dot plot depicting the DISs of interactions from viral bait proteins shared between all three viruses, ordered left to right by the mean DIS per viral bait. (D) Virus-human PPI map depicting the SARS-MERS comparison [purple in (B) and (C)]. The network depicts interactions derived from cluster 2 (all three viruses), cluster 4 (SARS-CoV-1 and SARS-CoV-2), and cluster 5 (MERS-CoV only). Edge color denotes DIS: red indicates interactions specific to SARS-CoV-1 and SARS-CoV-2 but absent in MERS-CoV; blue indicates interactions specific to MERS-CoV but absent from both SARS-CoV-1 and SARS-CoV-2; and black indicates interactions shared between all three viruses. Human-human interactions (thin dark gray line) and proteins sharing the same protein complexes or biological processes (light yellow or light blue highlighting, respectively) are shown. Host-host physical interactions, protein complex definitions, and biological process groupings are derived from CORUM (46), GO (biological process), and manually curated from literature sources. Thin dashed gray lines are used to indicate the placement of node labels when adjacent node labels would have otherwise been obscured. DIS, differential interaction score; SARS2, SARS-CoV-2; SARS1, SARS-CoV-1; MERS, MERS-CoV; SARS, both SARS-CoV-1 and SARS-CoV-2.
Fig. 5
Fig. 5. Functional interrogation of SARS-CoV-2 interactors using genetic perturbations.
(A) A549-ACE2 cells were transfected with siRNA pools targeting each of the human genes from the SARS-CoV-2 interactome, followed by infection with SARS-CoV-2 and virus quantification using RT-qPCR. Cell viability and knockdown efficiency in uninfected cells was determined in parallel. (B) Caco-2 cells with CRISPR knockouts (KO) of each human gene from the SARS-CoV-2 interactome were infected with SARS-CoV-2, and supernatants were serially diluted and plated onto Vero E6 cells for quantification. Viabilities of the uninfected CRISPR knockout cells after infection were determined in parallel by DAPI staining. (C and D) Plot of results from the infectivity screens in A549-ACE2 knockdown cells (C) and Caco-2 knockout cells (D) sorted by z-score (z < 0, decreased infectivity; z > 0 increased infectivity). Negative controls (nontargeting control for siRNA, nontargeted cells for CRISPR) and positive controls (ACE2 knockdown or knockout) are highlighted. (E) Results from both assays with potential hits highlighted in red (A549-ACE2), yellow (Caco-2), and orange (both). (F) Pan-coronavirus interactome reduced to human preys with significant increase (red nodes) or decrease (blue nodes) in SARS-CoV2 replication upon knockdown or knockout. Viral proteins baits from SARS-CoV-2 (red), SARS-CoV-1 (orange), and MERS-CoV (yellow) are represented as diamonds. The thickness of the edge indicates the strength of the PPI in spectral counts. KD, knockdown; KO, knockout; PPI, protein-protein interaction.
Fig. 6
Fig. 6. Interaction between ORF9b and human Tom70.
(A) ORF9b-Tom70 interaction is conserved between SARS-CoV-1 and SARS-CoV-2. (B) Viral titers in Caco-2 cells after CRISPR knockout of TOMM70 or controls. (C) Coimmunoprecipitation of endogenous Tom70 with Strep-tagged ORF9b from SARS-CoV-1 and SARS-CoV-2; Nsp2 from SARS-CoV-1, SARS-CoV-2, and MERS-CoV; or vector control in HEK293T cells. Representative blots of whole-cell lysates and eluates after IP are shown. (D) Size exclusion chromatography traces (10/300 S200 increase) of ORF9b alone, Tom70 alone, and coexpressed ORF9b-Tom70 complex purified from recombinant expression in E. coli. Insert shows SDS-PAGE of the complex peak indicating presence of both proteins. (E) Immunostainings for Tom70 in HeLaM cells transfected with GFP-Strep and ORF9b from SARS-CoV-1 and SARS-CoV-2 (left) and mean fluorescence intensity ± SD values of Tom70 in GFP-Strep and ORF9b expressing cells (normalized to nontransfected cells) (right). Scale bar, 10 μm. (F) Flag-Tom70 expression levels in total cell lysates of HEK293T cells upon titration of cotransfected Strep-ORF9b from SARS-CoV-1 and SARS-CoV-2. (G) Immunostaining for ORF9b and Tom70 in Caco-2 cells infected with SARS-CoV-2 (left) and mean fluorescence intensity ± SD values of Tom70 in uninfected and SARS-CoV-2–infected cells (right). SARS2, SARS-CoV-2; SARS1, SARS-CoV-1; MERS, MERS-CoV; IP, immunoprecipitation. **P < 0.05, Student’s t test.
Fig. 7
Fig. 7. Cryo-EM structure of ORF9b-Tom70 complex reveals ORF9b adopting a helical fold and binding at the substrate recognition site of Tom70.
(A) Surface representation of the ORF9b-Tom70 structure. Tom70 is depicted as molecular surface in green, ORF9b is depicted as ribbon in orange. Region in charcoal indicates Hsp70 or Hsp90 binding site on Tom70. (B) Magnified view of ORF9b-Tom70 interactions with interacting hydrophobic residues on Tom70 indicated and shown in spheres. The two phosphorylation sites on ORF9b, S50 and S53, are shown in yellow. (C) Ionic interactions between Tom70 and ORF9b are depicted as sticks. Highly conserved residues on Tom70 making hydrophobic interactions with ORF9b are depicted as spheres. (D) Diagram depicting secondary structure comparison of ORF9b as predicted by JPred server—as visualized in our structure—or as visualized in the previously crystallized dimer structure (PDB ID: 6Z4U) (16). Pink tubes indicate helices, charcoal arrows indicate beta strands, and the amino acid sequence for the region visualized in the cryo-EM structure is shown on top. (E) Predicted probability of having an internal MTS as output by TargetP server by serially running N-terminally truncated regions of SARS-CoV-2 ORF9b. Region visualized in the cryo-EM structure (amino acids 39 to 76) overlaps with the highest internal MTS probability region (amino acids 40 to 50). MTS, mitochondrial targeting signal. Single-letter abbreviations for the amino acid residues are as follows: A, Ala; C, Cys; D, Asp; E, Glu; F, Phe; G, Gly; H, His; I, Ile; K, Lys; L, Leu; M, Met; N, Asn; P, Pro; Q, Gln; R, Arg; S, Ser; T, Thr; V, Val; W, Trp; and Y, Tyr.
Fig. 8
Fig. 8. SARS-CoV-2 ORF8 and functional interactor IL17RA are linked to viral outcomes.
(A) IL17RA and ADAM9 are functional interactors of SARS-CoV-2 ORF8. Only interactors identified in the genetic screening are shown. (B) Coimmunoprecipitation of endogenous IL17RA with Strep-tagged ORF8 or EGFP with or without IL-17A treatment at different times. Overexpression was done in HEK293T cells. (C) Viral titer after IL17RA or control knockdown in A549-ACE2 cells. (D) OR of membership in indicated cohorts by genetically predicted sIL17RA levels. SARS2, SARS-CoV-2; IP, immunoprecipitation; SD, standard deviation; OR, odds ratio; CI, confidence interval; sIL17RA, soluble IL17RA. *P < 0.05, unpaired t test. Error bars in (C) indicate SDs; in (D), they indicate 95% CIs.
Fig. 9
Fig. 9. Real-world data analysis of drugs identified through molecular investigation support their antiviral activity.
(A) Schematic of retrospective real-world clinical data analysis of indomethacin use for outpatients with SARS-CoV-2. Plots show distribution of propensity scores (PSs) for all included patients (red, indomethacin users; blue, celecoxib users). For a full list of inclusion, exclusion, and matching criteria, see Materials and methods and table S11. (B) Effectiveness of indomethacin versus celecoxib in patients with confirmed SARS-CoV-2 infection treated in an outpatient setting. Average standardized absolute mean difference (ASAMD) is a measure of balance between indomethacin and celecoxib groups calculated as the mean of the absolute standardized difference for each PS factor (table S11); P value and ORs with 95% CIs are estimated using the Aetion Evidence Platform r4.6. No ASAMD was >0.1. (C) Schematic of retrospective real-world clinical data analysis of typical antipsychotic use for inpatients with SARS-CoV-2. Plots show distribution of PSs for all included patients (red, typical users; blue, atypical users). For a full list of inclusion, exclusion, and matching criteria see Materials and methods and table S11. (D) Effectiveness of typical versus atypical antipsychotics among hospitalized patients with confirmed SARS-CoV-2 infection treated in hospital. ASAMD is a measure of balance between typical and atypical groups calculated as the mean of the absolute standardized difference for each PS factor (table S11); P value and ORs with 95% CIs are estimated using the Aetion Evidence Platform r4.6. No ASAMD was >0.1.

Comment in

Similar articles

Cited by

References

    1. Liu J., Xie W., Wang Y., Xiong Y., Chen S., Han J., Wu Q., A comparative overview of COVID-19, MERS and SARS: Review article. Int. J. Surg. 81, 1–8 (2020). 10.1016/j.ijsu.2020.07.032 - DOI - PMC - PubMed
    1. Beigel J. H., Tomashek K. M., Dodd L. E., Mehta A. K., Zingman B. S., Kalil A. C., Hohmann E., Chu H. Y., Luetkemeyer A., Kline S., Lopez de Castilla D., Finberg R. W., Dierberg K., Tapson V., Hsieh L., Patterson T. F., Paredes R., Sweeney D. A., Short W. R., Touloumi G., Lye D. C., Ohmagari N., Oh M.-d., Ruiz-Palacios G. M., Benfield T., Fätkenheuer G., Kortepeter M. G., Atmar R. L., Creech C. B., Lundgren J., Babiker A. G., Pett S., Neaton J. D., Burgess T. H., Bonnett T., Green M., Makowski M., Osinusi A., Nayak S., Lane H. C., ACTT-1 Study Group Members , Remdesivir for the treatment of Covid-19—Final report. N. Engl. J. Med. 383, 1813–1826 (2020). 10.1056/NEJMoa2007764 - DOI - PMC - PubMed
    1. RECOVERY Collaborative Group , Dexamethasone in Hospitalized Patients with Covid-19 - Preliminary Report. N. Engl. J. Med. 10.1056/nejmoa2021436 (2020). 10.1056/nejmoa2021436 - DOI - PMC - PubMed
    1. Becerra-Flores M., Cardozo T., SARS-CoV-2 viral spike G614 mutation exhibits higher case fatality rate. Int. J. Clin. Pract. 74, e13525 (2020). 10.1111/ijcp.13525 - DOI - PMC - PubMed
    1. Gordon D. E., Jang G. M., Bouhaddou M., Xu J., Obernier K., White K. M., O’Meara M. J., Rezelj V. V., Guo J. Z., Swaney D. L., Tummino T. A., Hüttenhain R., Kaake R. M., Richards A. L., Tutuncuoglu B., Foussard H., Batra J., Haas K., Modak M., Kim M., Haas P., Polacco B. J., Braberg H., Fabius J. M., Eckhardt M., Soucheray M., Bennett M. J., Cakir M., McGregor M. J., Li Q., Meyer B., Roesch F., Vallet T., Mac Kain A., Miorin L., Moreno E., Naing Z. Z. C., Zhou Y., Peng S., Shi Y., Zhang Z., Shen W., Kirby I. T., Melnyk J. E., Chorba J. S., Lou K., Dai S. A., Barrio-Hernandez I., Memon D., Hernandez-Armenta C., Lyu J., Mathy C. J. P., Perica T., Pilla K. B., Ganesan S. J., Saltzberg D. J., Rakesh R., Liu X., Rosenthal S. B., Calviello L., Venkataramanan S., Liboy-Lugo J., Lin Y., Huang X.-P., Liu Y., Wankowicz S. A., Bohn M., Safari M., Ugur F. S., Koh C., Savar N. S., Tran Q. D., Shengjuler D., Fletcher S. J., O’Neal M. C., Cai Y., Chang J. C. J., Broadhurst D. J., Klippsten S., Sharp P. P., Wenzell N. A., Kuzuoglu-Ozturk D., Wang H.-Y., Trenker R., Young J. M., Cavero D. A., Hiatt J., Roth T. L., Rathore U., Subramanian A., Noack J., Hubert M., Stroud R. M., Frankel A. D., Rosenberg O. S., Verba K. A., Agard D. A., Ott M., Emerman M., Jura N., von Zastrow M., Verdin E., Ashworth A., Schwartz O., d’Enfert C., Mukherjee S., Jacobson M., Malik H. S., Fujimori D. G., Ideker T., Craik C. S., Floor S. N., Fraser J. S., Gross J. D., Sali A., Roth B. L., Ruggero D., Taunton J., Kortemme T., Beltrao P., Vignuzzi M., García-Sastre A., Shokat K. M., Shoichet B. K., Krogan N. J., A SARS-CoV-2 protein interaction map reveals targets for drug repurposing. Nature 583, 459–468 (2020). 10.1038/s41586-020-2286-9 - DOI - PMC - PubMed

Publication types

MeSH terms

Substances

Grants and funding