. 2020 Nov 16;147(22):dev187526.
doi: 10.1242/dev.187526.

Transcriptional regulation of MGE progenitor proliferation by PRDM16 controls cortical GABAergic interneuron production

Affiliations

Transcriptional regulation of MGE progenitor proliferation by PRDM16 controls cortical GABAergic interneuron production

Miguel Turrero García et al. Development. .

Abstract

The mammalian cortex is populated by neurons derived from neural progenitors located throughout the embryonic telencephalon. Excitatory neurons are derived from the dorsal telencephalon, whereas inhibitory interneurons are generated in its ventral portion. The transcriptional regulator PRDM16 is expressed by radial glia, neural progenitors present in both regions; however, its mechanisms of action are still not fully understood. It is unclear whether PRDM16 plays a similar role in neurogenesis in both dorsal and ventral progenitor lineages and, if so, whether it regulates common or unique networks of genes. Here, we show that Prdm16 expression in mouse medial ganglionic eminence (MGE) progenitors is required for maintaining their proliferative capacity and for the production of proper numbers of forebrain GABAergic interneurons. PRDM16 binds to cis-regulatory elements and represses the expression of region-specific neuronal differentiation genes, thereby controlling the timing of neuronal maturation. PRDM16 regulates convergent developmental gene expression programs in the cortex and MGE, which utilize both common and region-specific sets of genes to control the proliferative capacity of neural progenitors, ensuring the generation of correct numbers of cortical neurons.

Keywords: CNS development; Cortical interneurons; Medial ganglionic eminence; Neural progenitors; Prdm16.


Conflict of interest statement

Competing interestsThe authors declare no competing or financial interests.

Figures
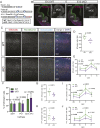
Fig. 1.
Fig. 1.
Deletion of Prdm16 in the Nkx2.1 lineage causes a loss of cortical interneurons. (A) Genetic strategy for conditional deletion of Prdm16 and simultaneous fate mapping of Nkx2.1-expressing cells. (B) Left: Overview of a coronal section through one hemisphere of the developing telencephalon, immunostained for PRDM16 (green) and tdT (magenta) at E13 in WT and cKO mice, showing the loss of PRDM16 in the ventricular zone of the Nkx2.1-expressing MGE, but not in the lateral ganglionic eminence (LGE) or cortex. Right: Close-up of the MGE of E13 WT and KO embryos, immunostained for PRDM16 (gray); note the presence of PRDM16+ cells in the cKO sample throughout the dorsal domain of the MGE (dMGE, dashed line), where Nkx2.1 is not expressed. (C) Immunostaining for tdT (red in merged image), PV (green in merge) and SST (cyan in merge), counterstained with DAPI (blue in merge), in the cortex of P30 WT and cKO mice. Cortical layers are indicated in white. (D) Total number of tdT+ cells per 1 mm-wide column spanning the entirety of the cortex. (E) Number of tdT+ cells in each indicated cortical layer, quantified per 1 mm-wide column. (F) Total number of cells co-labeled with SST and tdT (SST+, tdT+) per 1 mm-wide cortical column. (G) Number of SST+, tdT+ cells in each indicated cortical layer, per 1 mm-wide column. (H) Total number of cells co-labeled with PV and tdT (PV+, tdT+) per 1 mm-wide cortical column. (I) Number of PV+, tdT+ cells in each indicated cortical layer, per 1 mm-wide column. Analysis in D-J was performed on samples from P30 WT (green circles) and cKO (purple squares) animals. Black bars in D, G and H indicate the mean. Mean±s.d. is displayed in E, F, I and J. Unpaired t-tests with Welch's correction (D,G,H) or multiple t-tests (E,F,I,J) were performed; P-values are indicated above the corresponding compared sets of data: those highlighted in bold represent significant differences (P<0.05). Scale bars: 250 µm (B, left), 100 µm (B, right; C)
Fig. 2.
Fig. 2.
Loss of Nkx2.1-lineage cortical interneurons in Prdm16 mutants is partially compensated by an increase in non-MGE-derived reelin+ cells in upper layers. (A) Immunostaining for vasointestinal peptide (VIP, green in merge), reelin (gray in merge), and tdT (magenta in merge) in the cortex of P30 WT and cKO mice. Cortical layers are indicated in white. (B) Total number of VIP+ cells per 1 mm-wide column spanning the entirety of the cortex. (C) Total number of reelin+ cells per 1 mm-wide cortical column. (D) Percentage of reelin+ cells co-stained for tdT. (E) Total number of reelin+, tdT cells per 1 mm-wide column. (F) Number of reelin+, tdT cells in each indicated cortical layer, per 1 mm-wide column. Analysis in B-F was performed on samples from P30 WT (green circles) and cKO (purple squares) animals. Black bars in B-E indicate the mean. Mean±s.d. is displayed in F. Unpaired t-tests with Welch's correction (B-E) or multiple t-tests (F) were performed; P-values are indicated above the corresponding compared sets of data: those highlighted in bold represent significant differences (P<0.05). Scale bars: 200 µm.
Fig. 3.
Fig. 3.
Pyramidal neurons in the cortex of Prdm16 mutant mice receive decreased inhibitory inputs. (A) Representative traces of miniature inhibitory postsynaptic currents (mIPSCs) recorded from layer II-III pyramidal cells of the somatosensory cortex of P21 WT and cKO mice. (B,C) Frequency (B) and amplitude (C) values for mIPSCs. For WT (green circles), N=3 mice, n=27 cells. For cKO mice (purple squares), N=3 mice, n=28 cells. All values are displayed, with mean±s.e.m. indicated by black bars. Mann–Whitney tests were performed; P-values are indicated above the corresponding compared sets of data: the one highlighted in bold represents a significant difference (P<0.05).
Fig. 4.
Fig. 4.
Loss of cortical interneurons in the cKO cortex is caused by defects in MGE progenitor proliferation. (A) Representative images of immunofluorescence experiments performed on the MGE of WT and cKO mice at E13, stained for the mitotic marker pH3 (green) and tdT (magenta); nuclei were counterstained with DAPI (blue). The VZ and SVZ/MZ are indicated. (B) Quantification of the number of pH3+ cells/mm2 in the MGE of WT (green circles) and cKO (purple squares) mice at E13. (C) Quantification of the number of VZ pH3+ cells per 100 µm of ventricular surface length in the MGE of WT (green circles) and cKO (purple squares) mice at E13. (D) Quantification of the number of pH3+ cells/mm2 in the SVZ/MZ of the MGE of WT (green circles) and cKO (purple squares) mice at E13. (E) Representative images of retrovirus-labeled clones in the MGE of WT (left) and cKO (right) mice at 24 h after infection. Clones were typically composed of radial glia (magenta empty arrowheads), distinguished by their long basal processes (small magenta arrowheads) sometimes contacting blood vessels (white asterisks), and/or intermediate progenitors (green empty arrowheads) or other unidentified cells (gray empty arrowhead). (E) Frequency distribution of retrovirally labeled clone size in the MGE of WT (green; n=165 clones from 9 embryos) and cKO (purple; n=141 clones from 10 embryos) mice at E14, 24 h after infection. (F) Number of cells per MGE clone of WT (green circles) and cKO (purple squares) E14 mice, 24 h after retroviral infection. The average clone sizes for each sample (n=9 for WT, n=10 for cKO) are represented. Black bars in B-D and G indicate the mean. Unpaired t-tests with Welch's correction (B-D,G) were performed; P-values are indicated above the corresponding compared sets of data: those highlighted in bold represent significant differences (P<0.05). Scale bars: 200 µm (A), 25 µm (E).
Fig. 5.
Fig. 5.
Prdm16 controls the expression of genes involved in MGE progenitor differentiation. (A) Schematic of the experiment: the MGEs of E14 WT or cKO mice were dissected out and subjected to RNA sequencing. (B) Heatmap representing the similarity between samples (as measured by their Euclidean distance; more saturated colors represent higher similarity) and their hierarchical clustering. (C) Volcano plot displaying genes down- (green) or upregulated (red) in cKO samples compared to WT. Several example genes are highlighted. (D) Lists of example down- and upregulated genes in cKO with respect to WT.
Fig. 6.
Fig. 6.
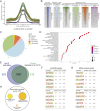
PRDM16 binding sites in the MGE are associated with open chromatin marks and genes implicated in neural development. (A) Read density (fragments per million reads mapped) in several embryonic ChIP-Seq experiments (color-coded as explained in B), within a genomic window centered around PRDM16 binding sites in the embryonic cortex (light blue) or the MGE (all other plots). (B) Heatmap representation of the read density around PRDM16 binding sites for the ChIP-Seq experiments depicted in A (each line in a heatmap represents an individual PRDM16 binding site); data were generated for this study from the E14 MGE (dark blue) or obtained from Baizabal et al. (2018) (CTX; ChIP-Seq for PRDM16 in E15 cortex; light blue) and Sandberg et al. (2016) (ChIP-Seq for each specified histone modification in E13 MGE; all other plots). (C) Genome-wide distribution of E13 MGE PRDM16 ChIP-Seq peaks relative to gene annotations (TSS: transcription start site; TTS: transcription termination site). (D) Gene ontology term enrichment in potential PRDM16 binding sites in the MGE, obtained by analysis of genes closest to ChIP-Seq peaks. (E) Overlap of PRDM16 peaks between cortex and MGE ChIP-Seq experiments. The number of peaks within each sector of the Venn diagram is indicated. (F,G) De novo (top) and known (bottom) motif analysis of PRDM16 ChIP-Seq peaks, in all MGE peaks (F) or MGE-exclusive peaks (G). (H) Venn diagram representing the proportion of differentially regulated genes in the MGE of Prdm16 cKO mice (as identified by RNA-Seq; see Fig. 5 and Tables S2-S6) with PRDM16 ChIP-Seq peaks either exclusive to the MGE (yellow) or the cortex (light orange) or common to both (dark orange).
Fig. 7.
Fig. 7.
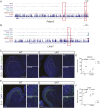
PRDM16 represses the expression of genes involved in neuronal differentiation in the MGE. (A,B) ChIP-Seq tracks showing PRDM16 binding sites in two ChIP-Seq experimental replicates in the E14 MGE (middle tracks), compared to E15 cortex (bottom track), in the loci of Pdzrn3 (A) and Lmo1 (B). Input (top track); genomic conservation (dark blue, bottom) is shown for comparison. Detected ChIP-Seq peaks common to MGE and cortex (Pdzrn3) or unique to the MGE (Lmo1) are highlighted by red boxes. (C,E) Images from in situ hybridization experiments for Pdzrn3 (C) or Lmo1 (E) transcripts (green) in the MGE of WT and cKO embryos at E13, counterstained with DAPI (blue). Dotted lines indicate the border between VZ and SVZ/MZ. Dotted boxes are shown magnified on the right and display example 100×100 µm images from the VZ and SVZ/MZ, as indicated. (D,F) Quantification of the average number of Pdzrn3 (D) or Lmo1 (F) RNA puncta per field of view, as obtained by in situ hybridization in the VZ and SVZ/MZ of WT and cKO embryos at E13 (n=4 embryos for both WT and cKO). Black bars indicate the mean. Multiple t-tests (D,F) were performed; P-values are indicated above the corresponding compared sets of data: those highlighted in bold represent significant differences (P<0.05). Scale bars: 100 µm.

Similar articles

Cited by

References

    1. Anderson S. A., Eisenstat D. D., Shi L. and Rubenstein J. L. (1997). Interneuron migration from basal forebrain to neocortex: dependence on Dlx genes. Science 278, 474-476. 10.1126/science.278.5337.474 - DOI - PubMed
    1. Anthony T. E., Klein C., Fishell G. and Heintz N. (2004). Radial glia serve as neuronal progenitors in all regions of the central nervous system. Neuron 41, 881-890. 10.1016/S0896-6273(04)00140-0 - DOI - PubMed
    1. Baizabal J. M., Mistry M., Garcia M. T., Gomez N., Olukoya O., Tran D., Johnson M. B., Walsh C. A. and Harwell C. C. (2018). The epigenetic state of PRDM16-regulated enhancers in radial glia controls cortical neuron position. Neuron 98, 945-962.e8. 10.1016/j.neuron.2018.04.033 - DOI - PMC - PubMed
    1. Campbell K. (2003). Dorsal-ventral patterning in the mammalian telencephalon. Curr. Opin. Neurobiol. 13, 50-56. 10.1016/S0959-4388(03)00009-6 - DOI - PubMed
    1. Casarosa S., Fode C. and Guillemot F. (1999). Mash1 regulates neurogenesis in the ventral telencephalon. Development 126, 525-534. - PubMed

Publication types

MeSH terms