. 2020 Nov 23;55(4):468-482.e7.
doi: 10.1016/j.devcel.2020.09.022. Epub 2020 Oct 14.

Mechanosensing through Direct Binding of Tensed F-Actin by LIM Domains

Affiliations

Mechanosensing through Direct Binding of Tensed F-Actin by LIM Domains

Xiaoyu Sun et al. Dev Cell. .

Abstract

Mechanical signals transmitted through the cytoplasmic actin cytoskeleton must be relayed to the nucleus to control gene expression. LIM domains are protein-protein interaction modules found in cytoskeletal proteins and transcriptional regulators. Here, we identify three LIM protein families (zyxin, paxillin, and FHL) whose members preferentially localize to the actin cytoskeleton in mechanically stimulated cells through their tandem LIM domains. A minimal actin-myosin reconstitution system reveals that representatives of all three families directly bind F-actin only in the presence of mechanical force. Point mutations at a site conserved in each LIM domain of these proteins disrupt tensed F-actin binding in vitro and cytoskeletal localization in cells, demonstrating a common, avidity-based mechanism. Finally, we find that binding to tensed F-actin in the cytoplasm excludes the cancer-associated transcriptional co-activator FHL2 from the nucleus in stiff microenvironments. This establishes direct force-activated F-actin binding as a mechanosensing mechanism by which cytoskeletal tension can govern nuclear localization.

Keywords: FHL2; LIM domain; actin; cytoskeleton; mechanobiology; mechanosensation; mechanotransduction; paxillin; zyxin.


Conflict of interest statement

Declaration of Interests The authors declare no competing interests.

Figures
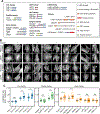
Figure 1.
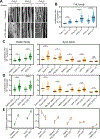
Figure 1.. Three families of LIM-domain proteins mechanoaccumulate on the actin cytoskeleton.
(A) Schematics of LIM-domain proteins examined in this study, drawn to scale by primary sequence. (B) Epifluorescence micrographs of eGFP-labeled FHL-, paxillin-, and zyxin-family proteins in unstretched (−) and stretched (+) MEFs stained with phalloidin to label F-actin. Double-headed arrow indicates the uniaxial stretch direction. Scale bar, 20 μm. (C) Whole-cell actin enrichment of FHL-, paxillin-, and zyxin-family proteins in unstretched (−) and stretched (+) MEFs (20 ≤ n ≤ 63). Bars represent means. Dunnett’s T3 multiple comparison test after Welch’s ANOVA: NS, p > 0.05; * p < 0.05; ** p < 0.01; *** p < 0.001. See also Figures S1–S2.
Figure 2.
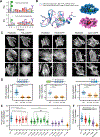
Figure 2.. LIM domains are sufficient for SF mechanoaccumulation, which can be negatively regulated by sequence context.
(A) Confocal slices of phalloidin-stained SFs (top) and eGFP-labeled FHL-family proteins (bottom). Images are cropped around individual SFs. Scale bar, 2 μm. (B) SF enrichments of eGFP-labeled FHL-family proteins in unstretched (−) and stretched (+) MEFs. Each data point is obtained from a single SF (28 ≤ n ≤ 226, N = 2 biological replicates). (C,D) SF enrichments of FL (C) and LDO (D) proteins of paxillin and zyxin families in unstretched (−) and stretched (+) MEFs. Each data point is obtained from a single SF (27 ≤ n ≤ 243, N = 2 biological replicates). Bars represent means. Games-Howell’s multiple comparison test after Welch’s ANOVA: NS, p > 0.05; ** p < 0.01; *** p < 0.001; **** p < 0.0001. Outliers (Methods, Table S1) are not displayed. (E) Difference between mean SF enrichments in stretched and unstretched MEFs of FL (circles) versus LDO (squares) versions of each protein. Error bars represent standard error of the difference between the means. See also Figure S3 and Table S1.
Figure 3.
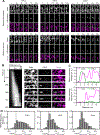
Figure 3.. The LIM domains of FHL confer actin repair activity when fused to the zyxin N-terminus.
(A) Schematic of zyxin and zyxin-FHL chimeras. Numbers indicate residue ranges. (B) Maximum intensity projections (MIPs) of confocal z-stacks of stretched zyxin null MEFs expressing eGFP-labeled constructs. Top, eGFP. Middle, F-actin (phalloidin). Bottom, endogenous VASP (immunostaining). Blue boxes highlight constructs supporting VASP recruitment to SFs. Double-headed arrow indicates the uniaxial stretch direction. Scale bar, 10 μm. (C) Whole-cell actin enrichment of endogenous VASP in stretched zyxin null MEFs expressing the constructs shown in B. Bars represent means. 7 ≤ n ≤ 39. Dunnett’s T3 multiple comparison test after Welch’s ANOVA: NS, p > 0.05; ** p < 0.01; *** p < 0.001; **** p < 0.0001. (D) Top, spinning-disk confocal snapshot of a zyxin-null MEF co-expressing F-tractin-mApple (magenta) and zyxin-FHL3-eGFP (green). Scale bar, 10 μm. Bottom, zoomed view of boxed region. Arrow heads highlight SF strain sites. Scale bar, 3 μm. (E) Time-lapse montages of SF strain sites labelled by eGFP-labeled constructs. Scale bar, 3 μm. (F) SF strain site appearance rate. Bars represent means. Welch’s ANOVA test: NS, p > 0.05. (G) SF strain site break frequency. Gray bars: number of repairs; colored bars: number of breaks. The number of strain sites in each category is indicated. Fisher’s exact test: *** p < 0.001; **** p < 0.0001.
Figure 4.
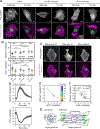
Figure 4.. Conserved phenylalanines in mechanoresponder LIM domains additively contribute to mechano-accumulation.
(A) Multiple sequence alignment logos highlight the conserved phenylalanine (position 0) in mechanoresponder LIM domains (top), which is variable in non-mechanoresponder LIM domains (bottom). (B) Superimposed ribbon diagrams (left) and space-filling representations (right) of FHL2 LIM2 and LIMS1 LIM4. The conserved phenylalanine in FHL2 LIM2 (F131) and the histidine at the same location in LIMS1 LIM4 (H238) are highlighted in green and red, respectively. (C) Epifluorescence micrographs of MEFs expressing the indicated eGFP-labeled constructs, stained with phalloidin to label F-actin. Scale bar, 20 μm. (D) Top: Primary sequence positions of conserved phenylalanines. The divergent third LIM domain of zyxin is highlighted in bright blue. Bottom: Whole-cell actin enrichment of constructs shown in C. Left, FHL2 (84 ≤ n ≤ 151); middle, HIC5 (60 ≤ n ≤ 87); right, zyxin (90 ≤ n ≤ 101). N = 2 biological replicates. Games-Howell’s multiple comparison test after Welch’s ANOVA: **** p < 0.0001. (E) Whole-cell actin enrichments of FHL2 constructs with zero (blue, n = 151), one (red, 112 ≤ n ≤ 138), two (green, 93 ≤ n ≤ 138), three (purple, 109 ≤ n ≤ 121), and four (orange, n = 112) phenylalanine mutations. N = 2 biological replicates. Welch’s ANOVA test: **** p < 0.0001. (F) Actin enrichments of mutant constructs from E, pooled by number of lesions. Welch’s ANOVA test: **** p < 0.0001. Linear trend test (Altman, 1990): **** p < 0.0001. See also Figure S4.
Figure 5.
Figure 5.. Strain in F-actin is necessary and sufficient for direct binding by LIM proteins.
(A) Schematic of in vitro force reconstitution TIRF assay. (B) TIRF snapshots of 10% rhodamine labelled actin filaments (magenta) and FHL3-Halo (green) in the absence (left) and presence (right) of force generation. Arrows (bottom) highlight FHL3 patches. Scale bar, 5 μm. (C) Cumulative projections of detected patches of indicated Halo-tagged wild-type constructs in the absence (top) and presence (middle) of 0.5 mM ATP, as well as mutant constructs in the presence of 0.5 mM ATP (bottom), color-coded by time. Scale bar, 10 μm. (D) Cumulative relative frequency of wild-type construct binding lifetimes. Half-lives are extracted by linear interpolation; errors represent standard deviations obtained from bootstrapping (Methods). (E) Number of patches detected in equal imaging periods across trials for wildtype and mutant constructs. Bars represent means. Dunnett’s T3 multiple comparison test after Welch’s ANOVA: * p < 0.05; *** p < 0.001. One FHL3 wild-type outlier is not shown. See also Figures S5 and S6.
Figure 6.
Figure 6.. LIM proteins bind along filament regions featuring a pre-break state of F-actin.
(A) Montages of indicated constructs forming patches in the middle (top) and at the terminal segments (bottom) of actin filaments in the presence of force generation. Scale bars, 2 μm. (B) Kymograph (left, FHL3 channel) and montage (right) of an FHL3 patch. Snapshots correspond to the time points indicated along the kymograph. Scale bar, 2 μm. (C) Intensity line scan along dotted lines shown in B before (top) and after (bottom) FHL3 disappearance. (D) Log ratio histograms of actin intensity at detected patches of the indicated constructs before versus immediately after LIM-protein disappearance. Dashed line denotes equal intensity. See also Figures S5 and S6.
Figure 7.
Figure 7.. Tensed F-actin retains FHL2 in the cytoplasm.
(A) Confocal slices of MEFs expressing indicated FHL2-eGFP constructs plated on substrates of varying stiffness and stained with phalloidin (magenta) to label F-actin and DAPI (green) to label nuclei. Scale bars, 10 μm. (B) Quantification of stiffness-dependent nuclear (top) and actin (bottom) enrichment of wild-type and FHL2 F(1–4)A. N = 2 biological replicates; bars represent means. Games-Howell’s multiple comparison test after Welch’s ANOVA: NS, p > 0.05; * p < 0.05; ** p < 0.01; *** p < 0.001; **** p < 0.0001. (C) Spinning-disk confocal snapshots of FHL2-eGFP localization in a MEF before (left) and after (middle) cytochalasin D (cyto D) treatment, and after washout (right). Scale bars, 20 μm. (D) Average nuclear (top) and actin (bottom) enrichments (n = 19 cells; N = 13 biological replicates) over time, aligned at the timepoint of cyto D addition (10 min). Error bar represents SEM. Dash lines indicate cyto D addition and washout. (E) Replotting of average nuclear enrichment versus average actin enrichment as a time color-coded scatterplot. (F) Scatter plot of average nuclear enrichment versus average actin enrichment of FHL2 with zero (blue), one (red), two (green), three (purple), and four (orange) phenylalanine mutations in the indicated LIM domains. Data were extracted from experiments displayed in Figure 4E. Trend line and parameters from a linear fit are displayed. (G) Model of rigidity-dependent nuclear localization of FHL2. Magenta, SFs. Green, FAs. Blue, FHL2. See also Figure S7.

Similar articles

Cited by

References

    1. Altman D. (1990). Practical Statistics for Medical Research (Chapman & Hall; ).
    1. Arimura T, Hayashi T, Matsumoto Y, Shibata H, Hiroi S, Nakamura T, Inagaki N, Hinohara K, Takahashi M, Manatsu S-I, et al. (2007). Structural analysis of four and half LIM protein-2 in dilated cardiomyopathy. Biochemical and Biophysical Research Communications 357, 162–167. - PubMed
    1. Bauer MS, Baumann F, Daday C, Redondo P, Durner E, Jobst MA, Milles LF, Mercadante D, Pippig DA, Gaub HE, et al. (2019). Structural and mechanistic insights into mechanoactivation of focal adhesion kinase. PNAS 116, 6766–6774. - PMC - PubMed
    1. Bell S, and Terentjev EM (2017). Focal Adhesion Kinase: The Reversible Molecular Mechanosensor. Biophysical Journal 112, 2439–2450. - PMC - PubMed
    1. Brown MC, Perrotta JA, and Turner CE (1996). Identification of LIM3 as the principal determinant of paxillin focal adhesion localization and characterization of a novel motif on paxillin directing vinculin and focal adhesion kinase binding. J Cell Biol 135, 1109–1123. - PMC - PubMed

Publication types

LinkOut - more resources