. 2020 Oct 15;16(10):e1009006.
doi: 10.1371/journal.ppat.1009006. eCollection 2020 Oct.

KSHV G-protein coupled receptor vGPCR oncogenic signaling upregulation of Cyclooxygenase-2 expression mediates angiogenesis and tumorigenesis in Kaposi's sarcoma

Affiliations

KSHV G-protein coupled receptor vGPCR oncogenic signaling upregulation of Cyclooxygenase-2 expression mediates angiogenesis and tumorigenesis in Kaposi's sarcoma

María Victoria Medina et al. PLoS Pathog. .

Abstract

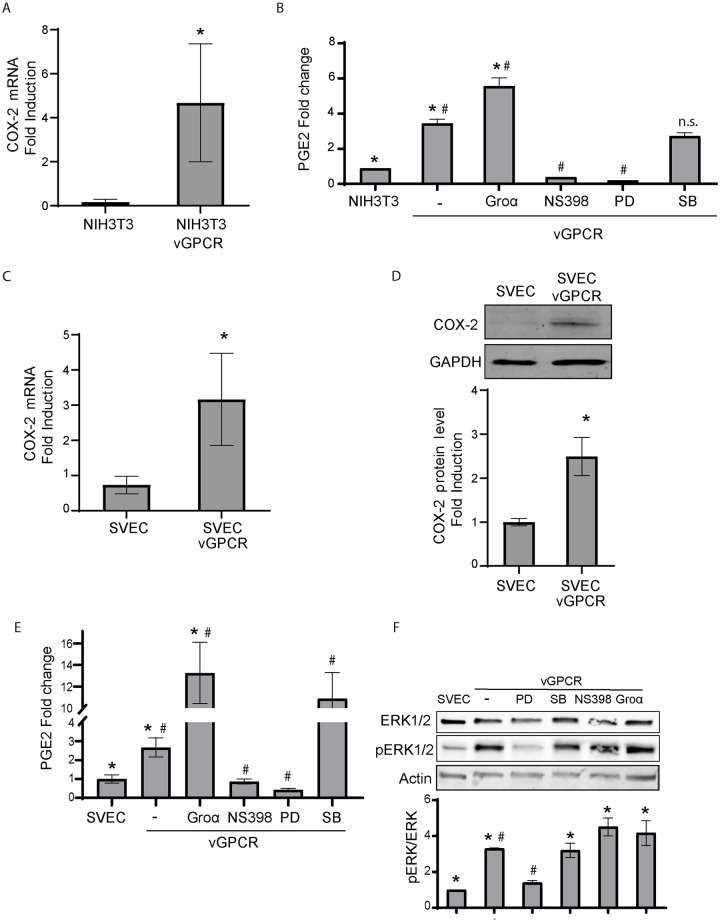
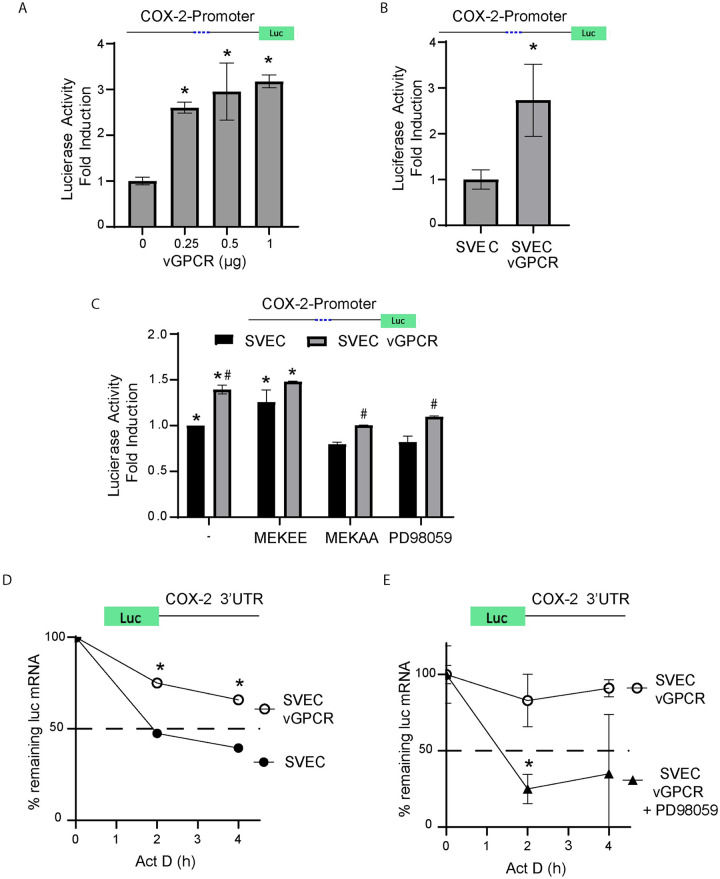
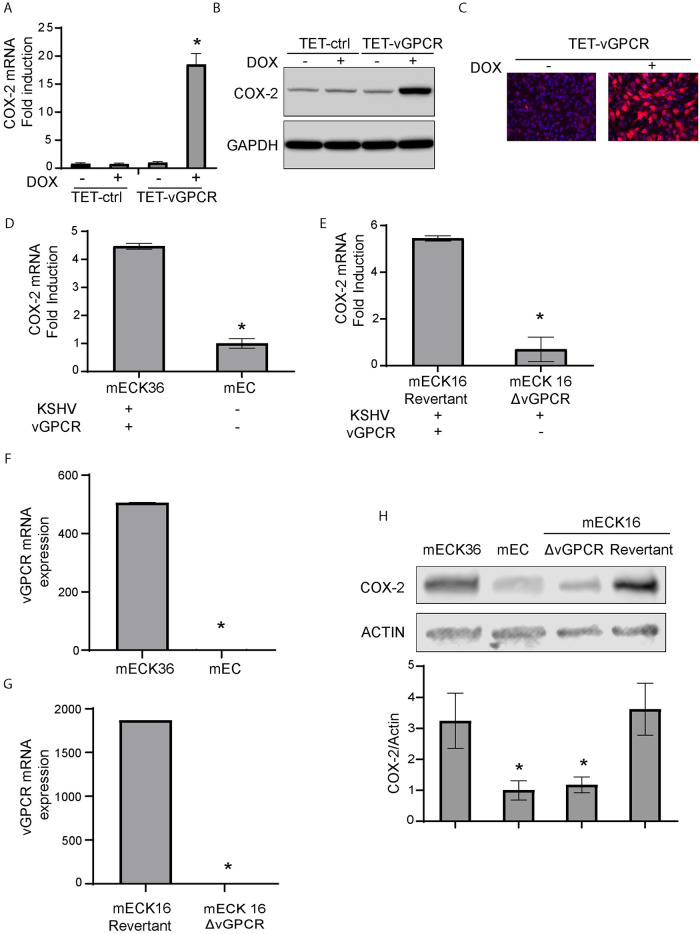
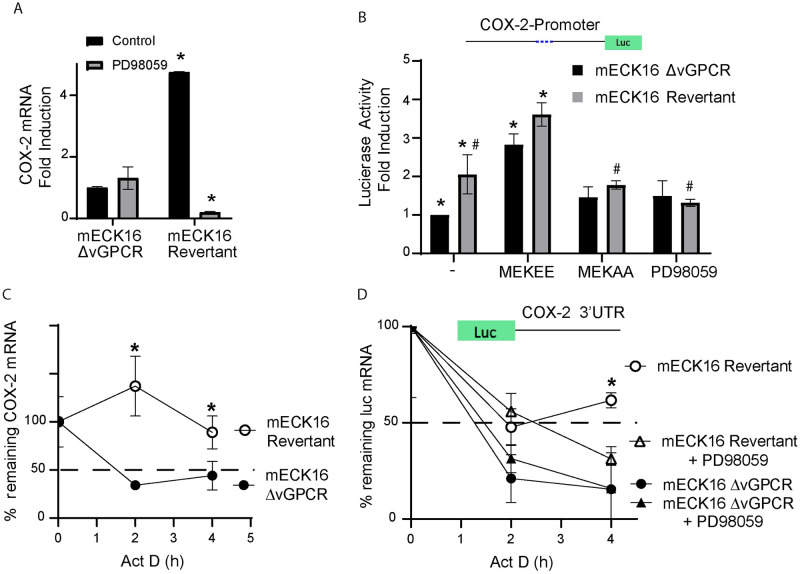
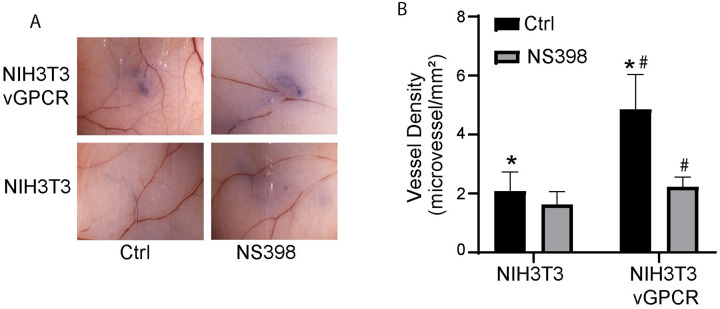
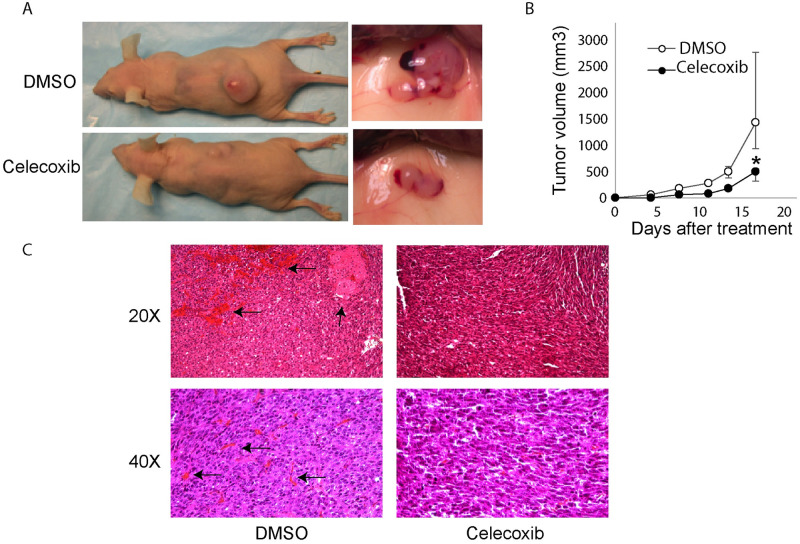
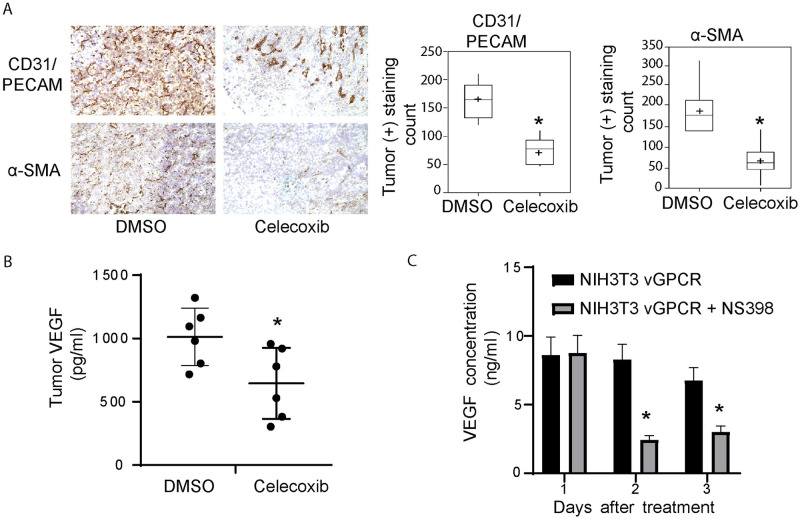
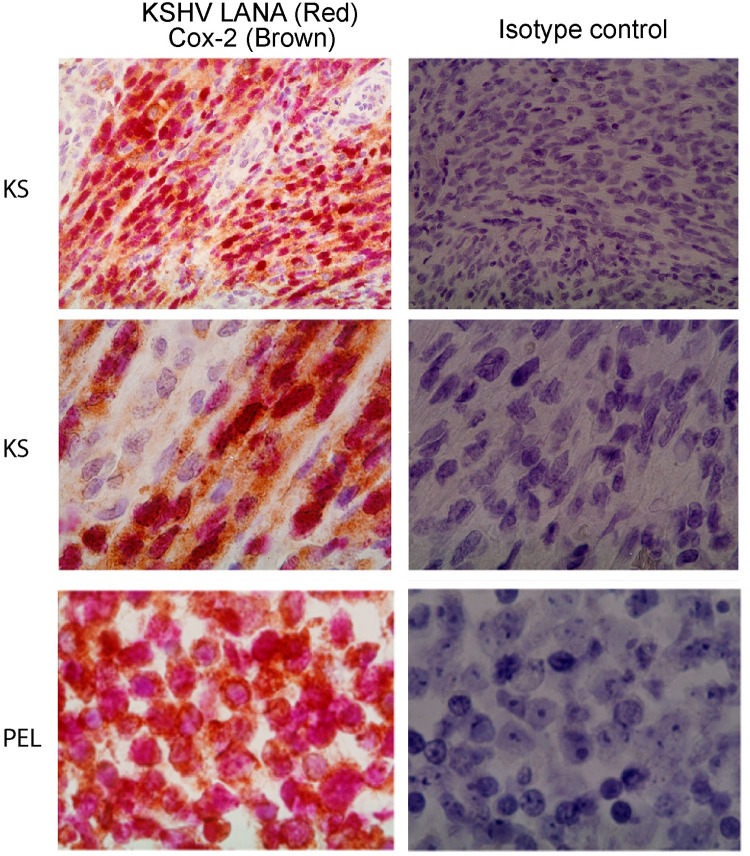
Kaposi's sarcoma-associated herpesvirus (KSHV) vGPCR is a constitutively active G protein-coupled receptor that subverts proliferative and inflammatory signaling pathways to induce cell transformation in Kaposi's sarcoma. Cyclooxygenase-2 (COX-2) is an inflammatory mediator that plays a key regulatory role in the activation of tumor angiogenesis. Using two different transformed mouse models and tumorigenic full KSHV genome-bearing cells, including KSHV-Bac16 based mutant system with a vGPCR deletion, we demostrate that vGPCR upregulates COX-2 expression and activity, signaling through selective MAPK cascades. We show that vGPCR expression triggers signaling pathways that upregulate COX-2 levels due to a dual effect upon both its gene promoter region and, in mature mRNA, the 3'UTR region that control mRNA stability. Both events are mediated by signaling through ERK1/2 MAPK pathway. Inhibition of COX-2 in vGPCR-transformed cells impairs vGPCR-driven angiogenesis and treatment with the COX-2-selective inhibitory drug Celecoxib produces a significant decrease in tumor growth, pointing to COX-2 activity as critical for vGPCR oncogenicity in vivo and indicating that COX-2-mediated angiogenesis could play a role in KS tumorigenesis. These results, along with the overexpression of COX-2 in KS lesions, define COX-2 as a potential target for the prevention and treatment of KSHV-oncogenesis.


Conflict of interest statement

The authors declare no competing financial interests.

Figures

Fig 1
Fig 1. vGPCR oncogene expression increases COX-2 mRNA and protein expression levels as well as COX-2 activity.
A) Fold-changes of COX-2 mRNA expression in transformed NIH3T3 (NIHT3T3-vGPCR) cells that stably express the vGPCR oncogene and control cells were assessed by RT-qPCR in triplicate and are presented as means ± SD. (*P <0.05). B) NIH3T3 cells were transfected with vGPCR expression vectors and were incubated ON in serum-free media. The vGPCR full agonist Gro-α (25nM), the COX-2 inhibitor NS398 (10uM), the ERK1/2 MAPK inhibitor PD98059 (20uM), or the p38 inhibitor SB220025 (10uM) were added to the cells as indicated. COX-2 activity was assessed measuring PGE2 production in the supernatants by an ELISA. Bars indicate mean PGE2 production of duplicate determinations ± SD. (*) Indicates significant differences between NIH3T3 control cells and the NIH3T3-vGPCR group of samples (P<0.05). (#) Indicates significant differences between sets of NIH3T3-vGPCR cells (P<0.05). C) Fold-changes of COX-2 mRNA expression in transformed SVEC (SVEC-vGPCR) cells that stably express the vGPCR oncogene and control cells were assessed by RT-qPCR in triplicate and are presented as means ± SD. (*P <0.05). D) COX-2 protein expression levels were determined by immunoblotting in SVEC cells that stably express the vGPCR oncogene. GAPDH was used as a loading control. COX-2 protein levels were measured in triplicate and are presented as means ± SD. (*P <0.05). E) SVEC cells were transfected with vGPCR expression vectors and were incubated ON in serum-free medium. The vGPCR full agonist Gro-α (25nM), the COX-2 inhibitor NS398 (10uM), the ERK1/2 MAPK inhibitor PD98059 (20uM), or the p38 inhibitor SB203580 (10uM) were added to the cells as indicated. COX-2 activity was assessed measuring PGE2 production in the cell supernatants by an ELISA. Bars indicate mean PGE2 production of duplicate determinations ± SD. (*) Indicates significant differences between samples from SVEC control cells and the SVEC-vGPCR group of samples (P<0.05). (#) Indicates significant differences between sets of SVEC-vGPCR cells (P<0.05). F) Total and phospho-ERK1/2 levels were determined by immunoblotting in SVEC cells transfected with vGPCR. The ERK1/2 MAPK inhibitor PD98059 (20uM), the p38 inhibitor SB203580 (10uM), the COX-2 inhibitor NS398 (10uM), or the vGPCR full agonist Gro-α (25nM) were added to the cells as indicated. Actin was used as loading control. pERK1/2 levels related to Total ERK1/2 levels were measured in triplicate and are presented as means ± SD. (*) Indicates significant differences between samples from SVEC control cells and the SVEC-vGPCR group of samples (P<0.05). (#) Indicates significant differences between sets of SVEC-vGPCR cells (P<0.05).
Fig 2
Fig 2. vGPCR signaling regulates COX-2 promoter activity and induces mRNA stability via ERK1/2.
A) SVEC cells were transfected at increasing concentrations with a vGPCR expression vector and a luciferase reporter plasmid under the control of the COX-2 promoter. Luciferase activity expressed as fold induction relative to control cells that do not express vGPCR. Luciferase activity was measured in triplicate and is presented as means ± SD. (*P<0.05). B) Stably transfected SVEC-vGPCR cells and control cells were transfected with a luciferase reporter plasmid under the control of the COX-2 promoter. Luciferase activity was measured in triplicate and is presented as means ± SD. (*P<0.05) and expressed as fold induction relative to control cells. C) A reporter that expresses Luciferase under the control of a COX- 2 gene promoter region was co-transfected with a vGPCR expression vector and plasmids expressing constitutively active and dominant negative MAP kinase kinases (MEKEE and MEKAA respectively) or treated with the MEK/ERK1-2 inhibitor PD98059. Luciferase activity was tested and presented as fold induction relative to SVEC control cells. (*) Indicates significant differences relative to SVEC control untreated cells (P<0.05). (#) Indicates significant differences relative to SVEC-vGPCR untreated cells (P<0.05). D) mRNA stability assays were performed using a reporter plasmid containing the COX-2 3’UTR region cloned downstream of the luciferase ORF from SVEC or SVEC-vGPCR cells. Actinomycin D (5 μg/ml) was added (t = 0) to arrest transcription, and mRNA levels of Luciferase mRNA were analyzed by qRT-PCR following a time course (4 hours). Luciferase mRNA was measured in triplicate and is presented as means ± SD. (*P <0.05). E) mRNA stability assays in SVEC-vGPCR cells transfected with the same reporter plasmid as in D) in the presence or absence of the MEK/ERK1-2 inhibitor PD98059 (20 uM). Actinomycin D (5 μg/ml) was added (t = 0) to arrest transcription, and mRNA levels of Luciferase mRNA were analyzed by qRT-PCR following a time course (4 hours). Luciferase mRNA was measured in triplicate and is presented as means ± SD. (*P<0.05).
Fig 3
Fig 3. Use of full KSHV genome bearing cells to analyze COX-2 expression regulation by vGPCR.
A) Fold-changes of COX-2 mRNA expression determined by RT-qPCR in Tetracycline-inducible vGPCR (TET-vGPCR) and control mECK36 cells stimulated with doxycycline for 24 hours. COX-2 mRNA was measured in triplicate and is presented as means ± SD. (*P<0.05). B) COX-2 protein expression levels were determined by immunoblotting in Tetracycline-inducible vGPCR (TET-vGPCR) and control mECK36 cells stimulated with doxycycline for 24 hours. GAPDH was used as a loading control. C) IFA for COX-2 (red) in Tetracycline-inducible vGPCR (TET-vGPCR) and control mECK36 cells stimulated with doxycycline for 24 hours. Cell nuclei were counterstained with DAPI (blue). D) Fold-changes of COX-2 mRNA expression determined by RT-qPCR in mECK36 and mEC cells (originated from the former and generated by selection of those that have lost the KSHVBAC36). COX-2 mRNA was measured in triplicate and is presented as means ± SD. (*P<0.05). E) Fold-changes of COX-2 mRNA expression determined by RT-qPCR in mECK16 derived Δ-vGPCR or revertant virus (see Materials and methods). COX-2 mRNA was measured in triplicate and is presented as means ± SD. (*P<0.05). F) vGPCR mRNA expression determined by RT-qPCR in mECK36 and mEC cells (KSHV-negative cells originated from the former and generated by selection of those that have lost the KSHVBAC36). The lowest CT value obtained in KSHV-negative mEC cell samples was assigned as the limit of detection for vGCPR expression. vGPCR mRNA was measured in triplicate and is presented as means ± SD. (*P<0.05). G) vGPCR mRNA expression determined by RT-qPCR in mECK16 derived Δ-vGPCR or revertant virus (see Materials and methods). The lowest CT value obtained in mECK16 Δ-vGPCR cell samples was assigned as the limit of detection for vGCPR expression. vGPCR mRNA was measured in triplicate and is presented as means ± SD. (*P<0.05). H) COX-2 protein expression levels were determined by immunoblotting in mECK36, mEC and mECK16 derived Δ-vGPCR or revertant virus (see Materials and methods). COX-2 protein levels were measured in triplicate and are presented as means ± SD. (*P<0.05).
Fig 4
Fig 4. vGPCR regulates COX-2 promoter activity and mRNA stability via ERK1/2 in full KSHV genome bearing cells.
A) Fold-changes in mRNA expression determined by RT-qPCR in mECK16 derived cells (Δ-vGPCR or revertant virus) after treatment with ERK1/2 MAPK inhibitor PD98059 (20uM). COX-2 mRNA was measured in triplicate and is presented as means ± SD. (*P<0.05). B) mECK16 derived Δ-vGPCR and revertant cells were transfected with a luciferase reporter plasmid under the control of the COX-2 promoter (as in Fig 2A). Luciferase activity is expressed as fold induction relative to control cells. Cells were co-transfected with plasmids expressing constitutively active and dominant negative MAP kinase kinases (MEKEE and MEKAA respectively) or treated with the MEK/ERK1-2 inhibitor PD98059. (*) Indicates significant differences from mECK16 Δ-vGPCR untreated cells (P<0.05). (#) Indicates significant differences between mECK16 revertant untreated cells (P<0.05). C) mRNA stability assay in mECK16 derived (Δ-vGPCR and revertant) cells. Actinomycin D (5 μg/ml) was added (t = 0) to arrest transcription, and mRNA levels of COX-2 were analyzed by qRT-PCR following a time course (4 hours). COX-2 mRNA was measured in triplicate and is presented as means ± SD. (*P<0.05). D) mRNA stability assay in mECK16 derived (Δ-vGPCR and revertant) cells transfected with a reporter plasmid containing the COX-2 3’UTR region cloned downstream of the luciferase ORF in the presence or absence of the MEK/ERK1-2 inhibitor PD98059 (20 uM). Actinomycin D (5 μg/ml) was added (t = 0) to arrest transcription, and mRNA levels of Luciferase were analyzed by qRT-PCR following a time course (4 hours). Luciferase mRNA was measured in triplicate and is presented as means ± SD. (*P<0.05).
Fig 5
Fig 5. COX-2 regulates vGPCR angiogenicity.
A) Cells expressing vGPCR and corresponding controls were treated or not with NS398 (10 mM) and inoculated I.D. into both flanks of nude mice (n = 5). Mice were sacrificed after 5 days and the area of inoculation was photographed under a dissection microscope. B) Neovessel formation determined by morphometric analysis. The bar graphs show the mean microvessel density (vessels/mm2) for NS398 pre-treated (grey bars) or untreated (black bars) cells +/-SD. Total n (both flanks) = 10. (*) Indicates significant differences between groups injected with vGPCR-transformed cells and NIH3T3 control cells (P<0.05). (#) Indicates significant differences between groups injected with NS398-treated and non-treated vGPCR-transformed cells (P<0.01).
Fig 6
Fig 6. vGPCR-transformed cells tumorigenicity is inhibited by Celecoxib treatment.
A) Mice (n = 7) were injected S.C. with vGPCR-NIH3T3 cells and treated with the COX-2 inhibitor Celecoxib I.P. or vehicle (DMSO) three times/week. On the left side, images of mice treated (lower) or not (upper) with Celecoxib at day 15 of treatment. Tumor from non-treated (upper) or treated with Celecoxib (lower) mice are shown in detail on the right. B) The plot shows the growth of tumor volume during the time of treatment (mean +/-range). Higher deviation in the last day for untreated animals reflect the presence of animals with very large tumors by that day observed in all the experiments. Mice were treated with Celecoxib (black circles) or vehicle (white circles). Tumor size was significantly lower in Celecoxib treated samples at all points of the time course (*P<0.05). C) Histological examination of the tumors. Sections of tumors coming from mice, treated with Celecoxib or not (DMSO) as a control, were stained with Hematoxylin-Eosin. Pictures were taken at 20x or 40x magnification. Black arrows in left panels indicates large areas of hemorrhage and necrosis.
Fig 7
Fig 7. Celecoxib treatment inhibits vGPCR tumor angiogenesis and VEGF production in the tumor and transformed cells.
A) Left panels: Immunoperoxidase staining for CD31/PECAM or SMA was performed on tumor sections. CD31/PECAM and SMA staining images of Celecoxib treated or untreated animals are shown. Right panel: Data of staining intensity levels is represented on box-plots showing the results for the morphometric quantification of CD31/PECAM (left) (*P<0.001) and αSMA (right) (*P<0.01) staining (n = 7). B) Tumor samples for mice tested for tumorigenesis were homogenized and centrifuged. VEGF production was measured in the supernatants by ELISA in Celecoxib treated mice or DMSO controls. The plot shows the mean of each group and the value of individual determinations (black circles) (*P<0.001) (n = 7). C) vGPCR-transformed NIH3T3 cells were cultured for the indicated time and treated (grey bars) or not (black bars) with NS398 (10uM). VEGF production was measured in the supernatants by ELISA. (*P<0.05).
Fig 8
Fig 8. COX-2 is expressed in KSHV infected spindle cells of Kaposi’s sarcoma lesions.
Sections from KS biopsies (two top panels, same patient at different magnification) or PEL (bottom panels) were incubated with COX-2 and KSHV LANA antibodies (left panels) or Isotype control (right panels). COX-2 (cytoplasmic) bound antibodies were developed with DAB (BROWN colored). KSHV LANA (nuclear) bound antibodies were developed with BP Red substrate (RED colored).

Similar articles

Cited by

References

    1. Safai B, Johnson KG, Myskowski PL, Koziner B, Yang SY, Winningham-Ruddles S, et al. The Natural History of Kaposi’s Sarcoma in Acquired Immuno Deficiency Syndrome. Ann Int Med. 1985;103:744–50. 10.7326/0003-4819-103-5-744 - DOI - PubMed
    1. Gallo RC. The enigmas of Kaposi’s sarcoma. Science. 1998;282(5395):1837–9. 10.1126/science.282.5395.1837 - DOI - PubMed
    1. Cesarman E, Damania B, Krown SE, Martin J, Bower M, Whitby D. Kaposi sarcoma. Nat Rev Dis Primers. 2019;5(1):9 10.1038/s41572-019-0060-9 . - DOI - PMC - PubMed
    1. Mesri EA, Cesarman E, Boshoff C. Kaposi’s sarcoma and its associated herpesvirus. Nat Rev Cancer. 2010;10(10):707–19. 10.1038/nrc2888 - DOI - PMC - PubMed
    1. Ensoli B, Sturzl M. Kaposi’s sarcoma: a result of the interplay among inflammatory cytokines, angiogenic factors and viral agents. Cytokine & Growth Factor Reviews. 1998;9(1):63–83. - PubMed

Publication types

MeSH terms