. 2020 Oct 14;11(1):5171.
doi: 10.1038/s41467-020-18956-x.

Synapse type-specific proteomic dissection identifies IgSF8 as a hippocampal CA3 microcircuit organizer

Affiliations

Synapse type-specific proteomic dissection identifies IgSF8 as a hippocampal CA3 microcircuit organizer

Nuno Apóstolo et al. Nat Commun. .

Abstract

Excitatory and inhibitory neurons are connected into microcircuits that generate circuit output. Central in the hippocampal CA3 microcircuit is the mossy fiber (MF) synapse, which provides powerful direct excitatory input and indirect feedforward inhibition to CA3 pyramidal neurons. Here, we dissect its cell-surface protein (CSP) composition to discover novel regulators of MF synaptic connectivity. Proteomic profiling of isolated MF synaptosomes uncovers a rich CSP composition, including many CSPs without synaptic function and several that are uncharacterized. Cell-surface interactome screening identifies IgSF8 as a neuronal receptor enriched in the MF pathway. Presynaptic Igsf8 deletion impairs MF synaptic architecture and robustly decreases the density of bouton filopodia that provide feedforward inhibition. Consequently, IgSF8 loss impairs excitation/inhibition balance and increases excitability of CA3 pyramidal neurons. Our results provide insight into the CSP landscape and interactome of a specific excitatory synapse and reveal IgSF8 as a critical regulator of CA3 microcircuit connectivity and function.


Conflict of interest statement

The authors declare no competing interests.

Figures
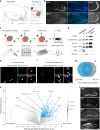
Fig. 1
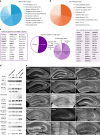
Fig. 1. Isolation and proteomic profiling of MF synaptosomes.
a Cartoon illustrating the hippocampal MF synapse. GC neurons, mossy fibers (MFs), MF bouton, and filopodia are in orange. CA3 pyramidal neuron and respective thorny excrescences are in blue. Stratum lucidum (SL) interneuron (IN) is in purple. DG dentate gyrus. b Confocal images of P28 mouse hippocampal sections immunostained for Synpr, Nectin3, and VGluT1. Magnified insets of the SL in CA3 are shown on the right. c Workflow to isolate and analyze MF synaptosomes. d Validation of enrichment for MF synaptosomes in sorted material by western blot. MPB, myelin-binding protein. e, f Confocal images of presorted and sorted material, respectively, immunostained for Nectin3, Synpr, VGluT1, and Hoechst. g Venn diagram capturing number and distribution of proteins identified in sorted MF synaptosomes and P2 synaptosomes by LC–MS/MS in three independent experiments (10–12 mice per experiment). h Relative distribution of proteins detected in sorted MF synaptosomes and P2 synaptosomes. Significant proteins with positive MF/P2 synaptosome log2 fold change are highlighted in blue (p value ≤ 0.05, two-sided Student’s t test). High-confidence measurements at a 5% FDR are shown as closed circles (q value ≤ 0.05, Benjamini–Hochberg correction). A selection of known MF synaptic proteins is annotated in orange. i Confocal images of P28 mouse hippocampal sections immunostained for known MF synaptic markers detected in sorted MF synaptosomes. Source data are provided as a Source data file. Scale bars in b and i 200 μm, in e and f 5 μm.
Fig. 2
Fig. 2. Dissection of MF synapse CSP composition.
a Protein functional classes represented in the group of CSPs identified in isolated MF synaptosomes. b Occurrence of protein domains among identified CSPs. c SynGO cellular component analysis of CSP genes (75) and respective CSPs (77). Discrepancy between gene number and CSP number is related to NRXN isoforms. Proteins with unknown function in the brain are highlighted in bold with an asterisk: APMAP, BRINP2, FAM171A2, and IgSF8. d Validation of 15 CSPs in sorted MF synaptosomes by western blot, including BRINP2 and IgSF8, CSPs without a known function in the brain. e Confocal images of P28 mouse hippocampal sections immunostained for 15 CSPs showing a striking laminar distribution to the SL. Of the CSPs without a known function in the brain, IgSF8 showed strong labeling in the MF pathway. Source data are provided as a Source data file. Scale bar in e 200 μm.
Fig. 3
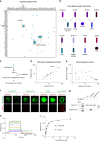
Fig. 3. MF synapse CSP interactome screening.
a Global matrix of data obtained from three independent experiments for interactions between 73 AP- and Fc-tagged proteins in both orientations (i.e., AP-X vs Fc-Y and AP-Y vs Fc-X), resulting in 73 × 73 = 5329 experimental points and 2701 unique pairwise interactions. Columns contain AP-fusion baits, including the AP-only construct as negative control, whereas rows contain Fc-fusion preys. Positive ligand–receptor interactions are indicated in blue. Two major modules of known ligand–receptor pairs are highlighted in orange: the NRXNs–NLGNs and the IgLON family. b Interaction networks of novel ligand–receptor pairs identified. Among these, the interaction between IgSF8 and TenR was the only one including a CSP of uncharacterized brain function. c Cartoon illustrating the Ecto-Fc MS workflow to validate IgSF8–TenR interaction in synaptosomes. d Graph of spectral and peptide counts of proteins captured in a pull-down experiment using whole rat brain synaptosome lysates. Only proteins which were absent in Fc controls and present with ≥2 spectral counts per IgSF8-ecto-Fc experiment are included. TenR is highlighted in blue. e Graph of spectral counts of proteins captured in two independent pull-down experiments using P21 mouse MF synaptosome lysates. Only proteins with ≤1 spectral counts in Fc controls and ≥2 spectral counts per IgSF8-ecto-Fc experiment are included. TenR is highlighted in blue. f Confocal images of cell-surface binding assays in transfected HEK293T cells show IgSF8–TenR interaction. Negative and positive controls used in the cell-surface binding assays are also shown. g Direct binding assays show direct and specific interaction of IgSF8 with TenR, but not with ECM protein Brevican. h Biolayer interferometry experiment of the IgSF8–TenR interaction. A concentration range of purified IgSF8 (34–0.133 µM) was used in twofold dilution plus buffer alone (red straight line). i Plotting the binding response (nm) vs IgSF8 concentration provided a measure of the affinity of the interaction (KD ~ 1.4 µM). Source data are provided as a Source data file. Scale bar in f 5 μm.
Fig. 4
Fig. 4. IgSF8 localizes to MF boutons and filopodia.
a Cartoon of IgSF8 protein topology. b Western blot analysis of IgSF8 protein expression levels in mouse hippocampal homogenates at different developmental time points. Bar graph shows mean. Quantification from two independent experiments. c Subcellular fractionation using whole rat brains. H homogenate, CM crude membrane, Syn synaptosomes, Pre presynaptic fraction, PSD postsynaptic density fraction. d Western blot analysis of Igsf8 cKO mouse primary hippocampal cultures infected with a lentiviral vector harboring Cre recombinase or control vector. Bar graph shows mean ± SEM. Quantification from three independent experiments. e Confocal images of P28 Rbp4-Cre:Igsf8 cKO mouse hippocampal sections immunostained for IgSF8 and Synpr. Arrowheads indicate SL. Magnified insets of the SL in CA3 are shown on the right. f In utero electroporation setup to sparsely label DG granule cell neurons using membrane GFP (mGFP) and analyze the localization of HA-IgSF8 in MF synapses. g Stack of confocal images showing a mGFP-labeled MF bouton and respective filopodia (in blue in the merge). HA-IgSF8 is concentrated in the MF bouton, but also observed in defined regions along the filopodia, including their terminals (in green in the merge). More examples are shown in Supplementary Fig. 4e. Source data are provided as a Source data file. Scale bars in e 200 μm and in g 10 μm.
Fig. 5
Fig. 5. Loss of IgSF8 impairs MF synapse architecture and filopodia density.
a Electron microscope images of MF-CA3 synapses from Rbp4-Cre:Igsf8 cKO and WT littermates (5000× magnification). MF boutons are highlighted in orange. AZs and PSDs are highlighted in green and red, respectively. b Graphs show quantification of analysis done in a in littermate mice examined over three independent experiments (WT, n = 135 boutons and cKO, n = 136). ****P < 0.0001 and **P = 0.0028 in upper panel. ****P < 0.0001 and **P = 0.0056 in lower panel. c Electron microscope images of MF-CA3 synapses from Rbp4-Cre:Igsf8 cKO and WT littermates (2500× magnification) to analyze number and area of MF boutons, highlighted in orange. d Graphs show quantification of analysis done in c in littermate mice examined over three independent experiments (WT, n = 103 images and cKO, n = 93). e Experimental design to analyze structural changes in MF synapses following deletion of Igsf8 specifically in DG granule cells. f Stacks of confocal images of individual MF boutons (left) and respective 3D reconstructions (right) to analyze number of MF bouton filopodia and MF bouton volume. Arrowheads show filopodia emerging from MF boutons. g Graphs show quantification of analysis done in f in littermate mice examined over three independent experiments (mGFP, n = 27 boutons and mGFP-T2A-Cre n = 29). ****P < 0.0001 and *P = 0.0149 in g. Box-and-whisker plots in b, d and g show median, interquartile range, minimum, and maximum. Two-sided Mann–Whitney tests were used in b and g. Unpaired Student’s t tests were used in d. n.s. not significant. Source data are provided as a Source data file. Scale bars in a 1 μm, in c 2 μm, and in f 5 μm.
Fig. 6
Fig. 6. Loss of IgSF8 impairs spontaneous synaptic transmission in CA3 neurons.
a Representative sEPSC traces from whole-cell voltage-clamp recordings of CA3 neurons in acute hippocampal slices of Rbp4-Cre:Igsf8 cKO and WT littermates. b Cumulative distribution of sEPSC inter-event intervals. c Quantification of sEPSC frequency in littermate mice examined over three independent experiments (WT, n = 31 neurons and cKO, n = 38). **P = 0.008. d Cumulative distribution of sEPSC amplitudes. e Quantification of sEPSC amplitudes in littermate mice examined over three independent experiments (WT, n = 31 neurons and cKO, n = 38). **P = 0.002. f Cartoon illustrating whole-cell voltage-clamp recordings of CA3 neurons to measure MF-evoked responses in acute hippocampal slices of Rbp4-Cre:Igsf8 cKO and WT littermates using optogenetics. g Representative traces of paired-pulse ratio in Rbp4-Cre:Igsf8 cKO and WT littermates using optogenetics. h Quantification of first evoked amplitudes in littermate mice examined over three independent experiments (WT, n = 23 neurons and cKO, n = 21). i Quantification of paired-pulse ratios in littermate mice examined over three independent experiments (WT, n = 23 neurons and cKO, n = 21). Box-and-whisker plots in c and e show median, interquartile range, minimum, and maximum. Graphs in h and i show mean ± SEM. Two-sided Mann–Whitney tests were used in c and e. Source data are provided as a Source data file.
Fig. 7
Fig. 7. Reduced feedforward inhibition and increased excitability of CA3 neurons in Igsf8 cKO.
a Cartoon illustrating whole-cell voltage-clamp recordings of CA3 neurons to measure MF-evoked responses in acute hippocampal slices of Rbp4-Cre:Igsf8 cKO and WT littermates using optogenetics. b Cartoon illustrating feedforward inhibition microcircuit in CA3. Plus and minus signs represent excitatory and inhibitory synapses, respectively. c Representative eEPSC and eIPSC traces from CA3 pyramidal neurons in WT or cKO mice. d Quantification of excitation–inhibition balance in CA3 neurons in WT and cKO mice in littermate mice examined over three independent experiments (WT, n = 35 neurons and cKO, n = 29). ***P = 0.0003. e Representative eEPSP traces from CA3 pyramidal neurons in WT or cKO mice. f Quantification of resting membrane potentials and eEPSC amplitudes of CA3 neurons in WT and cKO littermate mice examined over three independent experiments (WT, n = 13 neurons and cKO, n = 14). g Quantification of induced action potential firing in CA3 neurons in WT and cKO littermate mice examined over three independent experiments (WT, n = 13 neurons and cKO, n = 14) after a 10 Hz train of 20 stimuli. *P = 0.03 and **P = 0.01 in g. Box-and-whisker plots in d and f show median, interquartile range, minimum, and maximum. Graph in g shows mean ± SEM. Two-sided Mann–Whitney tests were used in d and g. Source data are provided as a Source data file.

Similar articles

Cited by

References

    1. Rao-Ruiz P, Yu J, Kushner SA, Josselyn SA. Neuronal competition: microcircuit mechanisms define the sparsity of the engram. Curr. Opin. Neurobiol. 2019;54:163–170. doi: 10.1016/j.conb.2018.10.013. - DOI - PMC - PubMed
    1. Silberberg G, Grillner S, LeBeau FEN, Maex R, Markram H. Synaptic pathways in neural microcircuits. Trends Neurosci. 2005;28:541–551. doi: 10.1016/j.tins.2005.08.004. - DOI - PubMed
    1. Grillner S, Markram H, De Schutter E, Silberberg G, LeBeau FEN. Microcircuits in action–from CPGs to neocortex. Trends Neurosci. 2005;28:525–533. doi: 10.1016/j.tins.2005.08.003. - DOI - PubMed
    1. Rebola N, Carta M, Mulle C. Operation and plasticity of hippocampal CA3 circuits: implications for memory encoding. Nat. Rev. Neurosci. 2017;18:208–220. doi: 10.1038/nrn.2017.10. - DOI - PubMed
    1. Chicurel ME, Harris KM. Three-dimensional analysis of the structure and composition of CA3 branched dendritic spines and their synaptic relationships with mossy fiber boutons in the rat hippocampus. J. Comp. Neurol. 1992;325:169–182. doi: 10.1002/cne.903250204. - DOI - PubMed

Publication types