. 2020 Nov 5;7(6):ENEURO.0278-20.2020.
doi: 10.1523/ENEURO.0278-20.2020. Print 2020 Nov/Dec.

The Interaction of Munc18-1 Helix 11 and 12 with the Central Region of the VAMP2 SNARE Motif Is Essential for SNARE Templating and Synaptic Transmission

Affiliations

The Interaction of Munc18-1 Helix 11 and 12 with the Central Region of the VAMP2 SNARE Motif Is Essential for SNARE Templating and Synaptic Transmission

Timon André et al. eNeuro. .

Abstract

Sec1/Munc18 proteins play a key role in initiating the assembly of N-ethylmaleimide-sensitive factor attachment protein receptor (SNARE) complexes, the molecular fusion machinery. Employing comparative structure modeling, site specific crosslinking by single amino acid substitutions with the photoactivatable unnatural amino acid p-Benzoyl-phenylalanine (Bpa) and reconstituted vesicle docking/fusion assays, we mapped the binding interface between Munc18-1 and the neuronal v-SNARE VAMP2 with single amino acid resolution. Our results show that helices 11 and 12 of domain 3a in Munc18-1 interact with the VAMP2 SNARE motif covering the region from layers -4 to +5. Residue Q301 in helix 11 plays a pivotal role in VAMP2 binding and template complex formation. A VAMP2 binding deficient mutant, Munc18-1 Q301D, does not stimulate lipid mixing in a reconstituted fusion assay. The neuronal SNARE-organizer Munc13-1, which also binds VAMP2, does not bypass the requirement for the Munc18-1·VAMP2 interaction. Importantly, Munc18-1 Q301D expression in Munc18-1 deficient neurons severely reduces synaptic transmission, demonstrating the physiological significance of the Munc18-1·VAMP2 interaction.

Keywords: Munc18-1; SNARE; VAMP2; crosslinking; membrane fusion; neurotransmission.


Figures

Figure 1.
Figure 1.
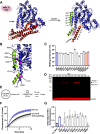
Layers −4 to +4 of VAMP2 bind to helix 11 and helix 12 of Munc18-1. A, Crystal structure (PDB:3C98) of Munc18-1 (blue) bound to the inhibitory, closed conformation of syntaxin-1 (Habc-domain: red, SNARE motif: orange). The loop connecting helix 11 and 12 of Munc18-1 (pink) is in a furled conformation. Structural model of the template complex based on the Chaetomium thermophilum Vps16·Vps33·Nyv1 (PDB:5BV0) and the Vps16·Vps33·Vam3 (PDB: 5BUZ) structures. Layers (−6 to +6) in the SNARE motif are assigned according to Fasshauer et al. (1998). B, Predicted Munc18-1·VAMP2 interface. Munc18-1 amino acids that should contribute to VAMP2 binding are shown in purple. T346 (salmon) should not interact with VAMP2. C, Munc18-1 wt and Munc18-1 point mutants show similar melting temperatures. D, Site-specific Munc18-1·VAMP2 crosslink products were analyzed by Western blotting using an anti-VAMP antibody. E, Incubation scheme of t-SNARE GUV based liposome fusion assay. F, Representative kinetic traces of the lipid mixing assay. VAMP2/Syt1 SUVs labeled with Atto488-DPPE/Atto550-DPPE were incubated with syntaxin-1/SNAP-25 GUVs labeled with Atto647-DPPE in the absence or presence of the indicated Munc18-1 (M18) constructs. Lipid mixing was monitored at 37°C for 10 min by an increase of Atto488 fluorescence. G, Quantification of all tested Munc18-1 Bpa mutants except A297Bpa and M355Bpa shows lipid mixing stimulation comparable to Munc18-1 wt. Bar graph represents the initial slope from 10 to 40 s (% fluorescence/s). Error bars: SD (n = 3) of technical replicates.
Figure 2.
Figure 2.
Munc18-1·VAMP2 binding depends on Q301 in helix 11 of Munc18-1. A, Munc18-1 wt and point mutants show the same retention volume in gel filtration experiments. The samples were analyzed on a Superdex 75 Increase 10/300 column (GE Healthcare). B, Schematic representation of the SUV/GUV co-sedimentation assay. C, Munc18-1 Q301R and Q301D show increased and decreased VAMP2 binding, respectively. VAMP2 SUVs labeled with Atto488-DPPE/Atto550-DPPE were incubated with syntaxin-1 GUVs labeled with Atto647-DPPE in the absence or presence of Munc18-1 wt or the indicated single amino acid substitutions. The liposomes were isolated, and their fluorescence was quantified. The normalized amount of co-sedimented SUVs is plotted as % of input. D, GUV recovery is not affected by Munc18-1 constructs. Recovery is plotted as % of input. E, Munc18-1 mutants are not impaired in syntaxin-1 binding. Munc18-1 binding to syntaxin-1 GUVs was determined by analyzing the protein amounts in the sedimented proteo-liposomes by SDS-PAGE. The ratio of surface-exposed syntaxin-1 bound to Munc18-1 wt was set to 100%. Error bars: SD (n = 3) of technical replicates. An ordinary one-way ANOVA Dunnett’s test was performed; ****p < 0.0001, ***p < 0.001, n.s., not significant.
Figure 3.
Figure 3.
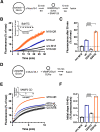
Munc18-1 Q301D and Q301R decrease and increase membrane fusion, respectively. A, Incubation scheme of the syntaxin-1 GUV based lipid mixing assay. B, Munc18-1 Q301R enhances while Q301D inhibits lipid mixing. Lipid mixing kinetics were recorded at 37°C for 30 min as the increase in Atto488 fluorescence. Inset, Representative lipid mixing kinetic showing the negative control containing syntaxin-1 GUVs pretreated with BoNTC, cleaving/inactivating syntaxin-1. Negative controls were subtracted from the fusion reactions. C, Quantification of B. Bar graph represents normalized fluorescence at 30 min (% of max). D, Incubation scheme of the t-SNARE GUV based lipid mixing assay. E, Lipid mixing kinetics were recorded at 37°C for 10 min as the increase in Atto488 fluorescence. Inset, Representative negative control containing an excess of the cytoplasmic domain of VAMP2 (VAMP2 CD), blocking membrane fusion. F, Quantification of E. Bar graph represents the initial slope from 10 to 40 s (% fluorescence/s). Error bars: SD (n = 3) of technical replicates. An ordinary one-way ANOVA Dunnett’s test was performed; ****p < 0.0001.
Figure 4.
Figure 4.
Munc18-1 Q301D and Q301R effects on lipid mixing persist in the presence of Munc13-1-C1C2BMUN. A, Domain scheme of Munc13-1-C1C2BMUN showing protein-protein and protein-lipid interactions and mutations (N1128A/F1131A or D1358K) affecting syntaxin-1 and VAMP2, respectively. B, Incubation scheme of the syntaxin-1 GUV-based lipid mixing assay. GUVs used for measurements with Munc13-1 contained 1 mol% DAG in addition to the standard lipid mixture. Lipid mixing kinetics were recorded at 37°C for 30 min. Measurements were started in the presence of 0.1 mm EGTA. After 5 min, calcium was added to obtain 100 μm free Ca2+ in solution. C, Lipid mixing reactions in absence of C1C2BMUN show no calcium response. D, Munc18-1 Q301D (M18-QD) and Q301R (M18-QR) decrease and stimulate Ca2+-dependent and C1C2BMUN-dependent lipid mixing, respectively. Please note that the C1C2BMUN-dependent stimulation requires Munc18-1 and Ca2+. E, The VAMP2-binding deficient D1358K mutation of Munc13-1 results in a moderate reduction of the overall fusion efficiency. F, Abolished syntaxin-1 interaction of the C1C2BMUN N1128A/F1131A mutant was accompanied by strong inhibition of lipid mixing. G, Quantification of C–F. Bar graphs represent normalized fluorescence after 30 min. Error bars: SD (n = 3) of technical replicates. Ordinary one-way ANOVA with Tukey’s test was performed to determine statistical significance and p values; *p < 0.05, ***p < 0.001, n.s., not significant.
Figure 5.
Figure 5.
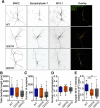
Effects of the Munc18-1 variants on neuronal morphology and synaptic Munc18-1 levels. A, Example confocal images of the staining of autaptic neurons from the three conditions, showing the intensity of MAP2, Synaptophysin-1, and M18-1 stainings separately (inverted greyscale images, first three columns) and overlaid (fourth column). Green, MAP2; cyan, Synaptophysin-1; red, M18-1. Scale bar = 50 μm. B, Median [Q1–Q3] total dendritic length of neurons (M18WT: 1915 [1126–2686] μm, n = 36; M18Q301R: 1384 [886.5–2704] μm, n = 27; M18Q301D: 1310 [878.3–2042] μm, n = 31; Kruskal–Wallis test, p = 0.0922). C, Median [Q1–Q3] number of synapses (M18WT: 401 [246.5–740.8], n = 36; M18Q301R: 273 [189–763], n = 27; M18Q301D: 305 [223–537], n = 31; Kruskal–Wallis test, p = 0.3762). D, Median [Q1–Q3] number of synapses per dendritic length (M18WT: 0.24 [0.18–0.28] μm–1, n = 36; M18Q301R: 0.23 [0.19–0.30] μm–1, n = 27; M18Q301D: 0.24 [0.19–0.27] μm–1, n = 31; Kruskal–Wallis test, p = 0.7669). E, The relative synaptic M18-1 intensity was calculated by dividing the average M18-1 intensity in synaptophysin puncta per neuron by the mean value of the M18WT condition of the corresponding culture. Median [Q1–Q3] relative synaptic M18-1 intensity (M18WT: 0.96 [0.78–1.32], n = 36; M18Q301R: 0.58 [0.42–0.91], n = 27; M18Q301D: 0.58 [0.35–0.97], n = 31; Kruskal–Wallis test, ***p = 0.0003, Dunn’s multiple comparison test, M18WT vs M18Q301R: **p = 0.0019, M18WT vs M18Q301D: **p = 0.0014, M18Q301R vs M18Q301D: p > 0.9999).
Figure 6.
Figure 6.
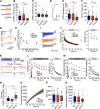
Munc18-1 Q301D drastically impairs synaptic transmission while Q301R supports normal transmission. A, Typical examples of passive recordings showing mEPSCs. B, mEPSC frequency (M18WT: 4.40 Hz, n = 58; M18Q301R: 2.29 Hz, n = 49; M18Q301D: 0.517 Hz, n = 46; p < 0.0001, M18WT vs M18Q301R: p >0.05, M18WT vs M18Q301D: p < 0.001, M18Q301R vs M18Q301D: p <0.001). C, mEPSC amplitude (M18WT: 13.61 pA, n = 58; M18Q301R: 13.74 pA, n = 47; M18Q301D: 13.50 pA, n = 43; p =0.50, M18WT vs M18Q301R: p >0.05, M18WT vs M18Q301D: p > 0.05, M18Q301R vs M18Q301D: p > 0.05). D, Example traces of evoked EPSCs. E, Evoked EPSC amplitude (M18WT: 4.78 nA, n = 45; M18Q301R: 3.57 nA, n = 44; M18Q301D: 1.60 nA, n = 48; p =0.0001, M18WT vs M18Q301R: p >0.05, M18WT vs M18Q301D: p < 0.001, M18Q301R vs M18Q301D: p <0.05). F, Evoked EPSC charge (M18WT: 71.91 pC, n = 45; M18Q301R: 40.92 pC, n = 44; M18Q301D: 15.38 pC, n = 48; p <0.0001, M18WT vs M18Q301R: p >0.05, M18WT vs M18Q301D: p < 0.001, M18Q301R vs M18Q301D: p <0.05). G, Typical examples of paired pulse traces. Traces from different intervals are superimposed (20, 50, 100, 200, and 500 ms). H, Quantification of the paired pulse ratio for different intervals (M18WT: n = 37; M18Q301R: n = 29; M18Q301D: n = 23). I, Typical examples of 10-Hz stimulation train. J, Quantification of EPSC charge during 10-Hz train stimulation. Followed by a single stimulation to monitor post-stimulation response (M18WT: n = 34; M18Q301R: n = 29; M18Q301D: n = 21). Right, Insert of the first four pulses. K, Typical examples of 40-Hz stimulation train. Right, Insert of the 40-Hz train stimulation responses. L, Quantification of EPSC amplitude during 40-Hz train stimulation. Followed by a 0.2-Hz train stimulation to monitor post-stimulation recovery (M18WT: n = 31; M18Q301R: n = 25; or M18Q301D: n = 19). Right, Insert of the first 300 ms. M, Normalized EPSC amplitude quantification during 40-Hz train stimulation and 0.2 Hz. The 0.2-Hz recovery train EPSC amplitude is normalized to the first EPSC of the 40-Hz train stimulation (M18WT: n = 31; M18Q301R: n = 25; or M18Q301D: n = 19). Right, Insert of the first 300 ms. N, Recovery of EPSC amplitude. First pulse of the 0.2-Hz train (M18WT: 1.11, M18Q301R: 0.95, M18Q301D: 1.631, p <0.0001; M18WT vs M18Q301R: p >0.05, M18WT vs M18Q301D: p < 0.01, M18Q301R vs M18Q301D: p <0.001). O, Cumulative EPSC charge during 40-Hz train stimulation. P, Quantification of the RRP based on back-extrapolation to the y-axis of a linear fit through the last 20 points of the cumulative EPSC charge (M18WT: 951.4 pC, M18Q301R: 1066 pC, M18Q301D: 942.1 pC, p =0.97). Q, Quantification of total cumulative charge transferred during 40-Hz train stimulation (M18WT: 3442 pC, M18Q301R: 2711 pC, M18Q301D: 3133 pC, p =0.87). Medians are reported. Statistically tested using the Kruskal–Wallis test and Dunn’s multiple comparison test. *p <0.05, **p <0.01, ***p <0.001.

Similar articles

Cited by

References

    1. Baker RW, Jeffrey PD, Zick M, Phillips BP, Wickner WT, Hughson FM (2015) A direct role for the Sec1/Munc18-family protein Vps33 as a template for SNARE assembly. Science 349:1111–1114. 10.1126/science.aac7906 - DOI - PMC - PubMed
    1. Bracher A, Kadlec J, Betz H, Weissenhorn W (2002) X-ray structure of a neuronal complexin-SNARE complex from squid. J Biol Chem 277:26517–26523. 10.1074/jbc.M203460200 - DOI - PubMed
    1. Brunger AT, Choi UB, Lai Y, Leitz J, White KI, Zhou Q (2019) The pre-synaptic fusion machinery. Curr Opin Struct Biol 54:179–188. 10.1016/j.sbi.2019.03.007 - DOI - PMC - PubMed
    1. Burkhardt P, Hattendorf DA, Weis WI, Fasshauer D (2008) Munc18a controls SNARE assembly through its interaction with the syntaxin N-peptide. EMBO J 27:923–933. 10.1038/emboj.2008.37 - DOI - PMC - PubMed
    1. Carr CM, Rizo J (2010) At the junction of SNARE and SM protein function. Curr Opin Cell Biol 22:488–495. 10.1016/j.ceb.2010.04.006 - DOI - PMC - PubMed

Publication types

LinkOut - more resources