. 2020 Dec;31(12):2870-2886.
doi: 10.1681/ASN.2020050691. Epub 2020 Oct 13.

Murine Epsins Play an Integral Role in Podocyte Function

Affiliations

Murine Epsins Play an Integral Role in Podocyte Function

Ying Wang et al. J Am Soc Nephrol. 2020 Dec.

Abstract

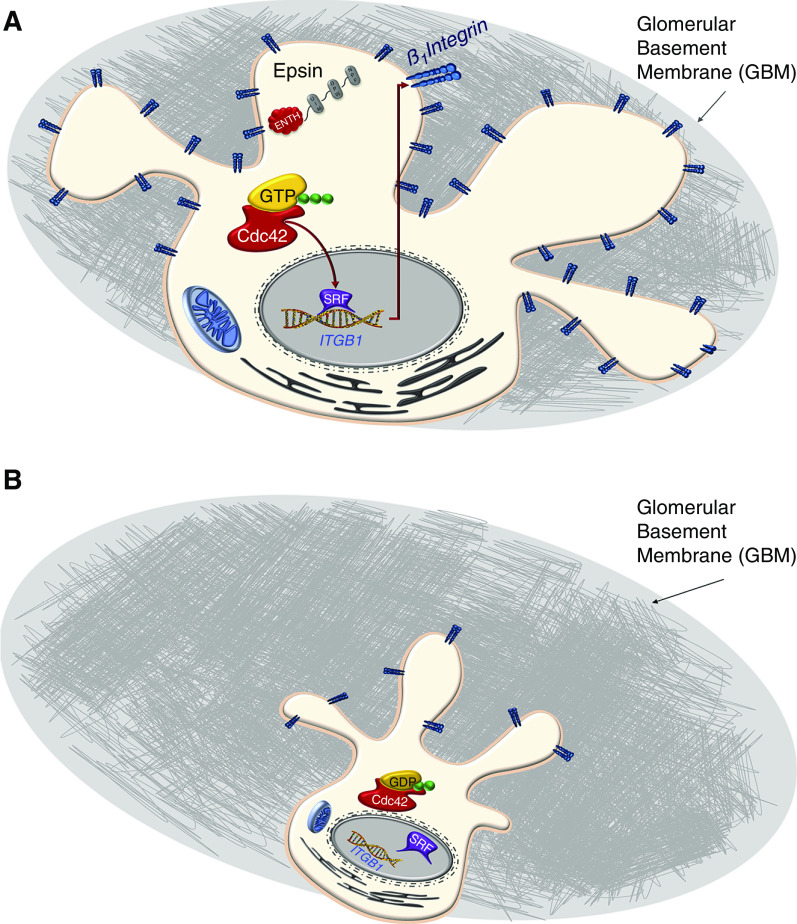
Background: Epsins, a family of evolutionarily conserved membrane proteins, play an essential role in endocytosis and signaling in podocytes.

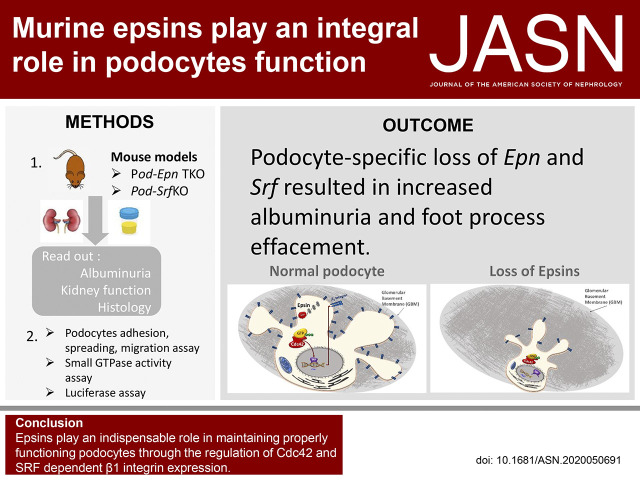
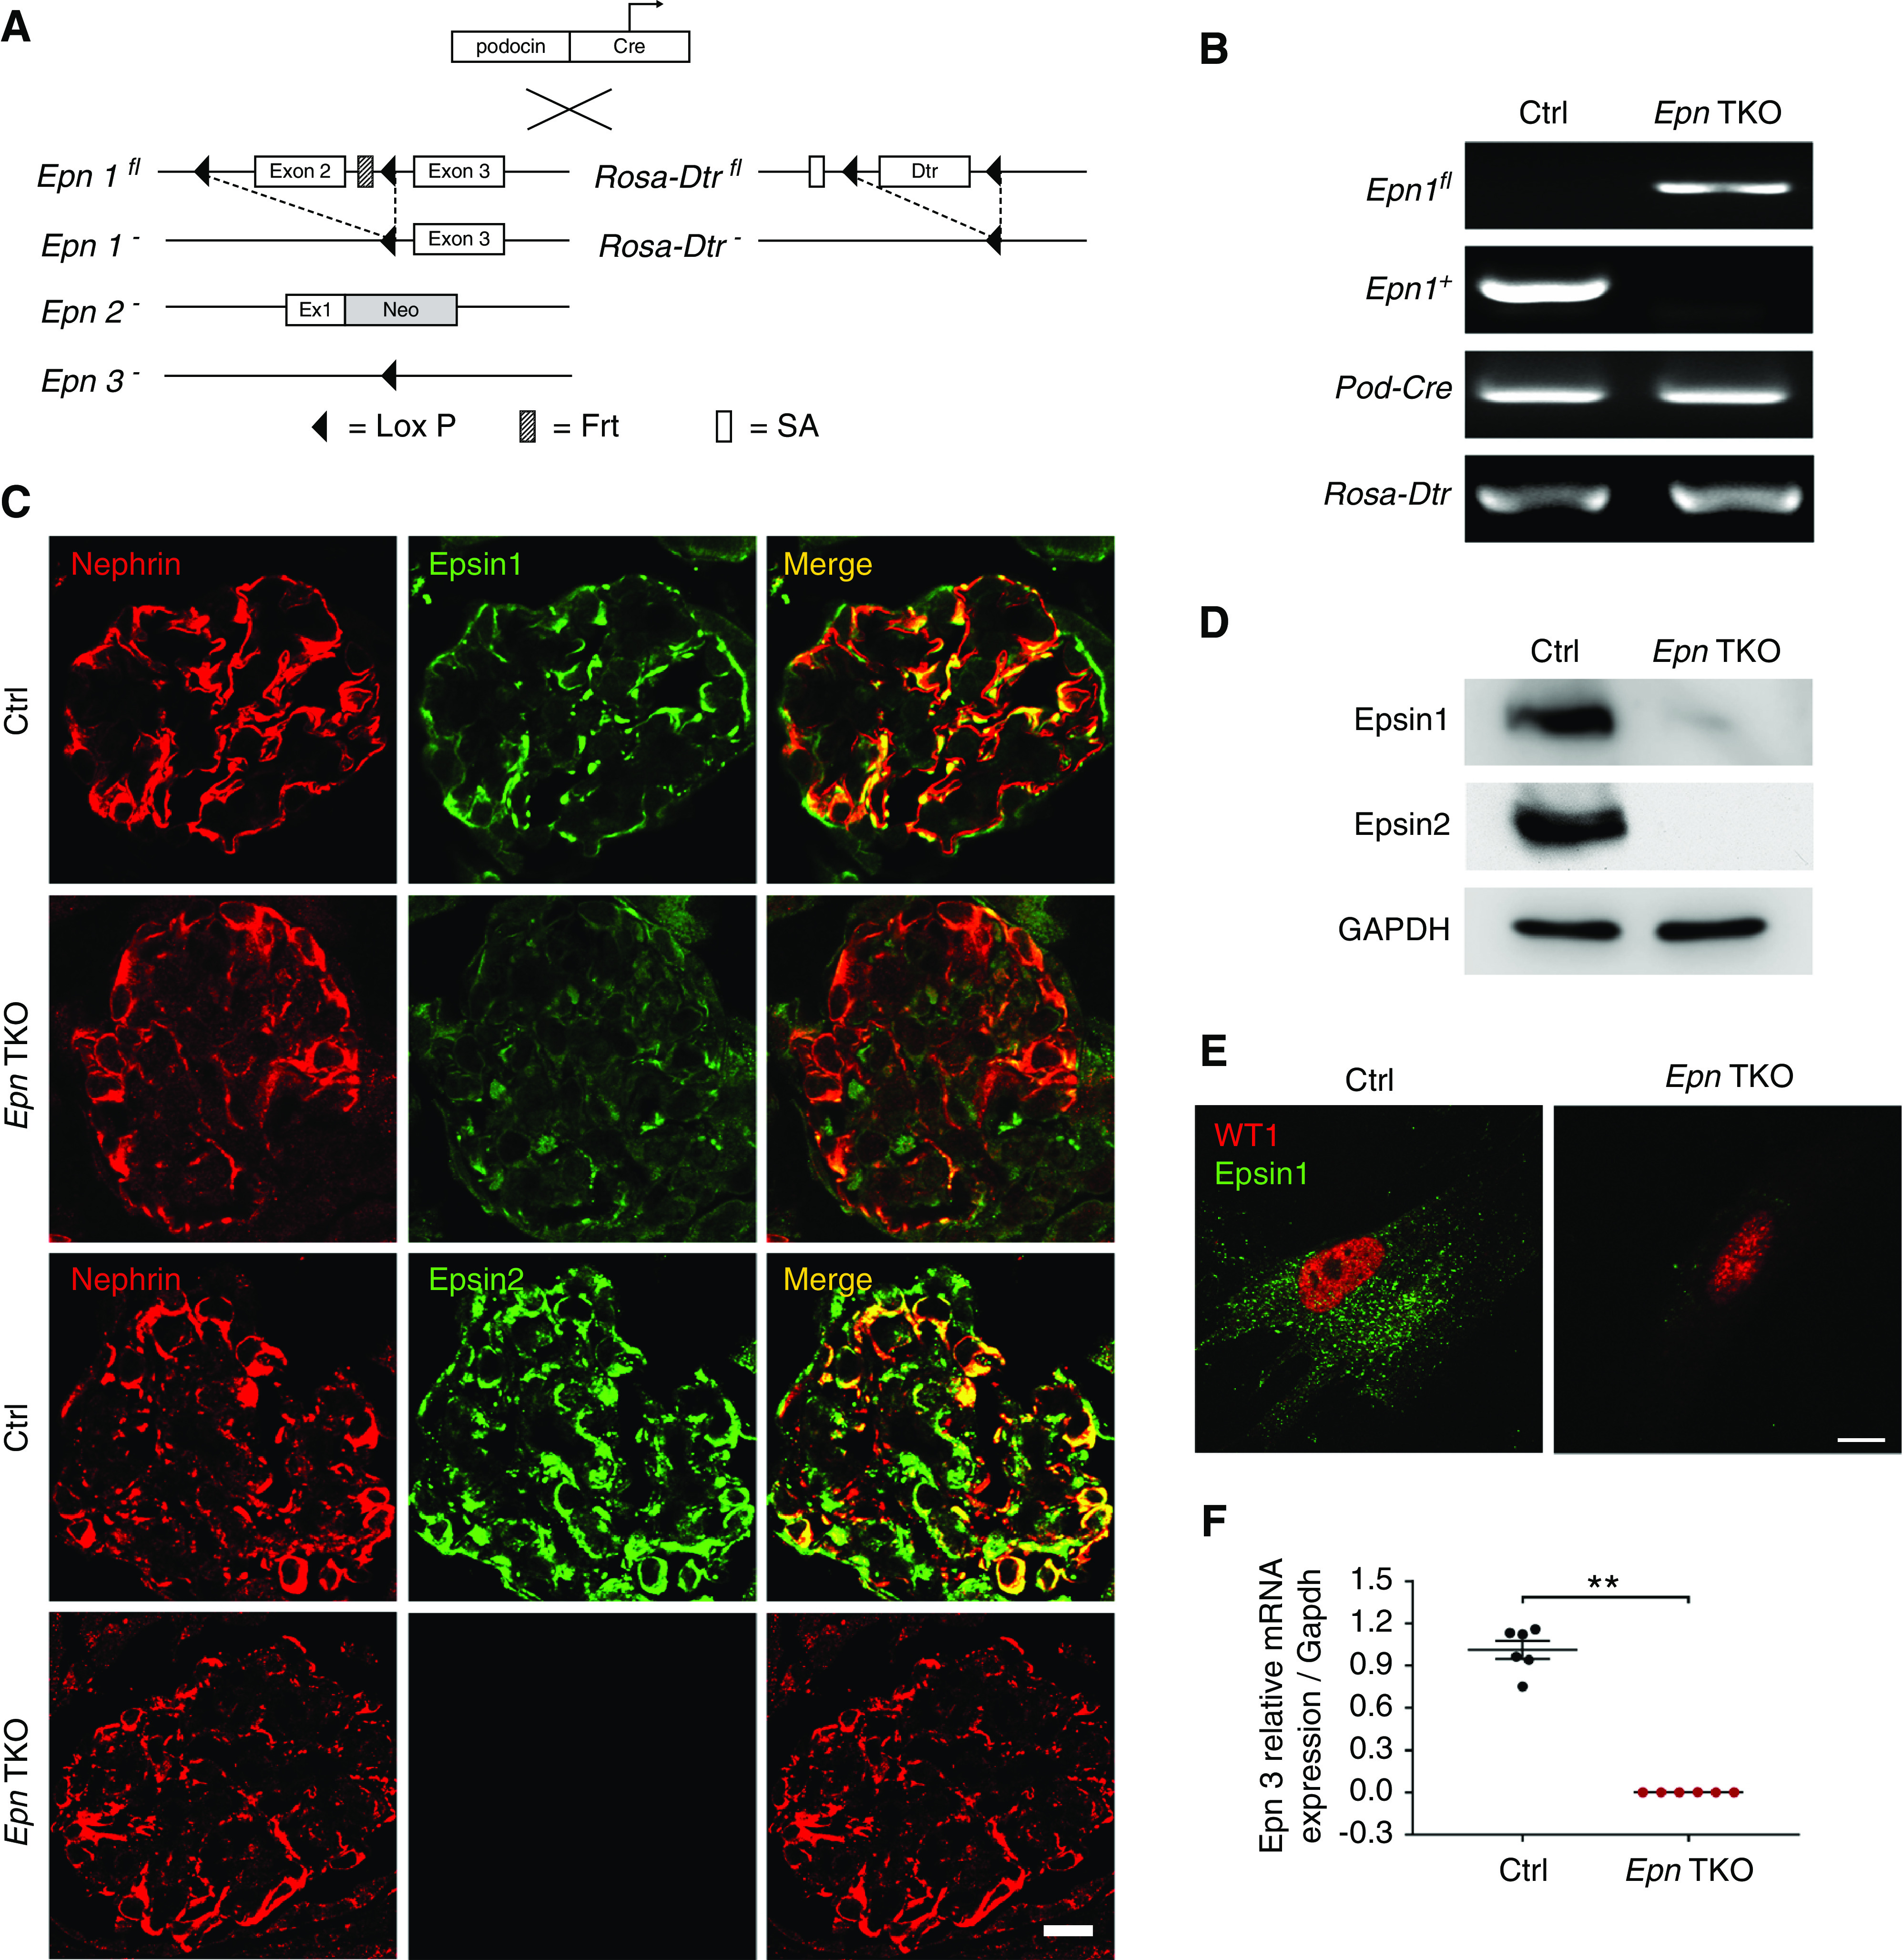
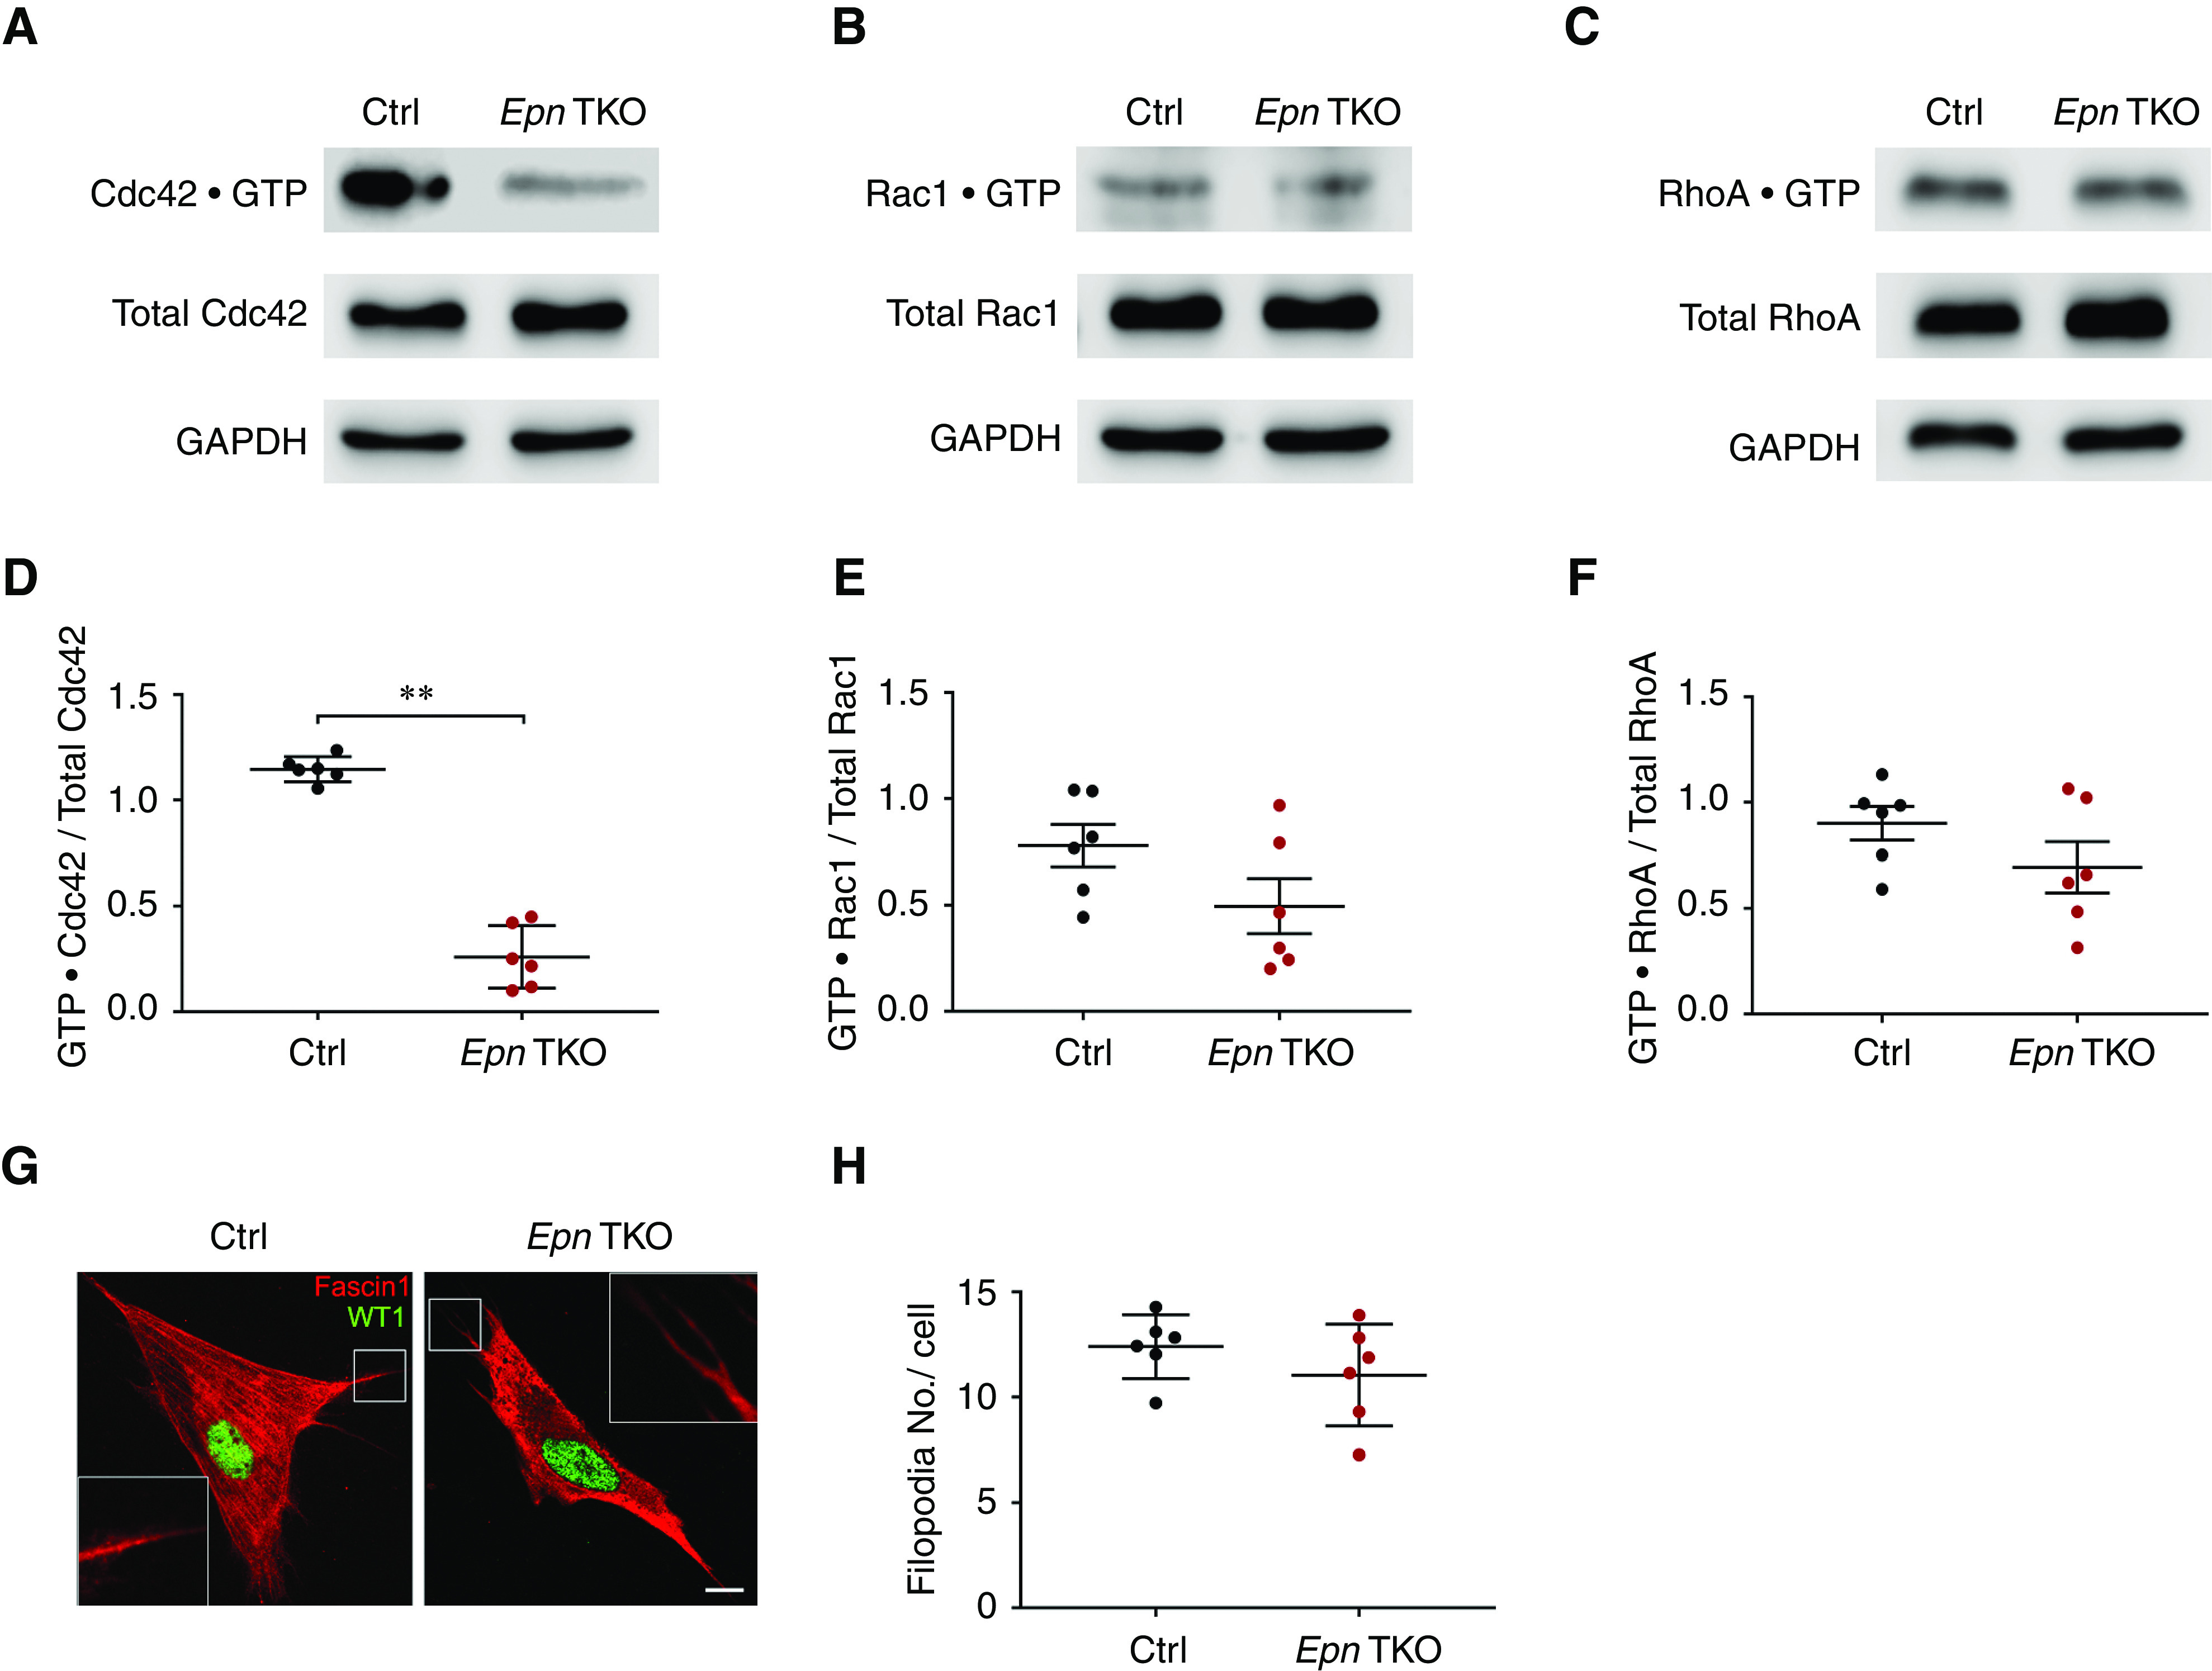
Methods: Podocyte-specific Epn1, Epn2, Epn3 triple-knockout mice were generated to examine downstream regulation of serum response factor (SRF) by cell division control protein 42 homolog (Cdc42).

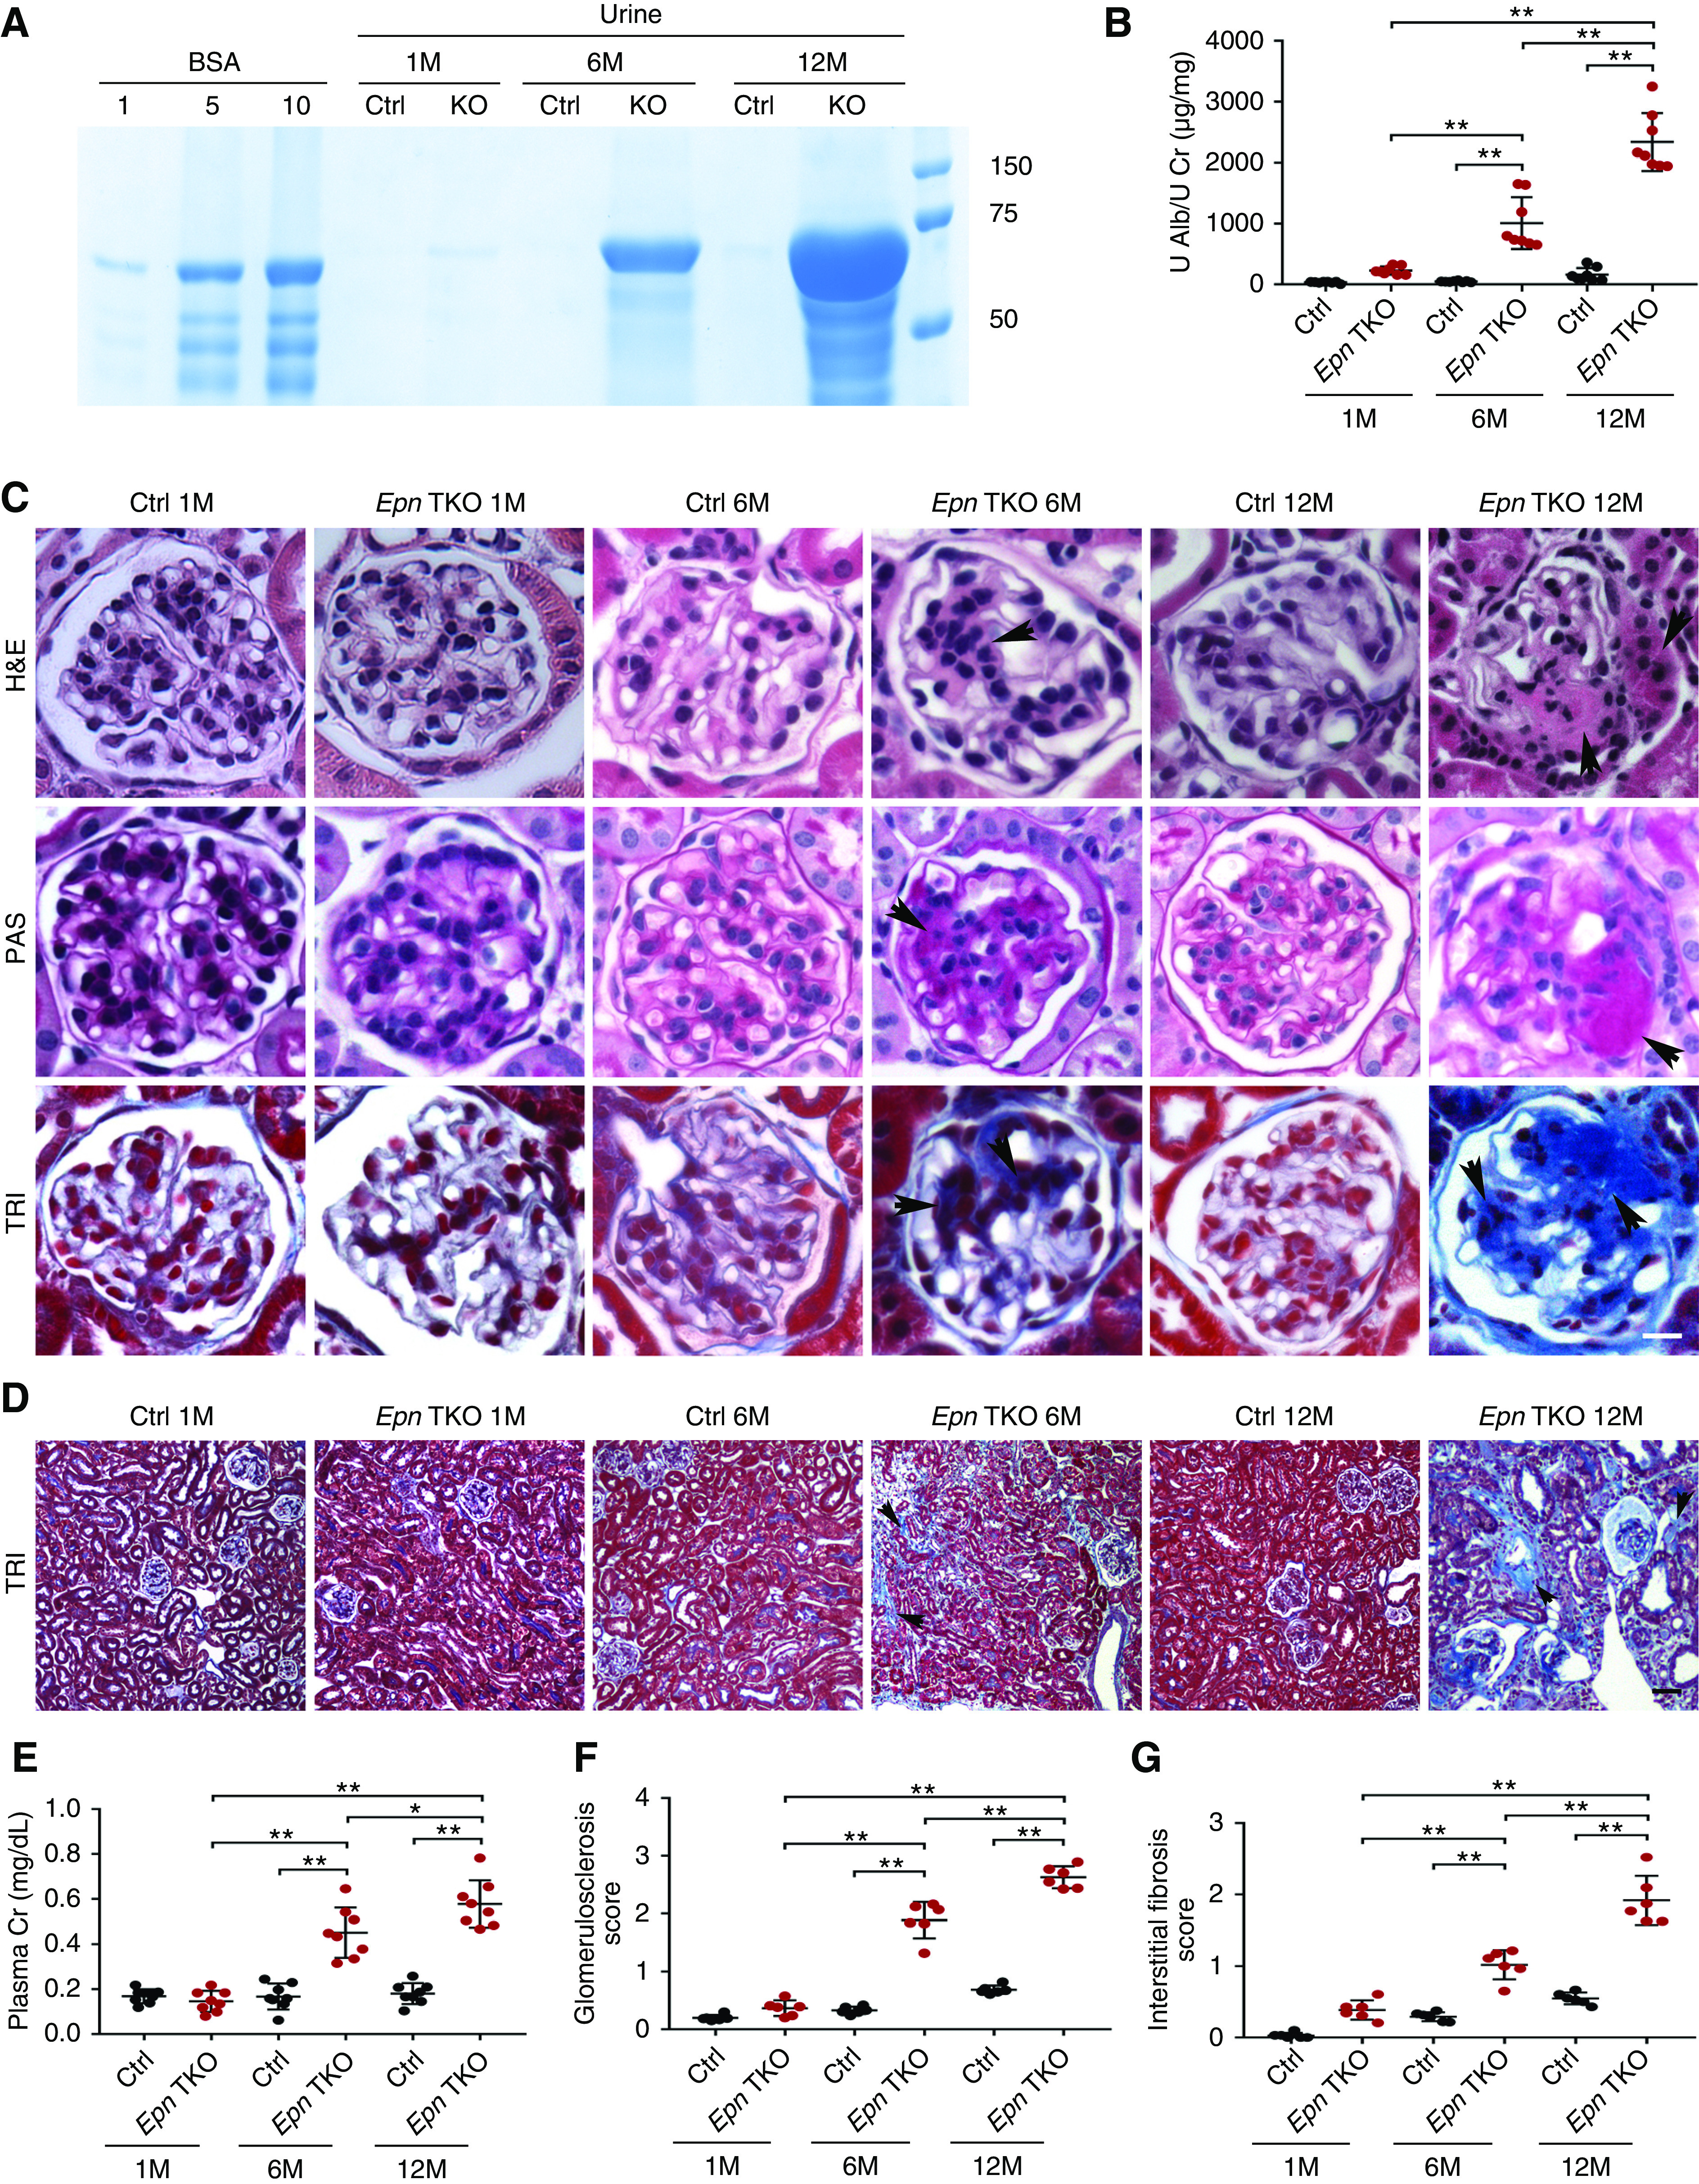
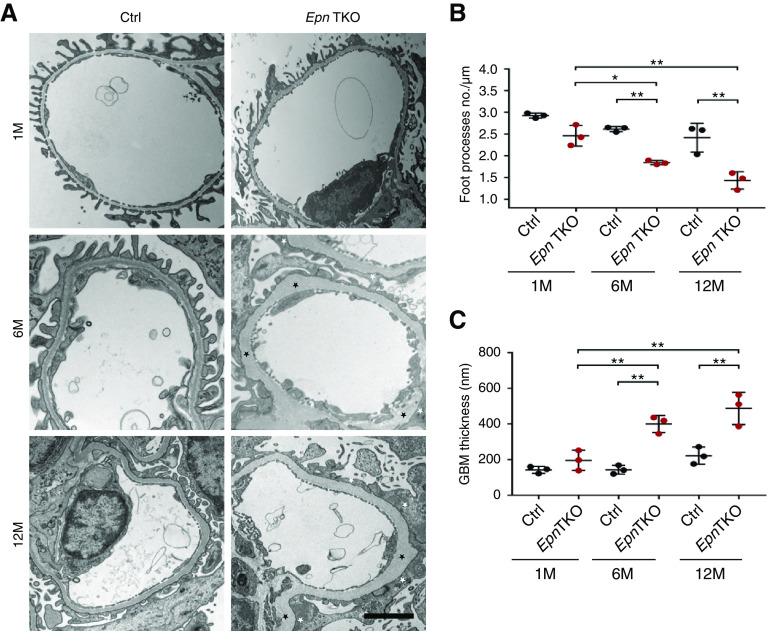
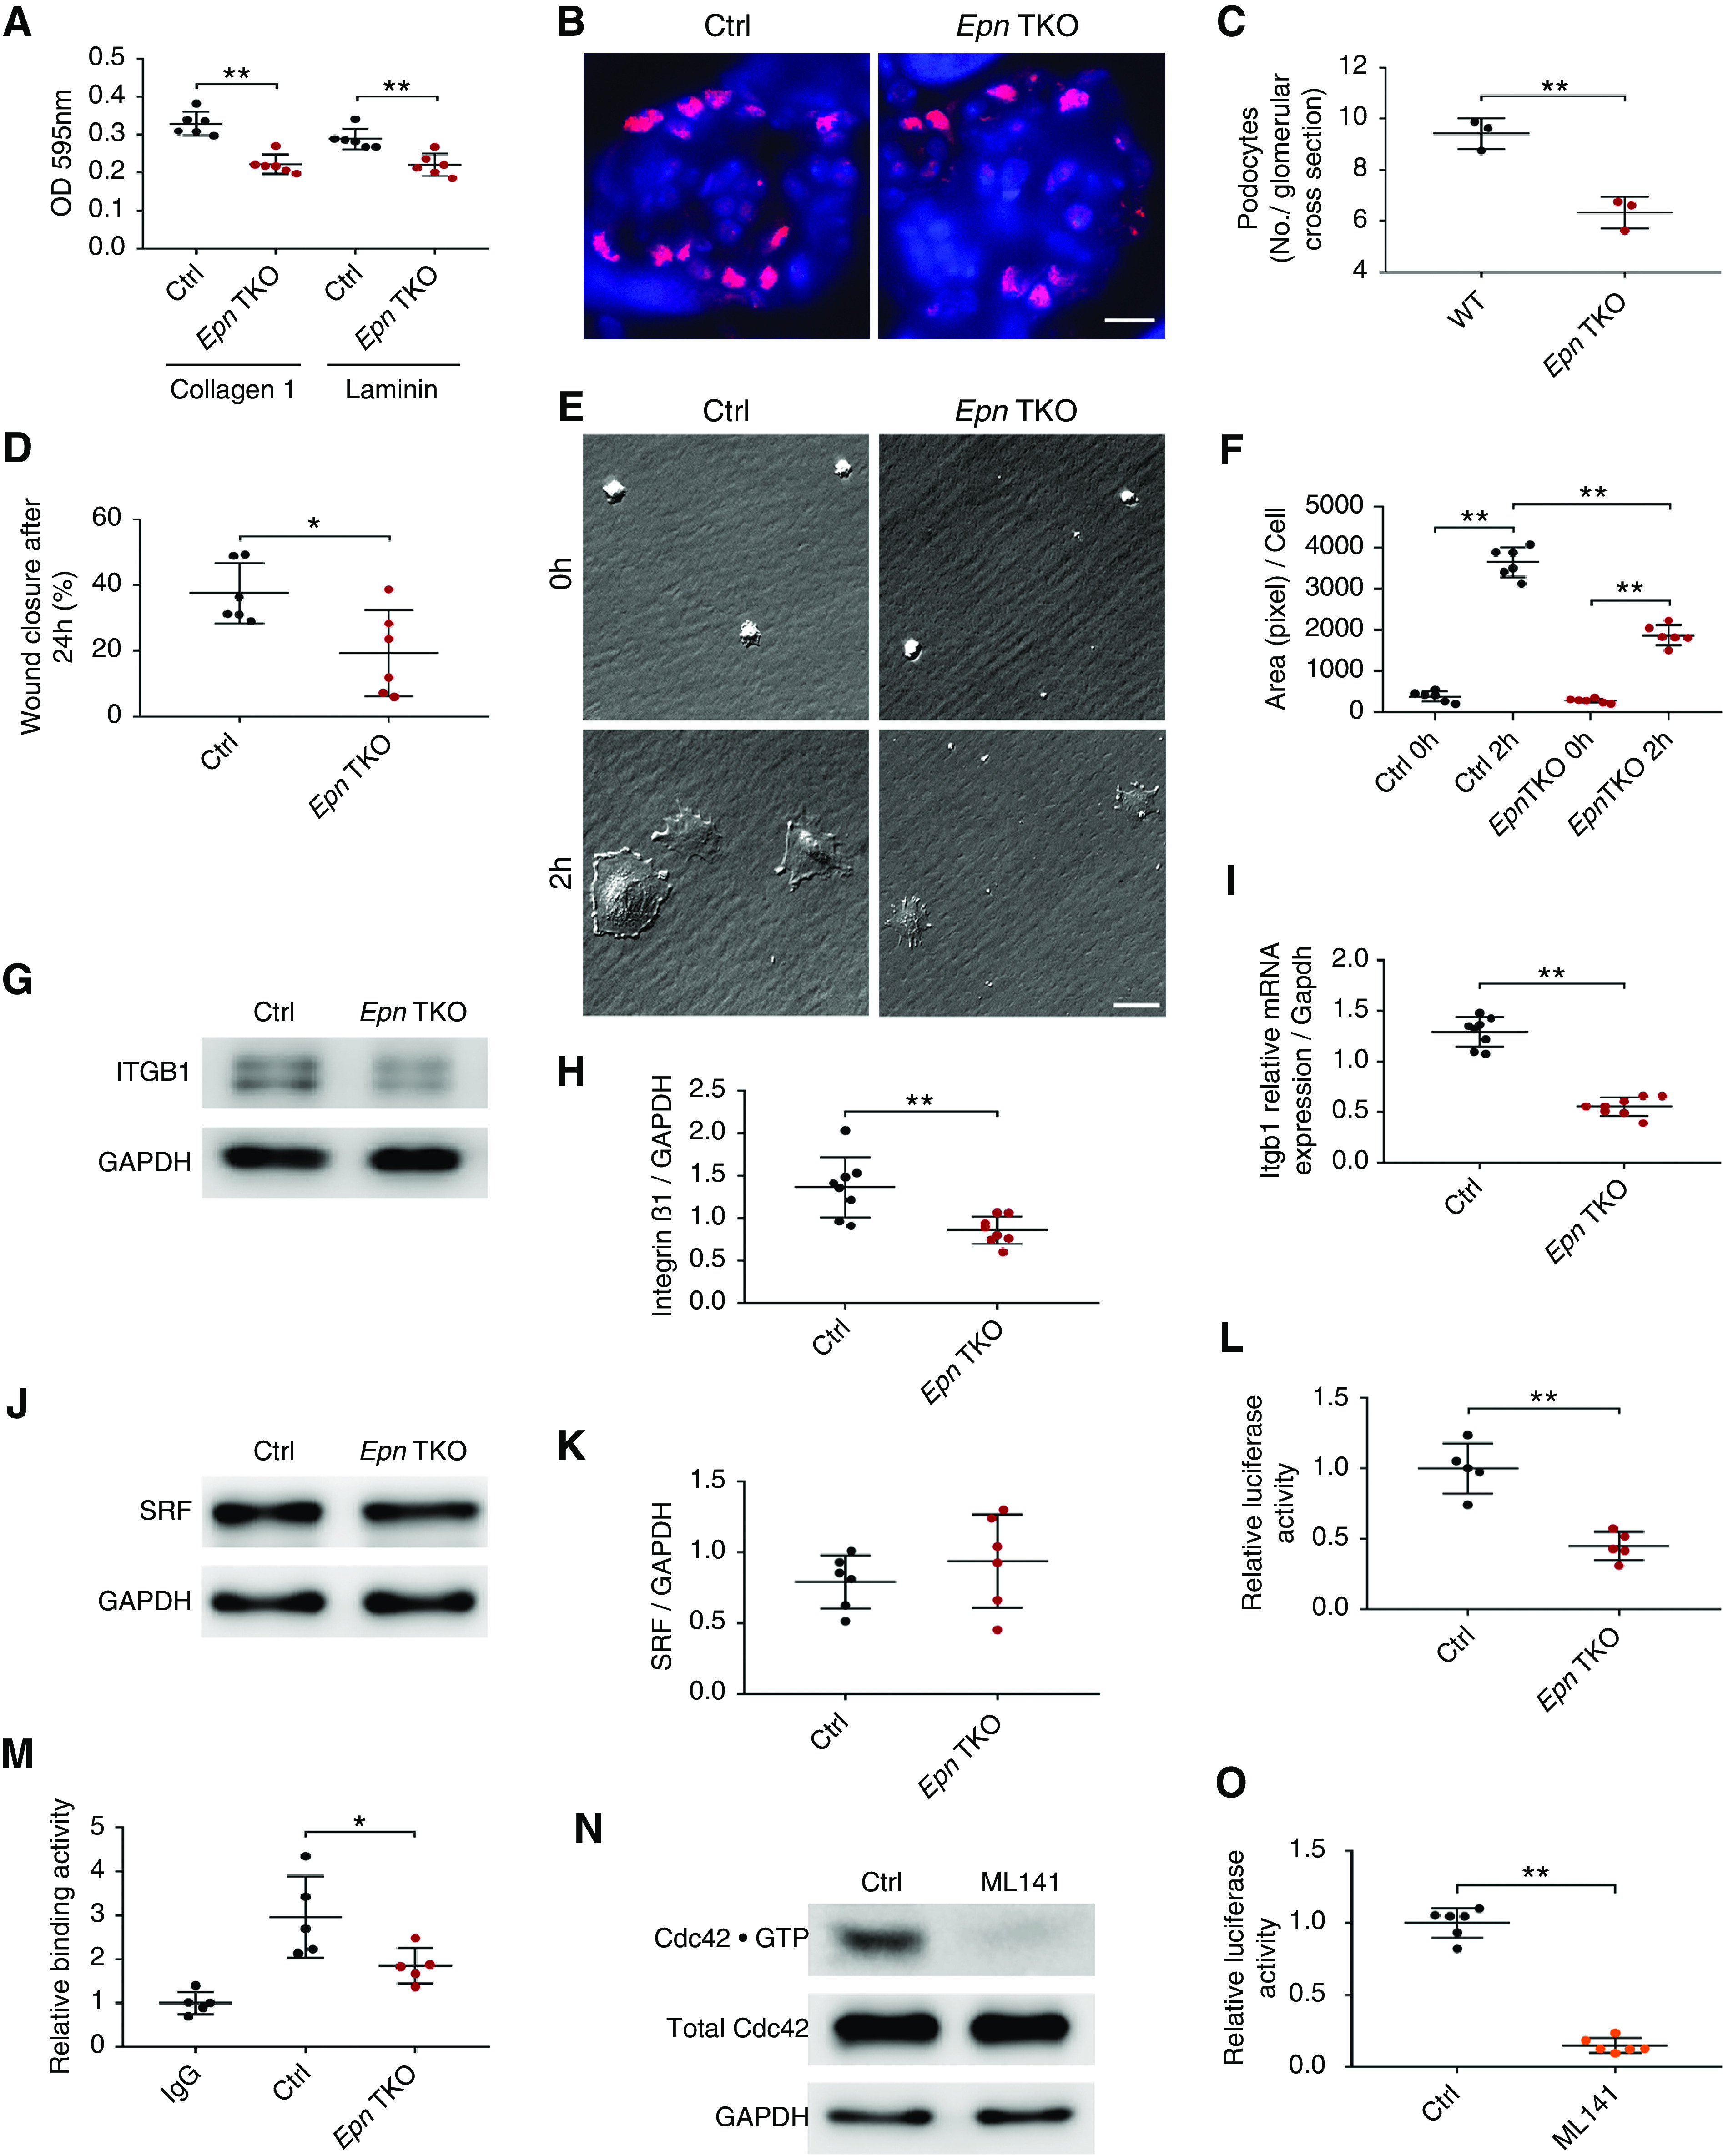
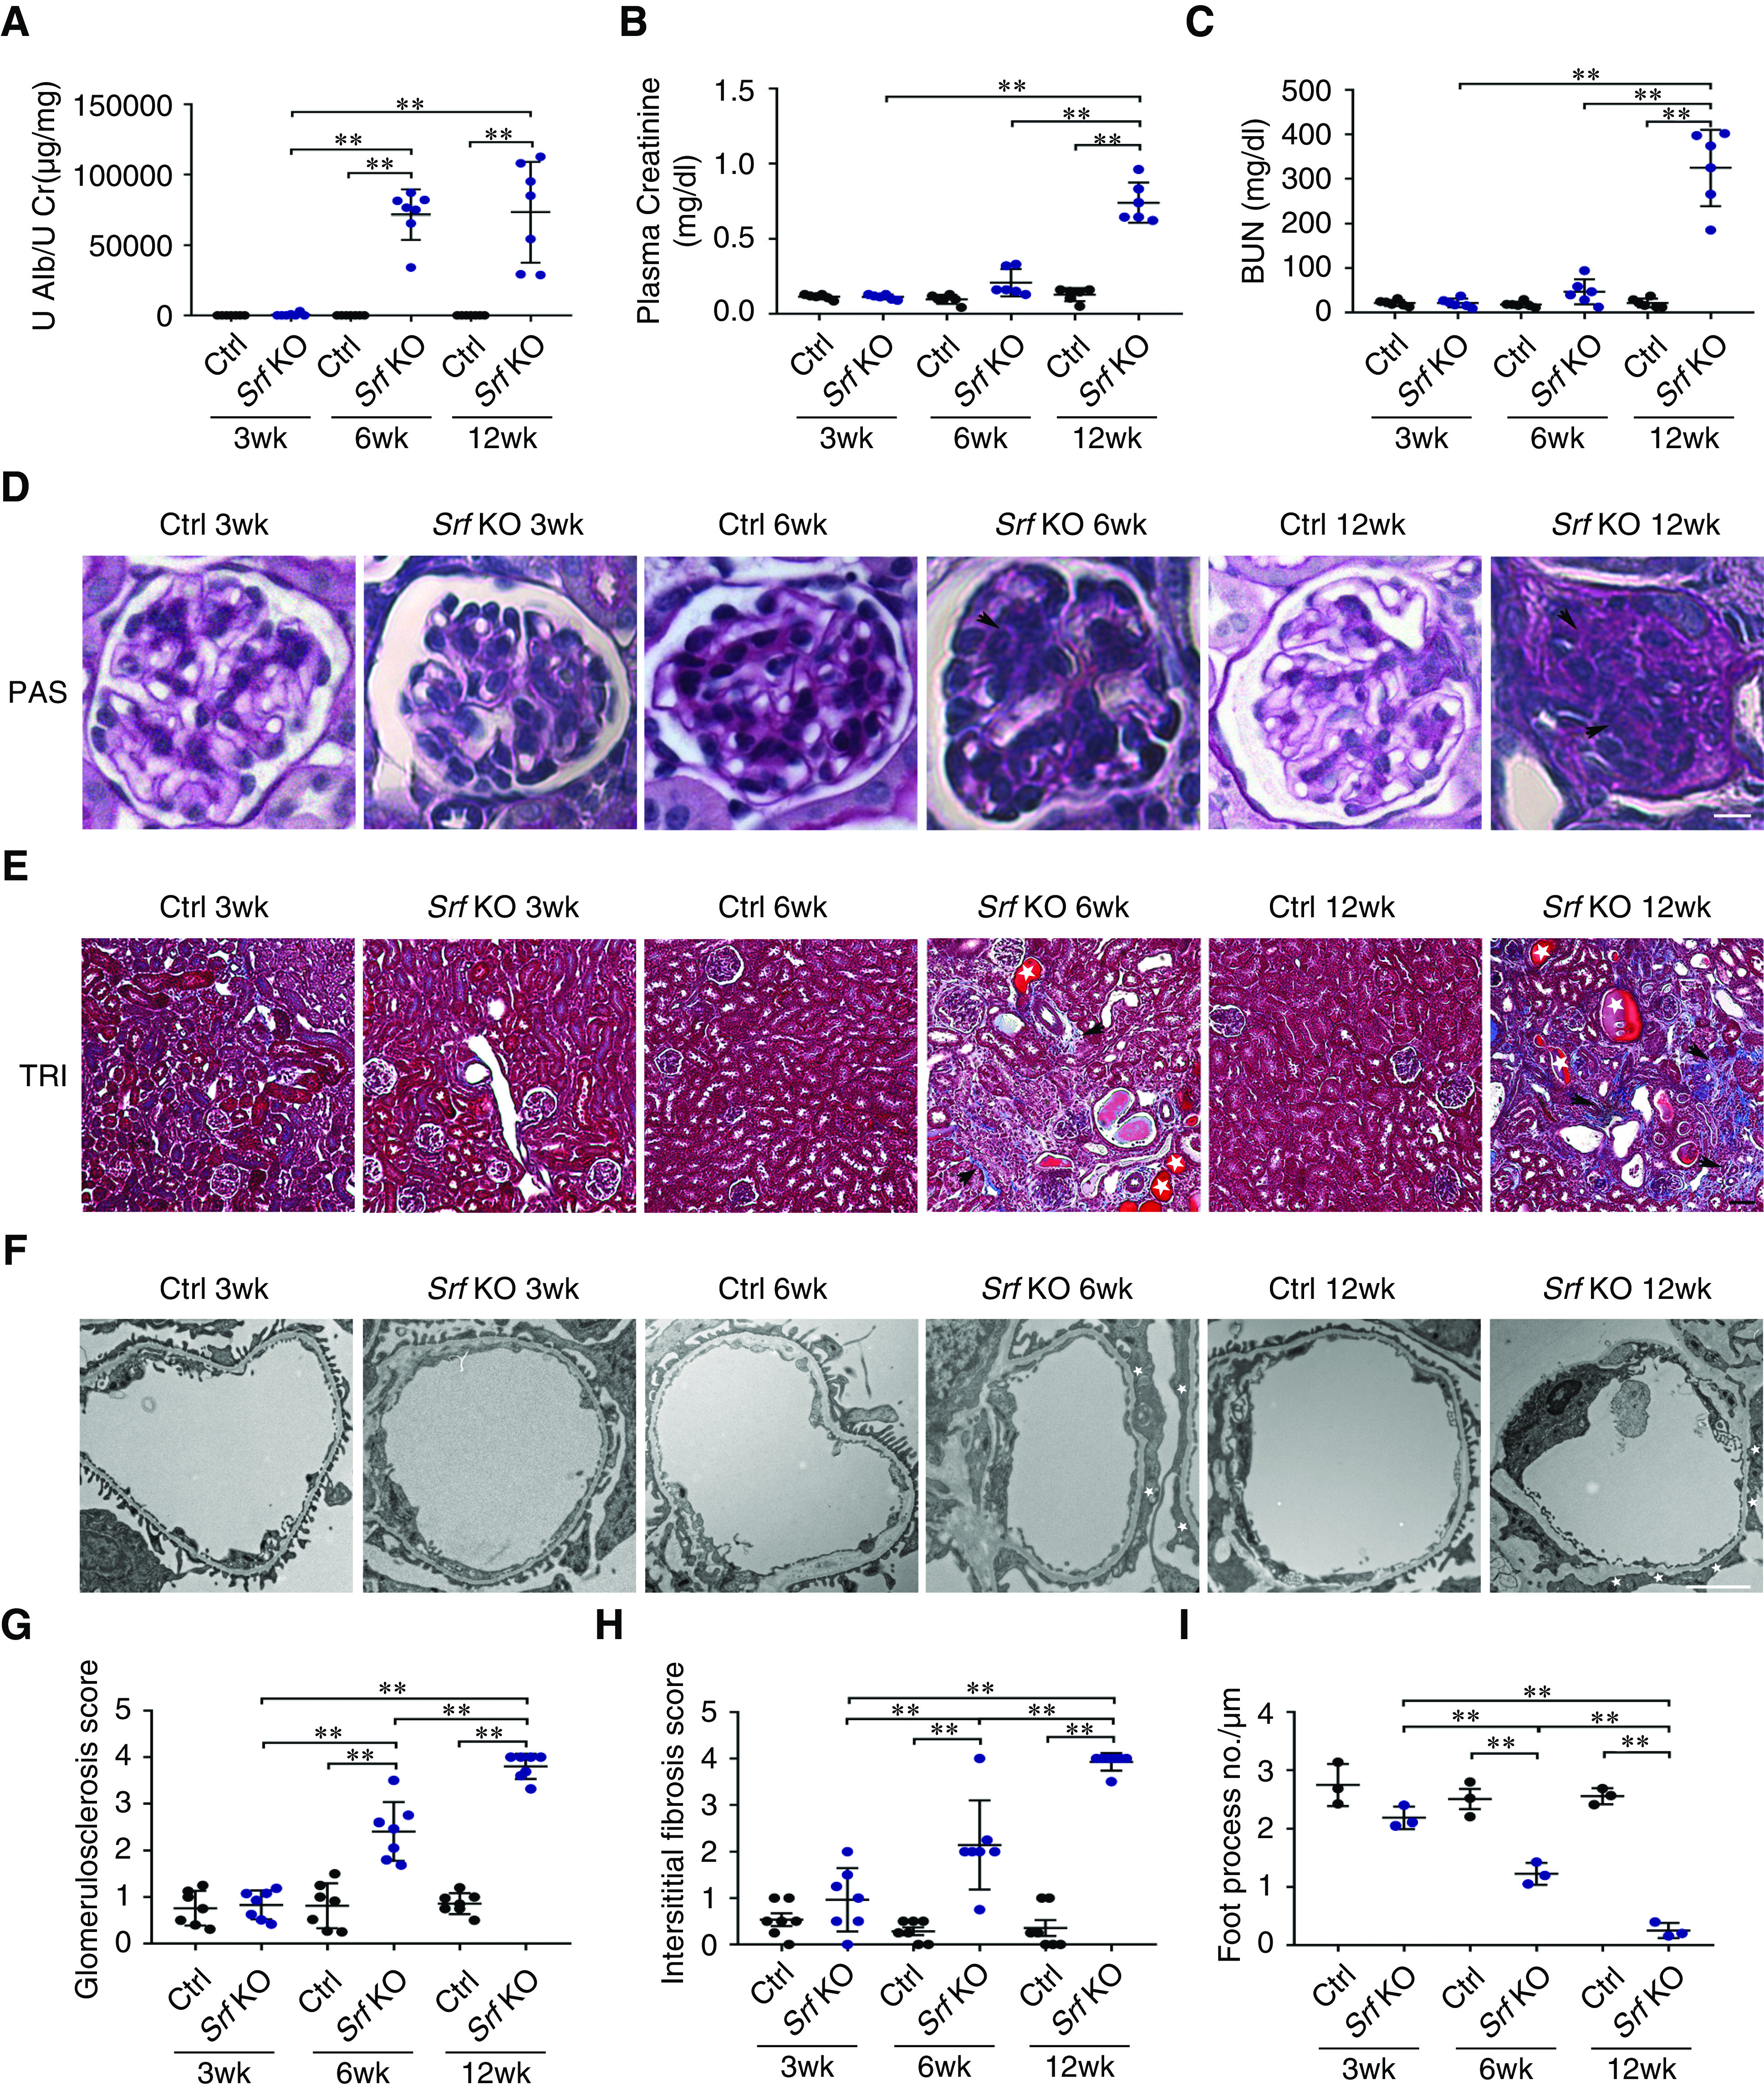
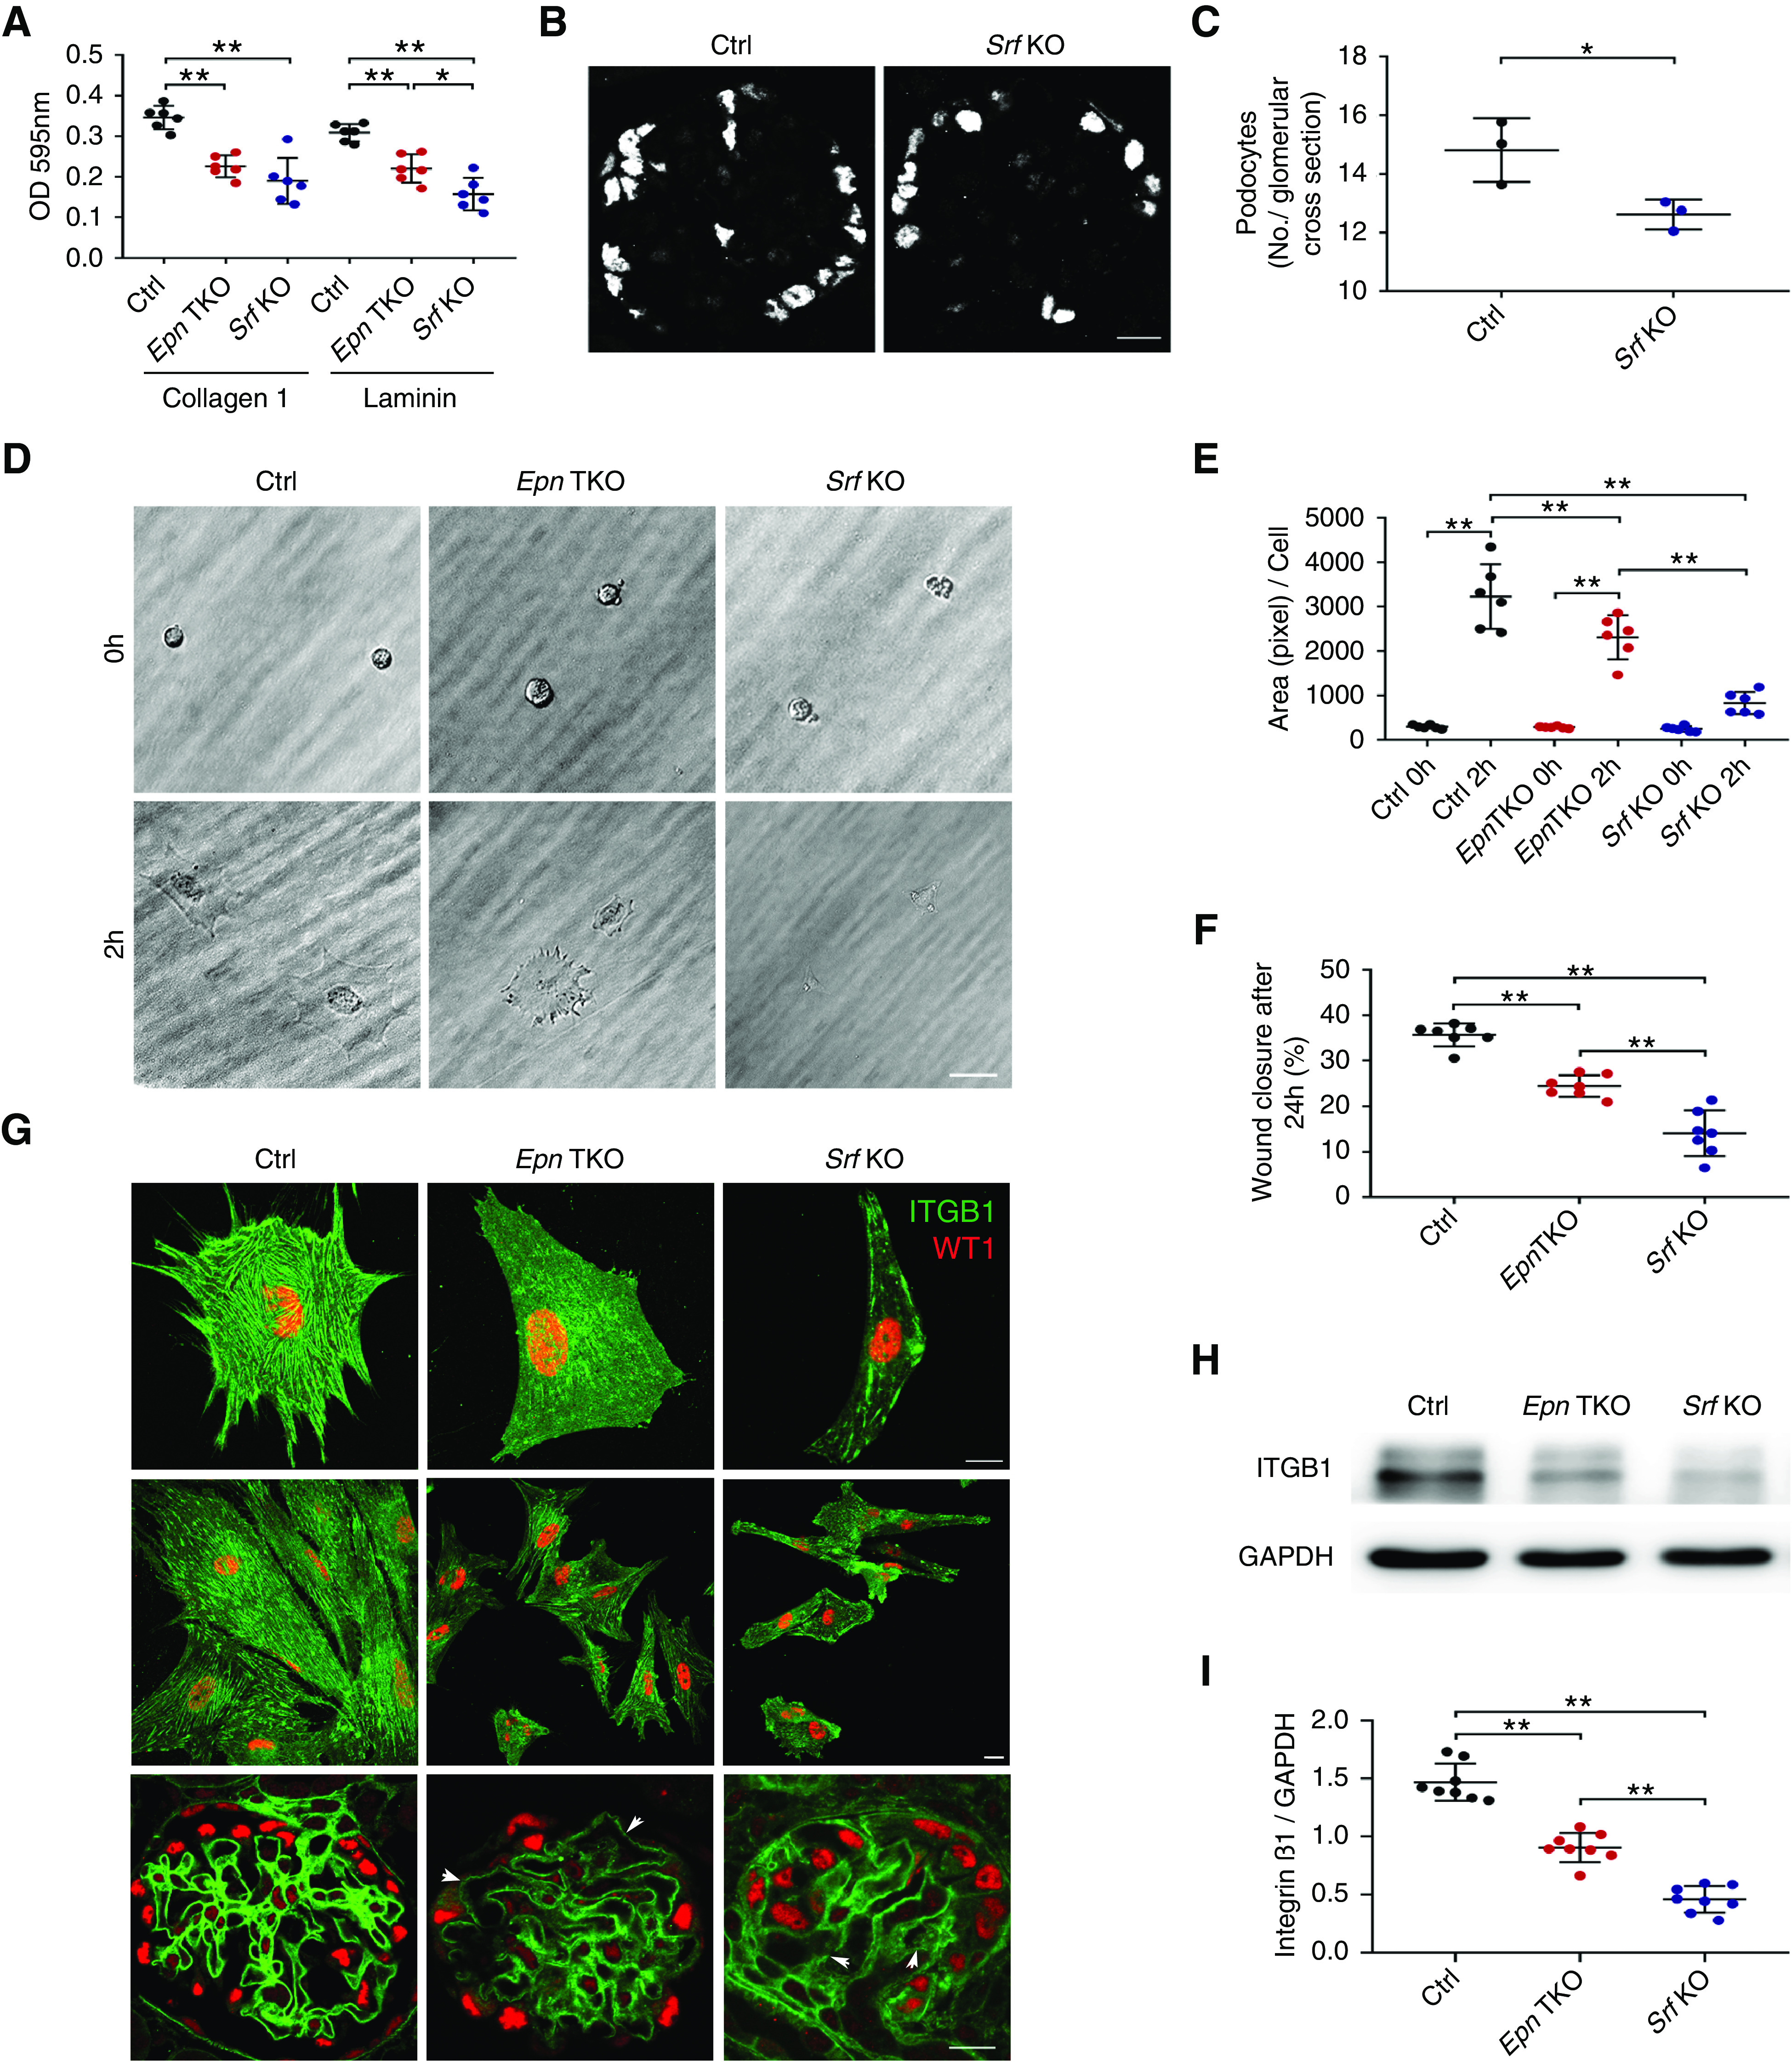
Results: Podocyte-specific loss of epsins resulted in increased albuminuria and foot process effacement. Primary podocytes isolated from these knockout mice exhibited abnormalities in cell adhesion and spreading, which may be attributed to reduced activation of cell division control protein Cdc42 and SRF, resulting in diminished β1 integrin expression. In addition, podocyte-specific loss of Srf resulted in severe albuminuria and foot process effacement, and defects in cell adhesion and spreading, along with decreased β1 integrin expression.

Conclusions: Epsins play an indispensable role in maintaining properly functioning podocytes through the regulation of Cdc42 and SRF-dependent β1 integrin expression.

Keywords: cell adhesion; glomerulosclerosis; podocyte.


Figures

None
Graphical abstract
Figure 1.
Figure 1.
Generation of Podocin-Cre, Rosa-Dtrfl/fl, Epn1fl/fl, Epn2−/−, Epn3−/− (Pod-Epn TKO) mice. (A) Schematic representation of the mating scheme in Podocin-Cre, Rosa-Dtrfl/fl, Epn1fl/fl, Epn2−/−, Epn3−/− (Pod-Epn TKO) mice. (B) Identification of Epn1flox, Epn1+, Podocin-Cre, and Rosa-Dtrfl/fl by tail genotyping. (C) Immunofluorescence images of epsin 1 (green), epsin 2 (green), and nephrin (red) in control (Ctrl) and Pod-Epn TKO mice glomeruli. (D) Immunoblot images of epsin 1, epsin 2, and glyceraldehyde-3-phosphate dehydrogenase (GAPDH) in Ctrl and Pod-Epn TKO mice primary podocytes. (E) Immunofluorescence images of epsin 1 (green) and WT1 (red) from enriched primary podocytes in control and Pod-Epn TKO mice. (F) Epn3 mRNA expression levels in control (black) and Pod-Epn TKO mice primary podocytes (red). n=6. **P<0.01. Scale bar, 10 μm.
Figure 2.
Figure 2.
Pod-Epn TKO mice demonstrate albuminuria, glomerulosclerosis, and kidney failure. (A) SDS-PAGE (Coomassie blue staining) of standard BSA (numbers indicate μg) and urine from control and Pod-Epn TKO mice at 1, 6, and 12 months of age. (B) Quantification of urine albumin normalized to creatinine in control (black) and Pod-Epn TKO mice (red) at 1, 6, and 12 months of age. n=8. **P<0.01. (C) Representative light microscopic images (hematoxylin and eosin [H&E], PAS, and TRI) of a single glomerulus from control and Pod-Epn TKO mice at 1, 6, and 12 months of age. Arrowheads show mesangial matrix accumulation in H&E and PAS stain, and glomerulosclerosis in TRI stain. Scale bar, 10 μm. (D) Representative TRI-staining images of kidney interstitium from control and Pod-Epn TKO mice at 1, 6, and 12 months of age. Arrowheads display interstitial fibrosis. Scale bar, 50 μm. (E) Plasma creatinine in control (black) and Pod-Epn TKO (red) mice at 1, 6, and 12 months of age. n=8. (F) Quantification of glomerulosclerosis in (C). n=6 different mice. (G) Quantification of interstitial fibrosis in (D). n=6 different mice. **P<0.01. Alb, albumin; Cr, urinary creatinine; Ctrl, control; U, urinary.
Figure 3.
Figure 3.
Pod-Epn TKO mice kidneys demonstrate podocyte foot process effacement and thickened GBM. (A) Transmission electron micrographs in control and Pod-Epn mice foot process at 1, 6, and 12 months of age. The white and black asterisks depict foot process effacement and thickened GBM, respectively. Scale bar, 2 μm. (B) Quantification of the number of foot processes per micrometer of GBM in control (black) and Pod-Epn TKO mice (red) at 1, 6, and 12 months of age. n=3 different mice. (C) Quantification of GBM thickness in control (black) and Pod-Epn TKO mice (red) at 1, 6, and 12 months of age. n=3 different mice. *P<0.05; **P<0.01.
Figure 4.
Figure 4.
Pod-Epn TKO podocytes demonstrate reduced Cdc42 activity. (A) Representative immunoblot images of GTP·Cdc42 and total Cdc42 in control (Ctrl) and Pod-Epn TKO primary podocytes. (B) Representative immunoblot images of GTP·Rac1 and total Rac1 in Ctrl and Pod-Epn TKO primary podocytes. (C) Representative immunoblot images of GTP·RhoA and total RhoA in Ctrl and Pod-Epn TKO primary podocytes. (D) Quantification of immunoblots in (A). n=6. **P<0.01. (E) Quantification of immunoblots in (B). n=6. (F) Quantification of immunoblots in (C). n=6. (G) Representative immunofluorescence images of fascin1 (red) and WT1 (green) in Ctrl and Pod-Epn TKO primary podocytes. Insets show the boxed regions at high magnification. Scale bar, 10 μm. (H) Quantification of the number of filopodia in (G). n=6. GAPDH, glyceraldehyde-3-phosphate dehydrogenase.
Figure 5.
Figure 5.
Pod-Epn TKO podocytes demonstrate reduced cell adhesion, migration, spreading, and integrin β1 expression. (A) Adhesion to type-1 collagen and laminin in control (Ctrl) (black) and Pod-Epn TKO (red) primary podocytes. n=6. (B) Representative immunofluorescence images of WT1 (red) and 4′,6-diamidino-2-phenylindole (blue) in Ctrl and Pod-Epn TKO mice glomeruli. Scale bar, 10 μm. (C) Quantification of the number of WT1 stained nucleus in (B). n=3 different mice. (D) Quantification of wound-healing assay in Ctrl (black) and Pod-Epn TKO (red) mice primary podocytes. n=6. (E) Representative images of cell spreading in Ctrl and Pod-Epn TKO mice primary podocytes. Scale bar, 20 μm. (F) Quantification of podocyte cell surface area in (E). n=6. (G) Representative immunoblot images for integrin β1 and glyceraldehyde-3-phosphate dehydrogenase (GAPDH) in Ctrl and Pod-Epn TKO primary podocytes. (H) Quantification of immunoblots in (G). n=8. (I) Igtb1 mRNA expression levels in Ctrl (black) and Pod-Epn TKO (red) primary podocytes. n=8. (J) Representative immunoblot images for SRF and GAPDH in Ctrl and Pod-Epn TKO primary podocytes. (K) Quantification of immunoblots in (J). n=6. (L) Quantification of relative SRF activity using luciferase reporter assay in control (black) and Pod-Epn TKO (red) primary podocytes. n=5. (M) Quantification of ChIP-qPCR using SRF Ab and primer sets of Itgb1 promoter region in Ctrl (black) and Pod-Epn TKO (red) primary podocytes with negative control as IgG. n=5. (N) Cdc42 activity in primary podocytes examined with or without ML 141 pretreatment. (O) Quantification of relative SRF activity using luciferase reporter assay in primary podocytes treated with or without ML 141. n=6. *P<0.05, **P<0.01.
Figure 6.
Figure 6.
Podocyte-specific deletion of Srf results in proteinuria, glomerulosclerosis, and kidney failure. (A) Quantification of urine albumin normalized to urine creatinine in control (Ctrl) (black) and Pod-Srf KO (blue) mice at 3, 6, and 12 weeks of age. n=7. (B) Plasma creatinine in Ctrl (black) and Pod-Srf KO (blue) mice at 3, 6, and 12 weeks of age. n=6. (C) Plasma BUN in Ctrl (black) and Pod-Srf KO (blue) mice at 3, 6, and 12 weeks of age. n=6. (D) Representative light microscopic images of PAS staining in Ctrl and Pod-Srf KO mice glomeruli at 3, 6, and 12 weeks of age. Arrowheads (black) show mesangial matrix accumulation. Scale bar, 25 μm. (E) Representative images of TRI staining in Ctrl and Pod-Srf KO mice kidney interstitium at 3, 6, and 12 weeks of age. Arrowheads (black) display interstitial fibrosis, and asterisk (white) represents dilated tubules and proteinaceous casts. Scale bar, 50 μm. (F) Transmission electron micrographs in Ctrl and Pod-Srf KO mice foot process at 3, 6, and 12 weeks of age. Asterisk (white) depict foot process effacement. Scale bar, 2 μm. (G) Quantification of glomerulosclerosis in (D). n=7 different mice. (H) Quantification of interstitial fibrosis in (E). n=7 different mice. (I) Quantification of the number of foot processes per micrometer of GBM in Ctrl (black) and Pod-Srf KO (blue) mice at 3, 6, and 12 weeks of age. n=3 different mice. **P<0.01. Alb, albumin; Cr, creatinine; U, urinary.
Figure 7.
Figure 7.
Pod Srf KO podocytes demonstrate reduced cell adhesion, spreading, and migration accompanied with diminished β1 integrin expression. (A) Adhesion to type-1 collagen and laminin in control (Ctrl) (black), Pod-Epn TKO (red), and Pod-Srf KO (blue) primary podocytes. *P<0.05, **P<0.01, compared with Ctrl and Pod-Epn TKO. n=6. (B) Representative immunofluorescence images of WT1 in Ctrl and Pod-Srf KO mice glomeruli at 6 weeks of age. Scale bar, 10 μm. (C) Quantification of the number of WT1 stained nucleus (B). n=3 different mice. (D) Representative images of cell spreading in Ctrl, Pod-Epn TKO, and Pod-Srf KO mice primary podocytes. Scale bar, 20 μm. (E) Quantification of podocyte cell surface area in (D). n=6. (F) Quantification of wound-healing assay in Ctrl (black), Pod-Epn TKO (red), and Pod-Srf KO (blue) mice primary podocytes. n=7. (G) Representative immunofluorescence images of integrin β1 (green) and WT1 (red) in Ctrl, Pod-Epn TKO, and Pod-Srf KO primary podocytes and glomeruli. (H) Representative immunoblot images of integrin β1 and glyceraldehyde-3-phosphate dehydrogenase (GAPDH) in Ctrl, Pod-Epn TKO, and Pod-Srf KO primary podocytes. (I) Quantification of immunoblots in (H). n=8. *P<0.05, **P<0.01.
Figure 8.
Figure 8.
Cartoon schematic showing that loss of epsins in podocytes results in impaired Cdc42 activation and reduced integrin β1 expression through reduced SRF binding to the Itgb1 promoter. (A) Cartoon schematic of normal podocyte with Epn regulating CDC42 activation to induce Srf regulated Itgb1 expression. (B) Loss of Epn results in impaired CDC42 activation resulting in reduced Itgb1 expression resulting in podocyte loss.

Similar articles

Cited by

References

    1. Nagata M: Podocyte injury and its consequences. Kidney Int 89: 1221–1230, 2016. - PubMed
    1. Schiffer M, Teng B, Gu C, Shchedrina VA, Kasaikina M, Pham VA, et al. : Pharmacological targeting of actin-dependent dynamin oligomerization ameliorates chronic kidney disease in diverse animal models. Nat Med 21: 601–609, 2015. - PMC - PubMed
    1. Wen P, Zhang F, Fu Y, Zhu JY, Han Z: Exocyst genes are essential for recycling membrane proteins and maintaining slit diaphragm in Drosophila nephrocytes. J Am Soc Nephrol 31: 1024–1034, 2020. - PMC - PubMed
    1. Martin CE, New LA, Phippen NJ, Keyvani Chahi A, Mitro AE, Takano T, et al. : Multivalent nephrin-Nck interactions define a threshold for clustering and tyrosine-dependent nephrin endocytosis. J Cell Sci 133: jcs236877, 2020. - PubMed
    1. Inoue K, Tian X, Velazquez H, Soda K, Wang Z, Pedigo CE, et al. : Inhibition of endocytosis of clathrin-mediated angiotensin II receptor type 1 in podocytes augments glomerular injury. J Am Soc Nephrol 30: 2307–2320, 2019. - PMC - PubMed

Publication types