. 2020 Oct 12;11(1):5139.
doi: 10.1038/s41467-020-18781-2.

Type 2 and interferon inflammation regulate SARS-CoV-2 entry factor expression in the airway epithelium

Affiliations

Type 2 and interferon inflammation regulate SARS-CoV-2 entry factor expression in the airway epithelium

Satria P Sajuthi et al. Nat Commun. .

Abstract

Coronavirus disease 2019 (COVID-19) is caused by SARS-CoV-2, an emerging virus that utilizes host proteins ACE2 and TMPRSS2 as entry factors. Understanding the factors affecting the pattern and levels of expression of these genes is important for deeper understanding of SARS-CoV-2 tropism and pathogenesis. Here we explore the role of genetics and co-expression networks in regulating these genes in the airway, through the analysis of nasal airway transcriptome data from 695 children. We identify expression quantitative trait loci for both ACE2 and TMPRSS2, that vary in frequency across world populations. We find TMPRSS2 is part of a mucus secretory network, highly upregulated by type 2 (T2) inflammation through the action of interleukin-13, and that the interferon response to respiratory viruses highly upregulates ACE2 expression. IL-13 and virus infection mediated effects on ACE2 expression were also observed at the protein level in the airway epithelium. Finally, we define airway responses to common coronavirus infections in children, finding that these infections generate host responses similar to other viral species, including upregulation of IL6 and ACE2. Our results reveal possible mechanisms influencing SARS-CoV-2 infectivity and COVID-19 clinical outcomes.


Conflict of interest statement

The authors declare no competing interests.

Figures

Fig. 1
Fig. 1. ACE2 and TMPRSS2 are expressed by multiple nasal airway cell types.
a UMAP visualization of 8,291 cells derived from a human nasal airway epithelial brushing depicts multiple epithelial and immune cell types identified through unsupervised clustering. b Log Count Per Million (CPM) normalized expression of ACE2 in epithelial and immune cell types. c Log CPM normalized expression of TMPRSS2 in epithelial and immune cell types.
Fig. 2
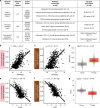
Fig. 2. TMPRSS2 is part of a T2 inflammation-induced mucus secretory network.
a WGCNA identified networks of co-regulated genes related to mucus secretory function (black), T2 inflammation-induced mucus secretory function (pink), and canonical T2 inflammation biomarkers (saddle brown). TMPRSS2 was within the pink network. Select pathway and cell-type enrichments for network genes are shown. Enrichment p-values were obtained from a one-sided hypergeometric test. Benjamini–Hochberg correction was used to control for false discovery rate. b Scatterplot revealing a strong positive correlation between TMPRSS2 expression and summary (eigengene) expression of the T2 inflammatory, mucus secretory network. p-values were obtained from the two-sided Pearson correlation test. c Scatterplot revealing a strong positive correlation between TMPRSS2 expression and summary (eigengene) expression of the canonical T2 inflammation biomarker network. p-values were obtained from the two-sided Pearson correlation test. d Box plots revealing strong upregulation of TMPRSS2 expression among T2-high (n = 364) compared to T2-low (n = 331) subjects. Differential expression testing between T2-high and T2-low groups was performed using a two-sided Wilcoxon test. e Scatterplot revealing a strong negative correlation between ACE2 expression and summary (eigengene) expression of the T2 inflammation mucus secretory network. p-values were obtained from the two-sided Pearson correlation test. f Scatterplot revealing a strong negative correlation between ACE2 expression and summary (eigengene) expression of the canonical T2 inflammation biomarker network. p-values were obtained from the two-sided Pearson correlation test. g Box plots revealing strong downregulation of ACE2 expression among T2-high (n = 364) compared to T2-low (n = 331) subjects. Differential expression testing between T2-high and T2-low groups was performed using a two-sided Wilcoxon test. Box centers give the median, upper and lower box bounds correspond to first and third quartiles and the upper/lower whiskers extend from the upper/lower bounds up to/down from the largest/smallest value, no further than 1.5 × IQR from the upper/lower bound (where IQR is the inter-quartile range). Data beyond the end of whiskers are plotted individually.
Fig. 3
Fig. 3. ACE2 and TMPRSS2 are both regulated by IL-13 in the airway epithelium.
a Experimental schematic detailing the timeline for differentiation of basal airway epithelial cells into a mucociliary airway epithelium and treatment with chronic (10 days) or acute (72 h) IL-13 (10 ng mL−1). b Box plots of count-normalized expression between paired (n = 5 pairs) nasal airway cultures (control/IL-13) revealing strong downregulation of bulk ACE2 expression with IL-13 treatment. Differential expression results are from DESeq2. Benjamini–Hochberg correction was used to control for false discovery rate. c Box plots of count-normalized expression between paired (n = 5 pairs) nasal airway cultures (control/IL-13) revealing strong upregulation of bulk TMPRSS2 expression with IL-13 treatment. Differential expression results are from DESeq2. Benjamini–Hochberg correction was used to control for false discovery rate. d UMAP visualization of 6,969 cells derived from control and IL-13 stimulated tracheal airway ALI cultures depict multiple epithelial cell types identified through unsupervised clustering. e Violin plots of normalized ACE2 expression across epithelial cell types from tracheal airway ALI cultures, stratified by treatment (gray = control, red = IL-13). Differential expression using a two-sided Wilcoxon test was performed between control and IL-13-stimulated cells with significant differences in expression for a cell type indicated by a * (p < 0.05). p-values (left to right) = 0.62; 0.18; 2.8e−4; 0.66; 4.6e−6; 0.08; NA; 0.77; NA; NA; 0.12. f Violin plots of normalized TMPRSS2 expression across epithelial cell types from tracheal airway ALI cultures, stratified by treatment (gray = control, red = IL-13). Differential expression using a two-sided Wilcoxon test was performed between control and IL-13-stimulated cells with significant differences in expression for a cell type indicated by a * (p < 0.05). p-values (left to right) = 9.4e−4; 1.4e−11; 0.51; 2.5e−14; 6.9e−117; 1.5e−38; 2.3e−4; 2.3e−10; 0.46; NA; 0.95. Box centers give the median, upper and lower box bounds correspond to first and third quartiles and the upper/lower whiskers extend from the upper/lower bounds up to/down from the largest/smallest value, no further than 1.5 × IQR from the upper/lower bound (where IQR is the inter-quartile range). Data beyond the end of whiskers are plotted individually.
Fig. 4
Fig. 4. ACE2 is an interferon network gene regulated by a viral infection.
a Scatterplot revealing a strong positive correlation between ACE2 expression and summary (eigengene) expression of the cytotoxic immune response network (purple). p-values were obtained from a two-sided Pearson correlation test. b Scatterplot revealing a strong positive correlation between ACE2 expression and summary (eigengene) expression of the interferon response network (tan). p-values were obtained from a two-sided Pearson correlation test. c WGCNA analysis identified networks of co-regulated genes related to cytotoxic immune response (purple) and interferon response (tan). ACE2 was within the purple network. Select pathway and cell-type enrichments for network genes are shown. Enrichment p-values were obtained from a one-sided hypergeometric test. Benjamini–Hochberg correction was used to control for false discovery rate. d Box plots of count-normalized expression from GALA II nasal epithelial samples reveal strong upregulation of ACE2 expression among interferon-high (n = 78) compared to interferon-low (n = 617) subjects. Differential expression results are from DESeq2. Benjamini–Hochberg correction was used to control for false discovery rate. e Pie graph depicting the percentage of each type of respiratory virus infection found among GALA II subjects in whom viral reads were found. f Experimental schematic detailing a timeline for differentiation of basal airway epithelial cells into a mucociliary airway epithelium and experimental infection with HRV-A16. g Box plots of count-normalized expression between paired (n = 5 pairs) nasal airway cultures (control/HRV-A16 infected) revealing strong upregulation of ACE2 expression with HRV-A16 infection. Differential expression results are from DESeq2. Benjamini–Hochberg correction was used to control for false discovery rate. h Box plots of count-normalized expression between paired (n = 5 pairs) nasal airway cultures (control/HRV-A16-infected) revealing no effect of HRVA-16 on TMPRSS2 expression. Differential expression results are from DESeq2. Benjamini–Hochberg correction was used to control for false discovery rate. Box centers give the median, upper and lower box bounds correspond to first and third quartiles and the upper/lower whiskers extend from the upper/lower bounds up to/down from the largest/smallest value, no further than 1.5 × IQR from the upper/lower bound (where IQR is the inter-quartile range). Data beyond the end of whiskers are plotted individually.
Fig. 5
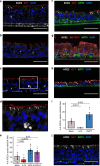
Fig. 5. Airway surface ACE2 protein is regulated by IL-13 and viral infection.
ac Immunofluorescence staining of in vitro nasal airway epithelial ALI cultures (derived from a single GALA II asthmatic child) derived from vehicle-treated (a), 5 days IL-13(10 ng mL−1) treated (b), and 24 h HRV-A infected epithelium (c). Representative images of ciliated cells (ACT; red) and ACE2-positive (white) cells. The nuclei were counterstained with DAPI (blue). ACE2 protein was located in the apical compartment and decreased with IL-13 treatment and increased in HRV-A infection. Scale bars: 60 μm. d Zoomed in image of c. e Quantification of apical ACE2-positive cells per 20x field for each condition in the IL-13/HRV mature culture stimulation experiment (n = 1 donor). p-values were obtained from a two-sided t-test. Data are presented as mean values ± SEM. fh Immunofluorescence staining of in vitro nasal airway epithelial ALI cultures from a single child non-asthmatic donor derived from vehicle-treated (f), 21 days IL-13 (10 ng mL−1) treated (g), and 21 days DAPT(5 μM) treated epithelium (h). Representative images of ciliated cells (ACT; red), basal cells (KRT5; green), and ACE2-positive (white) cells. The nuclei were counterstained with DAPI (blue). ACE2 protein located in the apical compartment and decreased in IL-13 treatment and increased in DAPT treatment. Scale bars: 60 μm. i Quantification of apical ACE2-positive cells per 20x field for each condition in the IL-13/DAPT differentiation experiment (n = 1 donor). p-values were obtained from a two-sided t-test. Data are presented as mean values ± SEM. j Immunofluorescence staining of in vivo trachea tissues from a single healthy donor. Representative images of ciliated cells (ACT; red), basal cells (KRT5; green), and ACE2-positive (white) cells. The nuclei were counterstained with DAPI (blue). ACE2 protein located in the apical compartment of ACT positive ciliated cells. Scale bars: 60 μm. All images were captured on the Echo Revolve R4 and images were cropped and resized using Affinity Designer. For each image, brightness and contrasts were uniformly adjusted relative to the brightest feature to balance exposure of each color channel.
Fig. 6
Fig. 6. Nasal airway ACE2 and TMPRSS2 are regulated by eQTL variants.
a Locuszoom plot of ACE2 eQTL signals. The lead eQTL variant (rs181603331) is highlighted with a purple dot. The strength of linkage disequilibrium (LD) between rs181603331 and other variants is discretely divided into five quantiles and mapped into five colors (dark blue, sky blue, green, orange, and red) sequentially from low LD to high LD. b Locuszoom plot of TMPRSS2 eQTL signals. The three independent eQTL variants (rs1475908, rs2838057, rs74659079) and their LD with other variants (r2) are represented by red, blue, and green color gradient, respectively. c Box plots of normalized ACE2 expression among the three genotypes of the lead ACE2 eQTL variant (rs181603331). log2AFC = log2 of the allelic fold change associated with the variant. (n: GG = 654, GT = 8, TT = 3). eQTL p-values were obtained from testing the additive genotype effect on gene expression using the linear regression model implemented in FastQTL. Benjamini–Hochberg correction was used to control for false discovery rate. d Box plots of normalized TMPRSS2 expression among the three genotypes of the lead TMPRSS2 eQTL variant (rs1475908). log2AFC = log2 of the allelic fold change associated with the variant. (n: GG = 432, GA = 218, AA = 31). eQTL p-values were obtained from testing the additive genotype effect on gene expression using the linear regression model implemented in FastQTL. Benjamini–Hochberg correction was used to control for false discovery rate. e Bar plots depicting allele frequencies of the ACE2 eQTL variant rs181603331 and TMPRSS2 eQTL variants (rs1475908, rs2838057, rs74659079) across world populations. Allele frequency data were obtained from gnomAD v2.1.1. Box centers give the median, upper and lower box bounds correspond to first and third quartiles, and the upper/lower whiskers extend from the upper/lower bounds up to/down from the largest/smallest value, no further than 1.5× IQR from the upper/lower bound (where IQR is the inter-quartile range). Data beyond the end of whiskers are plotted individually.
Fig. 7
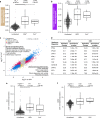
Fig. 7. Host response to CoV strains are similar to other respiratory viruses.
a Box plots revealing a strong and equivalent upregulation of summary (eigengene [Eg]) expression for the interferon response network among ORV- and CoV-infected GALA II subjects (n = 22, 9 respectively), compared to uninfected subjects (n = 582). Differential expression analysis between infected and uninfected groups was performed with a two-sided t-test. b Box plots revealing a strong and equivalent upregulation of summary (eigengene [Eg]) expression for the cytotoxic immune response network among ORV- and CoV-infected GALA II subjects (n = 22, 9 respectively), compared to uninfected subjects (n = 582). Differential expression analysis between infected and uninfected groups was performed with a two-sided t-test. c Scatterplot showing the similarity in log2FC differential expression of genes in ORV (x axis) and CoV (y axis) infected individuals relative to uninfected subjects. The color of the points corresponds to the group in which each gene was identified as significant (FDR < 0.05, absolute log2FC > 0.5). The Pearson correlation coefficient of the significant genes (excluding the “Neither” category) is 0.95. Top enrichment terms for genes that were significantly differentially expressed in both virus infections (blue) are shown. d Top upstream regulators predicted by Ingenuity Pathway Analysis to be regulating the genes that were upregulated in CoV. Enrichment values for these CoV regulators, using the ORV upregulated genes are also shown. Enrichment p-values were obtained from IPA. No multiple comparison adjustment was performed. e Box plots revealing upregulation of IL6 expression in virus-infected individuals (n: CoV+ = 9, ORV+ = 22, non-infected = 582). Differential expression analysis was performed with limma. Benjamini–Hochberg correction was used to control for false discovery rate. f Box plots revealing upregulation of ACE2 expression in virus-infected individuals (n: CoV+ = 9, ORV+ = 22, non-infected=582). Differential expression analysis was performed with limma. Benjamini–Hochberg correction was used to control for false discovery rate. Box centers give the median, upper and lower box bounds correspond to first and third quartiles and the upper/lower whiskers extend from the upper/lower bounds up to/down from the largest/smallest value, no further than 1.5 × IQR from the upper/lower bound (where IQR is the inter-quartile range). Data beyond the end of whiskers are plotted individually.

Update of

Similar articles

Cited by

  • Potential Protective Factors for Allergic Rhinitis Patients Infected with COVID-19.
    Dong J, Su D, Zhao B, Han J, Tu M, Zhang K, Wang F, An Y. Dong J, et al. Curr Issues Mol Biol. 2024 Jun 28;46(7):6633-6645. doi: 10.3390/cimb46070395. Curr Issues Mol Biol. 2024. PMID: 39057037 Free PMC article. Review.
  • IL-13 decreases susceptibility to airway epithelial SARS-CoV-2 infection but increases disease severity in vivo.
    Ghimire S, Xue B, Li K, Gannon RM, Wohlford-Lenane CL, Thurman AL, Gong H, Necker GC, Zheng J, Meyerholz DK, Perlman S, McCray PB Jr, Pezzulo AA. Ghimire S, et al. bioRxiv [Preprint]. 2024 Jul 4:2024.07.03.601941. doi: 10.1101/2024.07.03.601941. bioRxiv. 2024. PMID: 39005257 Free PMC article. Preprint.
  • The Asthma Risk Gene, GSDMB, Promotes Mitochondrial DNA-induced ISGs Expression.
    Liu T, Hecker J, Liu S, Rui X, Boyer N, Wang J, Yu Y, Zhang Y, Mou H, Gomez-Escobar LG, Choi AMK, Raby BA, Weiss ST, Zhou X. Liu T, et al. J Respir Biol Transl Med. 2024 Mar;1(1):10005. doi: 10.35534/jrbtm.2024.10005. Epub 2024 Mar 31. J Respir Biol Transl Med. 2024. PMID: 38737375 Free PMC article.
  • Association Between ACE2 and Lung Diseases.
    Su C, Li C, Hu X, Wang J, Liu L, Zhang X, Tong Y. Su C, et al. Infect Drug Resist. 2024 May 7;17:1771-1780. doi: 10.2147/IDR.S445180. eCollection 2024. Infect Drug Resist. 2024. PMID: 38736435 Free PMC article. Review.
  • A common polymorphism in the Intelectin-1 gene influences mucus plugging in severe asthma.
    Everman JL, Sajuthi SP, Liegeois MA, Jackson ND, Collet EH, Peters MC, Chioccioli M, Moore CM, Patel BB, Dyjack N, Powell R, Rios C, Montgomery MT, Eng C, Elhawary JR, Mak ACY, Hu D, Huntsman S, Salazar S, Feriani L, Fairbanks-Mahnke A, Zinnen GL, Michel CR, Gomez J, Zhang X, Medina V, Chu HW, Cicuta P, Gordon ED, Zeitlin P, Ortega VE, Reisdorph N, Dunican EM, Tang M, Elicker BM, Henry TS, Bleecker ER, Castro M, Erzurum SC, Israel E, Levy BD, Mauger DT, Meyers DA, Sumino K, Gierada DS, Hastie AT, Moore WC, Denlinger LC, Jarjour NN, Schiebler ML, Wenzel SE, Woodruff PG, Rodriguez-Santana J, Pearson CG, Burchard EG, Fahy JV, Seibold MA. Everman JL, et al. Nat Commun. 2024 May 9;15(1):3900. doi: 10.1038/s41467-024-48034-5. Nat Commun. 2024. PMID: 38724552 Free PMC article.

References

    1. Wang C, Horby PW, Hayden FG, Gao GF. A novel coronavirus outbreak of global health concern. Lancet. 2020;395:470–473. doi: 10.1016/S0140-6736(20)30185-9. - DOI - PMC - PubMed
    1. Zhu N, et al. A novel coronavirus from patients with pneumonia in China, 2019. N. Engl. J. Med. 2020;382:727–733. doi: 10.1056/NEJMoa2001017. - DOI - PMC - PubMed
    1. Baud, D. et al. Real estimates of mortality following COVID-19 infection. Lancet Infect. Dis.20, 773 (2020). - PMC - PubMed
    1. Du, Y. et al. Clinical features of 85 fatal cases of COVID-19 from Wuhan: a retrospective observational study. Am. J. Respir. Crit. Care Med.201, 1372–1379 (2020). - PMC - PubMed
    1. Zhou F, et al. Clinical course and risk factors for mortality of adult inpatients with COVID-19 in Wuhan, China: a retrospective cohort study. Lancet. 2020;395:1054–1062. doi: 10.1016/S0140-6736(20)30566-3. - DOI - PMC - PubMed

Publication types

MeSH terms

Grants and funding

LinkOut - more resources