. 2020 Dec 1;31(25):2791-2802.
doi: 10.1091/mbc.E20-01-0088. Epub 2020 Oct 7.

Microtubule-dependent pushing forces contribute to long-distance aster movement and centration in Xenopus laevis egg extracts

Affiliations

Microtubule-dependent pushing forces contribute to long-distance aster movement and centration in Xenopus laevis egg extracts

Taylor Sulerud et al. Mol Biol Cell. .

Abstract

During interphase of the eukaryotic cell cycle, the microtubule (MT) cytoskeleton serves as both a supportive scaffold for organelles and an arborized system of tracks for intracellular transport. At the onset of mitosis, the position of the astral MT network, specifically its center, determines the eventual location of the spindle apparatus and ultimately the cytokinetic furrow. Positioning of the MT aster often results in its movement to the center of a cell, even in large blastomeres hundreds of microns in diameter. This translocation requires positioning forces, yet how these forces are generated and then integrated within cells of various sizes and geometries remains an open question. Here we describe a method that combines microfluidics, hydrogels, and Xenopus laevis egg extract to investigate the mechanics of aster movement and centration. We determined that asters were able to find the center of artificial channels and annular cylinders, even when cytoplasmic dynein-dependent pulling mechanisms were inhibited. Characterization of aster movement away from V-shaped hydrogel barriers provided additional evidence for a MT-based pushing mechanism. Importantly, the distance over which this mechanism seemed to operate was longer than that predicted by radial aster growth models, agreeing with recent models of a more complex MT network architecture within the aster.


Figures

FIGURE 1:
FIGURE 1:
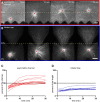
Dynein inhibition via addition of p150-CC1 does not affect aster centration in X. laevis egg extracts. Centration of aMTOCs in interphase X. laevis egg extracts was investigated in PDMS microfluidic channels or hydrogel annular cylinders. Time-lapse spinning-disk confocal microscopy was used to visualize MTs, which were labeled with mCherry-TMBD and are shown in grayscale (A–C). The dashed line in each series of images runs through the midpoint of the channel width (A, B) or the center of the annular cylinder (C) and represents 50% of the channel width or interior diameter accordingly. Images in A show an aster starting near a PDMS channel wall (0%) and centering over time in untreated extract, whereas the images in B show similar aster centration in extract treated with 2 µM p150-CC1. Images in C show aster centration within a hydrogel annular cylinder in untreated extract. For each experimental condition, the aMTOC position (red asterisk) relative to the proximal wall was plotted over time as a percent of the channel width in D (red lines) and E (blue lines) and of the interior diameter in F (green lines). The colored lines represent traces from each individual experiment; n ≥ 10 for each condition. Yellow arrowheads point to MT bending. For all images, scale bar = 20 µm.
FIGURE 2:
FIGURE 2:
Asters are unable to center when confined in certain asymmetric enclosure geometries. The ability of aMTOC asters to center was investigated in asymmetric microfluidic channels (A) and asymmetric hydrogel structures designed to resemble the cross-section of the inside of a lobster trap (B). Aster movement was visualized and tracked as described in Figure 1. For each set of time-lapse image series, the dashed yellow lines run through the midpoint of the asymmetric channel width (A) or the center of the lobster trap enclosure (B) and represent 50% of the channel width or interior length, respectively. For the experimental conditions shown in A and B, the aMTOC position (red asterisk) relative to the nearest wall at experimental onset was plotted over time as a percent of the channel width and interior length with the graphs in C (red lines) and D (blue lines), respectively. The colored lines represent individual traces for each experiment; n ≥ 9 for each condition. For all images, scale bars = 20 µm.
FIGURE 3:
FIGURE 3:
Aster movement away from V-shaped barriers implies a pushing-based mechanism for translocation. Each of the paired sets of cartoon depictions in the top row of A shows a microfluidic device (left) and a zoomed-in view of the channel interior (right) for the different steps required for aMTOC capture and V-shaped structure formation. Corresponding bright-field and fluorescent images of each sequential step, moving left to right, are shown in the bottom row. (i) A photolabile prepolymer hydrogel solution (PEGdiPDA) containing aMTOCs was flowed into the channel of a microfluidic device. (ii) The hydrogel solution was exposed to UV light (λ = 405 nm) patterned using a digital micromirror array placed in a conjugate plane to the specimen in the light path of the microscope. For these experiments, a small circle in the electronic mask was aligned with an aMTOC in the PEGdiPDA solution. Upon exposure, this produced a cylindrical column of photolabile hydrogel surrounding an aMTOC at its base, temporarily fixing it in place and preventing the aMTOC from being washed away in subsequent steps. This anchoring step was repeated for multiple aMTOCs in the prepolymer solution. (iii) A nondegradable prepolymer hydrogel solution (PEGDA) was flowed into and exposed to UV light (λ = 405 nm) in the shape of a V aligned such that the aMTOC being targeted was positioned close to the vertex of the hydrogel structure. (iv) After the generation of all structures, the unpolymerized solution within the device was washed out with buffer and ultimately replaced with interphase X. laevis egg extract. (v) The aMTOC was released by degrading the PEG-diPDA cylinder with exposure to higher-energy UV light (λ = 365 nm). Extracts were supplemented with mCherry-TMBD, and aMTOC aster movement was recorded using time-lapse spinning-disk confocal microscopy as in Figure 1. An example of aster movement from the vertex of a 30°V is shown in B and from a 90°V in C. The yellow dashed line in each image extends from the center of the aMTOC position (red asterisk) in B and is included to facilitate comparison of aMTOC velocity away from the vertex in C. aMTOC movement away from the vertex of the 30°V (average position, red line) and 90°V (average position, blue line) structures was plotted as a function of time to make the graphs shown in D. Shaded outlines represent 95% confidence intervals; n ≥ 10 for each V type. Using the slopes from these plots, the aMTOC instantaneous velocity was plotted vs. the shortest distance to the nearest barrier surface (E) and the distance between the CoMM (see Materials and Methods) and the aMTOC (F) for both 30°V (filled red triangles and squares, respectively) and 90°V (open blue triangles and squares, respectively) structures. Here a positive velocity indicates that the aMTOC was moving away from the vertex. For all images, scale bars = 20 µm.
FIGURE 4:
FIGURE 4:
Aster movement does not require bulk translocation of the entire MT network. The cartoon in A illustrates the approach used to decouple aster growth and aMTOC movement. aMTOCs were partially embedded in PEGdiPDA posts using the methodology described in Figure 3A such that they could nucleate MTs from their extract-exposed surfaces before being released. Time-lapse spinning-disk confocal microscopy was used to visualize MTs labeled with mCherry-TMBD as in Figure 1. The yellow dashed line at each time point in B extends from the aMTOC position (red asterisk) and is included to facilitate comparison of aMTOC velocities after release at time = 0. The images in B and C show aMTOC movement at the start of nucleation away from the vertex of a 30°V and a 30° teardrop, respectively. In contrast, the images in D show an aMTOC only partially embedded in the PEGdiPDA post and allowed to nucleate MTs for 15 min before light-induced release as described in A. For each experimental condition, aMTOC movement away from the barrier’s vertex was plotted as a function of time with positional data from B, C, and D shown in graphs E, F, and G, respectively. Shaded outlines represent 95% confidence intervals; gray lines represent each experiment; n ≥ 6. Yellow arrowheads point to MT bending. For all images, scale bars = 20 µm.
FIGURE 5:
FIGURE 5:
Cartoon summary for how MT-based pushing forces might facilitate aster movement in our system. The cartoon in A depicts how asters might behave assuming an unbranched, radial elongation model of aster growth. Initially, short unbundled MTs extending from the aMTOC and reaching the proximal barrier surface might be able to generate sufficient force to produce aster movement. However, later in time, once MTs approach their critical length, they would buckle under compressive loads, resulting in reduced force generation and a failure to center (dashed yellow line). The cartoon in B shows an architecturally more complicated aster with MT branching and bundling to effectively brace MTs and allow for more growing ends to impinge on the proximal barrier surface. In this model, MTs would be sufficiently buttressed by interactions with other MTs, resulting in a larger pushing force and, ultimately, a longer distance through which asters could traverse.

Similar articles

Cited by

References

    1. Adames NR, Cooper JA (2000). Microtubule interactions with the cell cortex causing nuclear movements in Saccharomyces cerevisiae. J Cell Biol , 863–874. - PMC - PubMed
    1. Aist JR, Liang H, Berns MW (1993). Astral and spindle forces in PtK2 cells during anaphase B: a laser microbeam study. J Cell Sci (Pt 4), 1207–1216. - PubMed
    1. Bisht J, LeValley P, Noren B, McBride R, Kharkar P, Kloxin A, Gatlin J, Oakey J (2019). Light-inducible activation of cell cycle progression in Xenopus egg extracts under microfluidic confinement. Lab Chip , 3499–3511. - PMC - PubMed
    1. Brangwynne CP, MacKintosh FC, Kumar S, Geisse NA, Talbot J, Mahadevan L, Parker KK, Ingber DE, Weitz DA (2006). Microtubules can bear enhanced compressive loads in living cells because of lateral reinforcement. J Cell Biol , 733–741. - PMC - PubMed
    1. Brito DA, Strauss J, Magidson V, Tikhonenko I, Khodjakov A, Koonce MP (2005). Pushing forces drive the comet-like motility of microtubule arrays in Dictyostelium. Mol Biol Cell , 3334–3340. - PMC - PubMed

Publication types

LinkOut - more resources