. 2020 Oct 5;10(1):16509.
doi: 10.1038/s41598-020-73613-z.

Identification of nitric oxide (NO)-responsive genes under hypoxia in tomato (Solanum lycopersicum L.) root

Affiliations

Identification of nitric oxide (NO)-responsive genes under hypoxia in tomato (Solanum lycopersicum L.) root

Vajiheh Safavi-Rizi et al. Sci Rep. .

Abstract

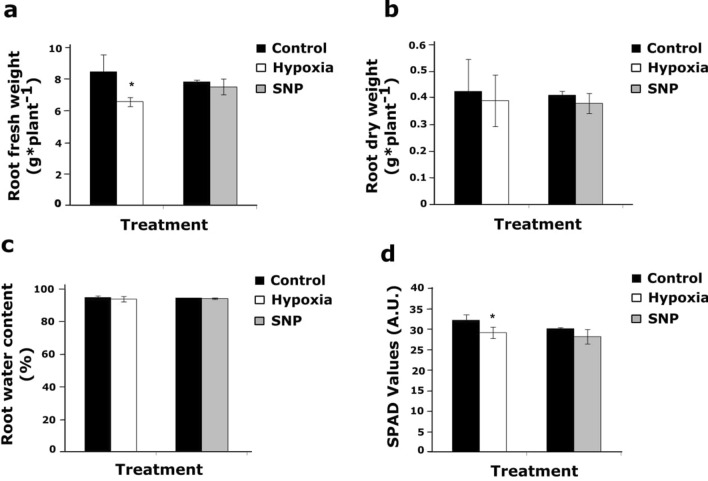
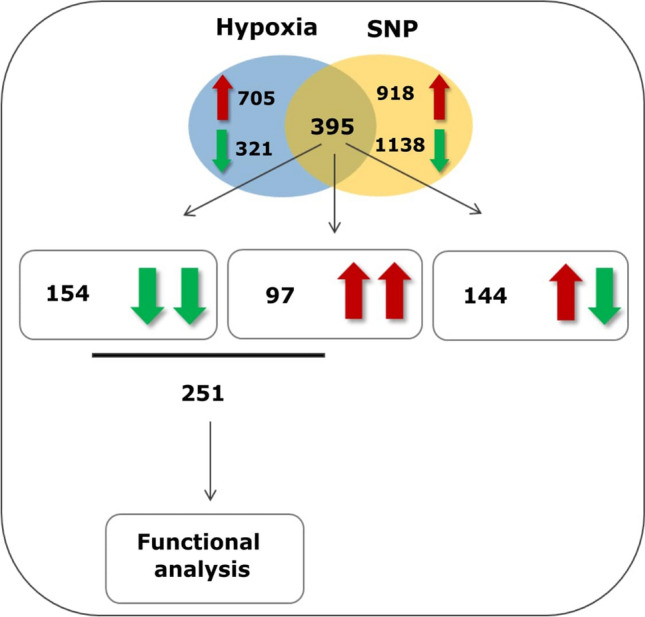
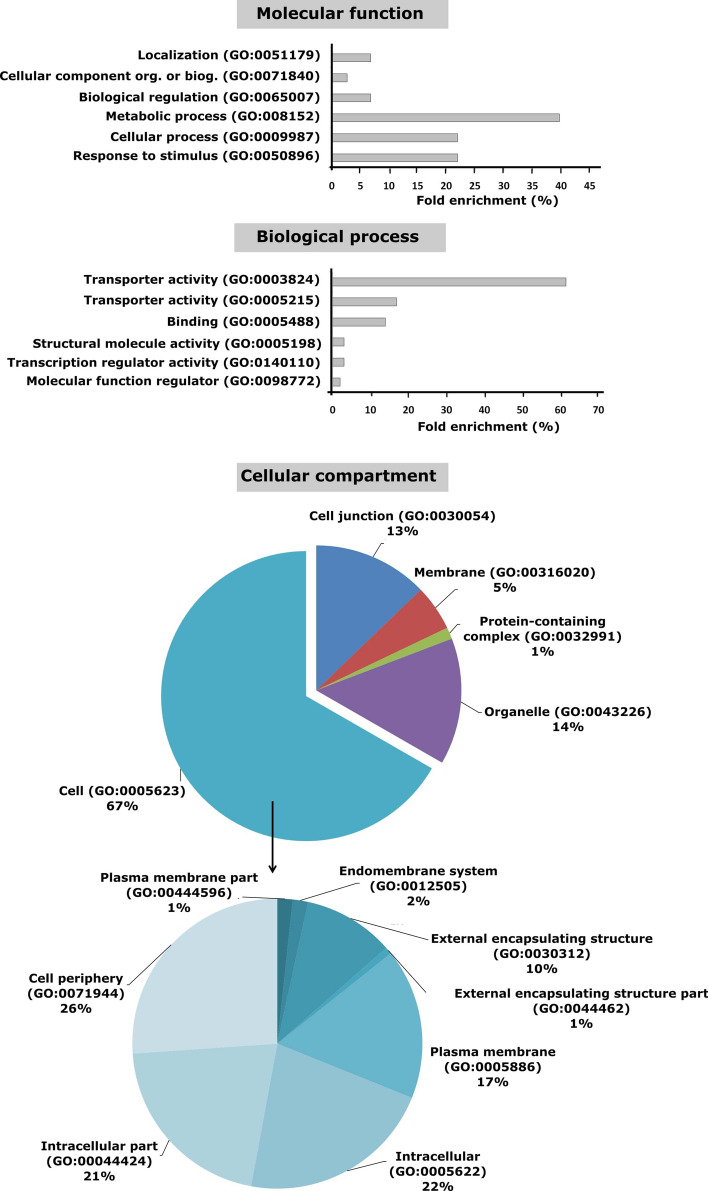
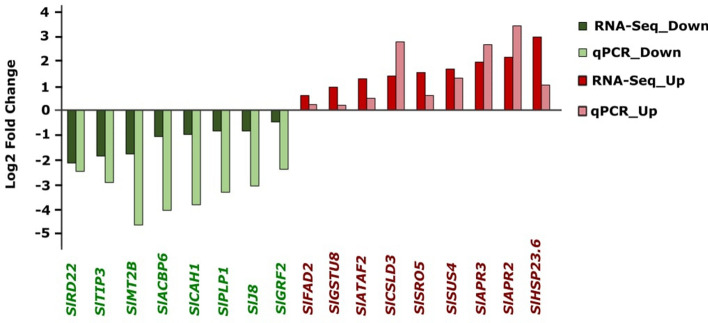
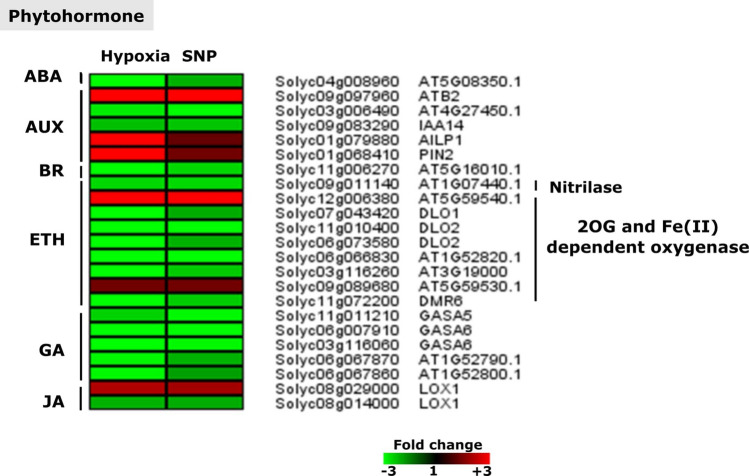
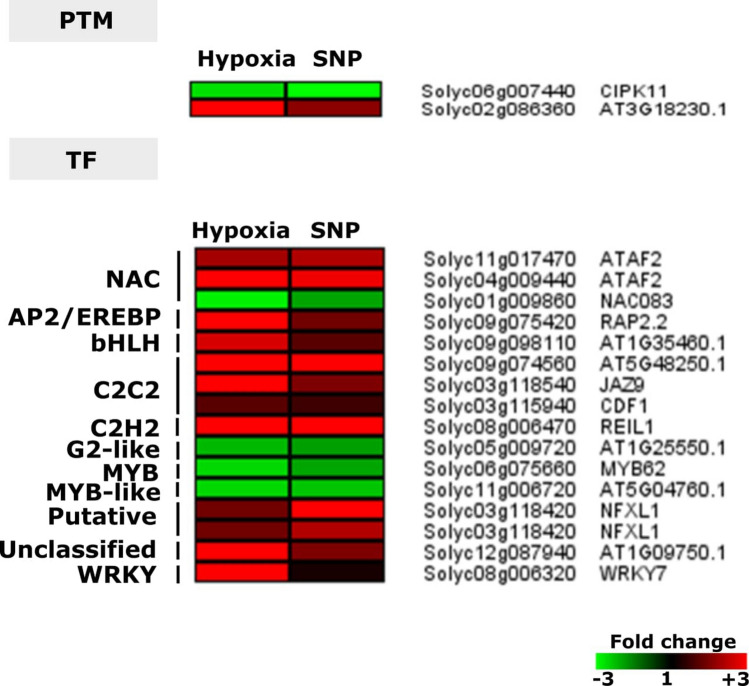
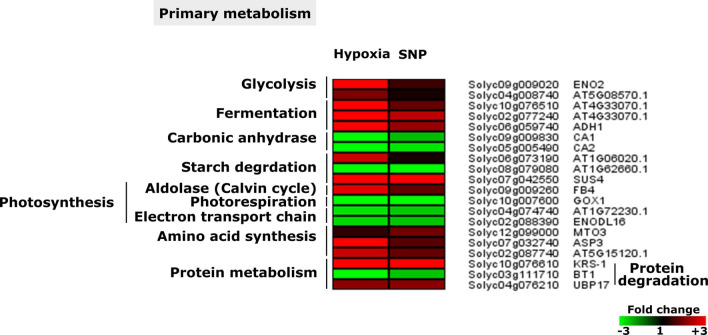
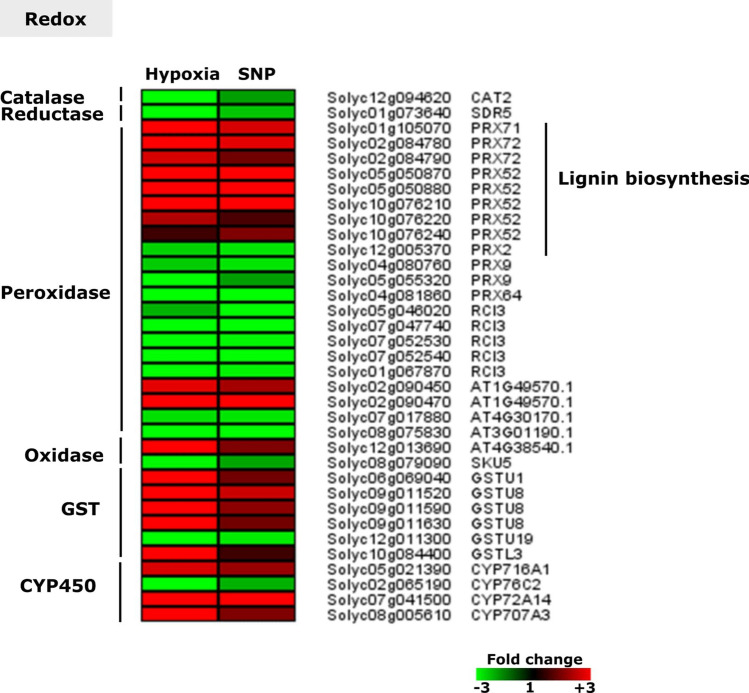
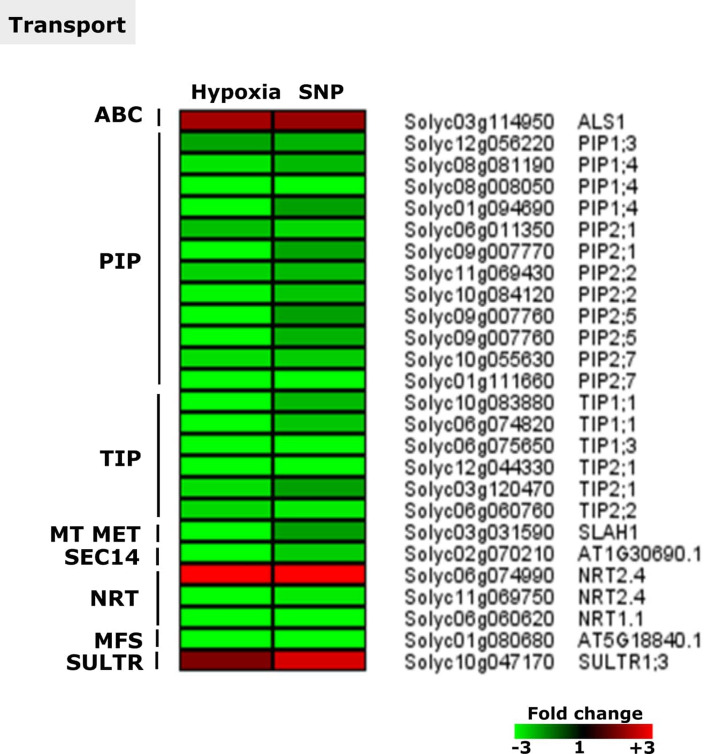
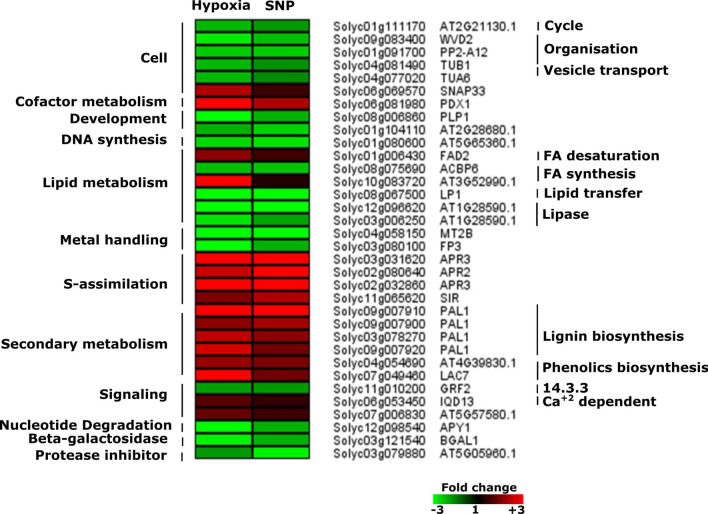
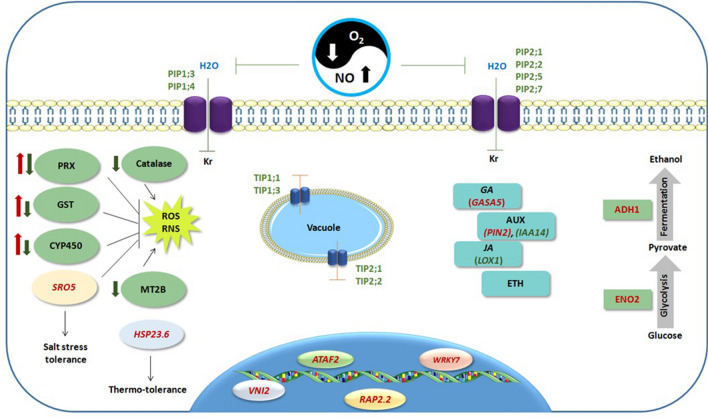
Flooding periods, as one probable consequence of climate change, will lead more frequently to plant hypoxic stress. Hypoxia sensing and signaling in the root, as the first organ encountering low oxygen, is therefore crucial for plant survival under flooding. Nitric oxide has been shown to be one of the main players involved in hypoxia signaling through the regulation of ERFVII transcription factors stability. Using SNP as NO donor, we investigated the NO-responsive genes, which showed a significant response to hypoxia. We identified 395 genes being differentially regulated under both hypoxia and SNP-treatment. Among them, 251 genes showed up- or down-regulation under both conditions which were used for further biological analysis. Functional classification of these genes showed that they belong to different biological categories such as primary carbon and nitrogen metabolism (e.g. glycolysis, fermentation, protein and amino acid metabolism), nutrient and metabolites transport, redox homeostasis, hormone metabolism, regulation of transcription as well as response to biotic and abiotic stresses. Our data shed light on the NO-mediated gene expression modulation under hypoxia and provides potential targets playing a role in hypoxia tolerance. These genes are interesting candidates for further investigating their role in hypoxia signaling and survival.


Conflict of interest statement

The authors declare no competing interests.

Figures

Figure 1
Figure 1
Fresh weight, dry weight and relative chlorophyll content of tomato plants in response to hypoxia and SNP-treatment. (a) Fresh weight; (b) dry weight and (c) water content (%) of 5 weeks old tomato roots after 48 h hypoxia and 48 h SNP-treatment were compared to their representative control. (d) Relative chlorophyll contents in leaf #3 of plants under hypoxia and SNP-treatment in comparison to their respective control are shown as SPAD values. Data represent means ± SD; n = 3; *significant differences (Student’s t test, *P < 0.05).
Figure 2
Figure 2
Venn diagram of common differentially expressed genes (DEGs) (Padj < 0.05) under both hypoxia and SNP-treatment. Red and green arrows represent down- and up-regulated genes, respectively. Boxes containing double green and double red arrows indicates number of down (154)- and up-regulated (97) DEGs under both hypoxia and SNP-treatments. The box containing both red and green arrows indicates the number of DEGs (144) with opposite regulation in response to hypoxia and SNP-treatment.
Figure 3
Figure 3
GO terms associated with transcriptome modulation of tomato roots in response to hypoxia and SNP-treatment. Enriched GO terms (Padj < 0.05), describing molecular function, biological process and cellular compartment. The regulated genes in all samples were analyzed for enriched GO terms using online tool PANTHER 14.0 and Solanum lycopersicum as a reference organism. The bars represent all significantly enriched GO terms associated with regulated genes in response to hypoxia and SNP-treatment.
Figure 4
Figure 4
Validation of RNA-Seq data using qPCR. Log2 fold change in expression of 17 differentially regulated genes (Padj < 0.05) using RNA-Seq and qPCR (r = 0.87). Fold-changes represent the expression changes of each gene in response to SNP-treatment relative to the untreated control (n = 3).
Figure 5
Figure 5
Transcriptional changes of genes related to different phytohormone categories. The heat map displays the up-regulated (red bars) or down-regulated (green bars) tomato genes and their Arabidopsis thaliana homologs in response to hypoxia and SNP-treatment. Depicted are differentially expressed genes (Padj < 0.05) (n = 3). ABA, abscisic acid; AUX, Auxin; BR, brassinosteroid; ETH, ethylene; GA: gibberellin; JA, jasmonate; 2OG, 2-oxoglutarate; ATB2, NAD(P)-LINKED OXIDUREDUCTASE-LIKE PROTEIN; IAA14, INDOLE-3-ACETIC ACID INDUCIBLE 14; AILP1, ALUMINIUM INDUCED PROTEIN WITH YGL AND LRDR MOTIFS; PIN2, PIN-FORMED 2; DLO1, DMR6-LIKE OXYGENASE 1; DLO2, DMR6-LIKE OXYGENASE 2; DMR6, DOWNY MILDEW RESISTANT 6; GASA5, GAST1 PROTEIN HOMOLOG 5; GASA6, GAST1 PROTEIN HOMOLOG 5; LOX1, LIPOXYGENASE 1.
Figure 6
Figure 6
Hypoxia and SNP-responsive genes encoding proteins involved in post-translational modification (PTM) and regulation of transcription (TFs). Heat map represents the up-regulated (red bars) or down-regulated (green bars) tomato genes and their Arabidopsis thaliana homologs in response to hypoxia and SNP-treatment. Depicted are differentially expressed genes (Padj < 0.05), (n = 3). CIPK11, CBL-INTERACTING PROTEIN KINASE 11; ATAF2 (NAC081), ARABIDOPSIS NAC DOMAIN CONTAINING PROTEIN 81; NOC083, ARABIDOPSIS NAC DOMAIN CONTAINING PROTEIN 83; RAP2.2, RELATED TO AP2 2; JAZ9, RELATED TO AP2 2; CDF1, CYCLING DOF FACTOR 1; REIL1, REI1-LIKE 1; MYB62, MYB DOMAIN PROTEIN 62; NFXL1, NF-X-LIKE 1; WRKY7, WRKY DNA-BINDING PROTEIN 7.
Figure 7
Figure 7
Hypoxia- and SNP-induced and repressed genes associated with primary metabolism. Heat maps display the up-regulated (red bars) or down-regulated (green bars) tomato genes and their Arabidopsis thaliana homologs. Depicted are differentially expressed genes (Padj < 0.05) (n = 3). ENO2, ENOLASE2; ADH1, ALCOHOL DEHYDROGENASE 1; CA1, CARBONIC ANHYDRASE 1; CA2, CARBONIC ANHYDRASE 2; SUS4, SUCROSE SYNTHASE 4; FB4, AUXIN SIGNALING F-BOX 4; GOX1, GLYCOLATE OXIDASE 1; ENODL16, EARLY NODULIN-LIKE PROTEIN 16; MTO3, METHIONINE OVER-ACCUMULATOR 3; ASP3, ASPARTATE AMINOTRANSFERASE 3; KRS.1, LYSYL-TRNA SYNTHETASE 1; BT1, BTB AND TAZ DOMAIN PROTEIN 1; UBP17, UBIQUITIN-SPECIFIC PROTEASE 17.
Figure 8
Figure 8
Expression pattern of genes encoding members of different antioxidant classes. Heat map represents the up-regulated (red bars) or down-regulated (green bars) tomato genes and their Arabidopsis thaliana homologs in response to hypoxia and SNP-treatment. Depicted are differentially expressed genes (Padj < 0.05), (n = 3). GST, GLUTATHIONE S-TRANSFERASE; CAT2, CATALASE 2; SDR5, SHORT-CHAIN DEHYDROGENASE REDUCTASE 5; PRX71, PEROXIDASE 71; PRX72, PEROXIDASE 72; PRX52, PEROXIDASE 52; PRX2, PEROXIDASE 2; PRX9, PEROXIDASE 9; PRX64, PEROXIDASE 64; RCI3, RARE COLD INDUCIBLE GENE 3; SKU5; encodes SKU5 protein; GSTU1 (GST19), GLUTATHIONE S-TRANSFERASE TAU 1 (GLUTATHIONE S-TRANSFERASE 19); GSTU8, GLUTATHIONE S-TRANSFERASE TAU 8; GSTU19 (GST8), GLUTATHIONE S-TRANSFERASE TAU 19 (GLUTATHIONE S-TRANSFERASE 8); GSTL3, encoding a member of glutathione S-transferase family protein; CYP716A1, CYTOCHROME P450, FAMILY 716, SUBFAMILY A, POLYPEPTIDE 1; CYP76C2, CYTOCHROME P450, FAMILY 76, SUBFAMILY C, POLYPEPTIDE 2; CYP72A14, CYTOCHROME P450, FAMILY 72, SUBFAMILY A, POLYPEPTIDE 14; CYP707A3, CYTOCHROME P450, FAMILY 707, SUBFAMILY A, POLYPEPTIDE 3.
Figure 9
Figure 9
Expression pattern of genes related to cellular transport. Heat map represents the up-regulated (red bars) or down-regulated (green bars) tomato genes and their Arabidopsis thaliana homologs in response to hypoxia and SNP-treatment. Depicted are differentially expressed genes (Padj < 0.05), (n = 3). ABC, ATP-binding cassette transporter; PIP, major intrinsic proteins; TIP, tonoplast intrinsic protein; MT MET, metabolite transporters at the mitochondrial membrane, SEC14, Sec14p-like phosphatidylinositol transfer family; NRT, nitrate transporter; MFS, major facilitator superfamily; SULTR, sulfur transporter. ALS1, ALUMINUM SENSITIVE 1; PIP1;3, PLASMA MEMBRANE INTRINSIC PROTEIN 1;3; PIP1;4, PLASMA MEMBRANE INTRINSIC PROTEIN 1;4; PIP2;1, PLASMA MEMBRANE INTRINSIC PROTEIN 2;1; PIP2;2, PLASMA MEMBRANE INTRINSIC PROTEIN 2;2; PIP2;5, PLASMA MEMBRANE INTRINSIC PROTEIN 2;5; PIP2;7, PLASMA MEMBRANE INTRINSIC PROTEIN 2;7; TIP1;1, TONOPLAST INTRINSIC PROTEIN 1;1; TIP1;3, TONOPLAST INTRINSIC PROTEIN 1;3; TIP2;1, TONOPLAST INTRINSIC PROTEIN 2;1; TIP2;2, TONOPLAST INTRINSIC PROTEIN 2;2; SLAH1, SLAC1 HOMOLOGUE 1; NRT2.4, NITRATE TRANSPORTER 2.4; NRT1.1, NITRATE TRANSPORTER 1.1; SULTR1.3, SULFATE TRANSPORTER 1.3.
Figure 10
Figure 10
Expression pattern of biotic and abiotic stress related genes. Heat map represents the up-regulated (red bars) or down-regulated (green bars) tomato genes and their Arabidopsis thaliana homologs in response to hypoxia and SNP-treatment. Depicted are differentially expressed genes (Padj < 0.05), (n = 3). SRO5, SIMILAR TO RCD ONE 5; HSP23.6, MITOCHONDRION-LOCALIZED SMALL HEAT SHOCK PROTEIN 23.6; ATJ3, DNAJ HOMOLOGUE 3; MLP34, MLP-LIKE PROTEIN 34; OSM34, OSMOTIN 34.
Figure 11
Figure 11
Expression pattern of regulated cell wall related genes. Heat map represents the up-regulated (red bars) or down-regulated (green bars) tomato genes and their Arabidopsis thaliana homologs in response to hypoxia and SNP-treatment. Depicted are differentially expressed genes (Padj < 0.05), (n = 3). UGT85A2, UDP-GLUCOSYL TRANSFERASE 85A2; UGT71B1, UDP-GLUCOSYL TRANSFERASE 71B1; UGT73C1, UDP-GLUCOSYL TRANSFERASE 73C1; UGT73B3, UDP-GLUCOSYL TRANSFERASE 73B3; CSLD3, CELLULOSE SYNTHASE LIKE D3; RD22, RESPONSIVE TO DESICCATION 22; EXPA6, EXPANSIN 6; XTH8, XYLOGLUCAN ENDOTRANSGLUCOSYLASE/HYDROLASE 8; XTH5, XYLOGLUCAN ENDOTRANSGLUCOSYLASE/HYDROLASE 5; XTH24, XYLOGLUCAN ENDOTRANSGLUCOSYLASE/HYDROLASE 24; EXPA3, EXPANSIN 3; MES3, METHYL ESTERASE 3.
Figure 12
Figure 12
Expression pattern of genes belonging to different biological categories. Heat map represents the up-regulated (red bars) or down-regulated (green bars) tomato genes and their Arabidopsis thaliana homologs in response to hypoxia and SNP-treatment. Depicted are differentially expressed genes (Padj < 0.05), (n = 3). WVD2, WAVE-DAMPENED 2; PP2-A12, PHLOEM PROTEIN 2-A12, TUB1, TUBULIN BETA-1 CHAIN; TUA6, TUBULIN ALPHA-6; SNAP33, SOLUBLE N-ETHYLMALEIMIDE-SENSITIVE FACTOR ADAPTOR PROTEIN 33; PDX1, PYRIDOXINE BIOSYNTHESIS 1; PLP1, PHOSPHOLIPASE 1; FAD2, FATTY ACID DESATURASE 2; ACBP6, ACYL-COA-BINDING PROTEIN; LP1, LIPID TRANSFER PROTEIN 1; MT2B, METALLOTHIONEIN 2B; FP3, FARNESYLATED PROTEIN 3; APR3, APS REDUCTASE 3; APR2, 5′ADENYLYLPHOSPHOSULFATE REDUCTASE 2; SIR, SULFITE REDUCTASE; PAL1, PHENYLALANINE AMMONIA-LYASE; LAC7, LACCASE 7; GRF2, GENERAL REGULATORY FACTOR 2; IQD13, IQ-DOMAIN 13; APY1, APYRASE 1; BGAL1, BETA GALACTOSIDASE 1.
Figure 13
Figure 13
A schematic model of the molecular response of tomato root to the yin and yang of oxygen and nitric oxide. Depicted are the genes belonging to different biological categories with identified or proposed roles in response to hypoxia and/or NO. Red and green font colors or arrows represent up- and down-regulation, respectively. ADH1, ALCOHOL DEHYDROGENASE 1; ENO2, ENOLASE 2; CA1, CARBONIC ANHYDRASE 1; CA2, CARBONIC ANHYDRASE 2; Kr: hydraulic conductivity, TIP, tonoplast intrinsic proteins; PIP, plasma membrane intrinsic proteins; PRX, peroxidase; GST, glutathione S-transferase; MT2B, METALLOTHIONEIN 2B;CYP450,cytochrome P-450; SRO5, SIMILAR TO RCD ONE 5; HSP23.6, HEAT SHOCK PROTEIN 23.6; ATAF2 (NAC081), ARABIDOPSIS NAC DOMAIN CONTAINING PROTEIN 81; WRKY7, WRKY DNA-BINDING PROTEIN 7; VNI2 (NAC083), VND-INTERACTING 2; RAP2.2, RELATED TO AP2 2; GASA5, GAST1 PROTEIN HOMOLOG 5; PIN2, PIN-FORMED 2; IAA14, INDOLE-3-ACETIC ACID INDUCIBLE 14; LOX1, LIPOXYGENASE 1; GA, gibberellic acid; AUX, auxin; JA, jasmonic acid; ETH, ethylene.

Similar articles

Cited by

References

    1. Seligman K, Saviani EE, Oliveira HC, Pinto-Maglio CA, Salgado I. Floral transition and nitric oxide emission during flower development in Arabidopsis thaliana is affected in nitrate reductase-deficient plants. Plant Cell Physiol.. 2008;49:1112–1121. doi: 10.1093/pcp/pcn089. - DOI - PubMed
    1. Kolbert Z, Bartha B, Erdei L. Exogenous auxin-induced NO synthesis is nitrate reductase-associated in Arabidopsis thaliana root primordia. J. Plant. Physiol. 2008;165:967–975. doi: 10.1016/j.jplph.2007.07.019. - DOI - PubMed
    1. Takahashi M, et al. Nitrogen dioxide regulates organ growth by controlling cell proliferation and enlargement in Arabidopsis. New Phytol. 2014;201:1304–1315. doi: 10.1111/nph.12609. - DOI - PubMed
    1. Mishina TE, Lamb C, Zeier J. Expression of a nitric oxide degrading enzyme induces a senescence programme in Arabidopsis. Plant Cell Environ. 2007;30:39–52. doi: 10.1111/j.1365-3040.2006.01604.x. - DOI - PubMed
    1. Song L, Ding W, Zhao M, Sun B, Zhang L. Nitric oxide protects against oxidative stress under heat stress in the calluses from two ecotypes of reed. Plant Sci. 2006;171:449–458. doi: 10.1016/j.plantsci.2006.05.002. - DOI - PubMed

Publication types

MeSH terms