

Disentangling the determinants of transposable elements dynamics in vertebrate genomes using empirical evidences and simulations
- PMID: 33017388
- PMCID: PMC7561263
- DOI: 10.1371/journal.pgen.1009082
Disentangling the determinants of transposable elements dynamics in vertebrate genomes using empirical evidences and simulations
Abstract
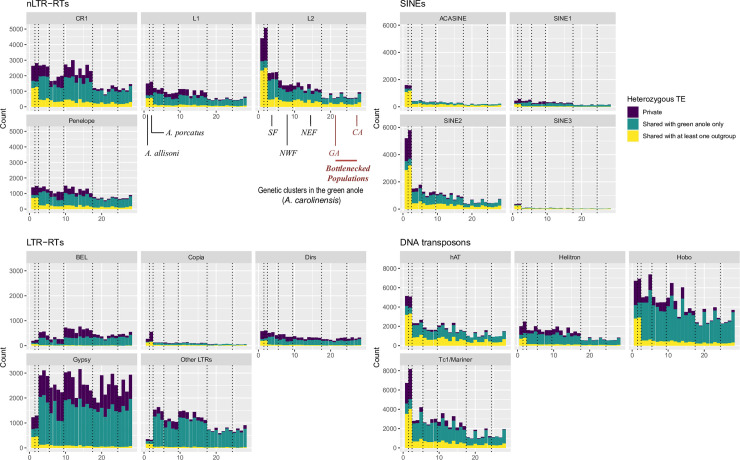
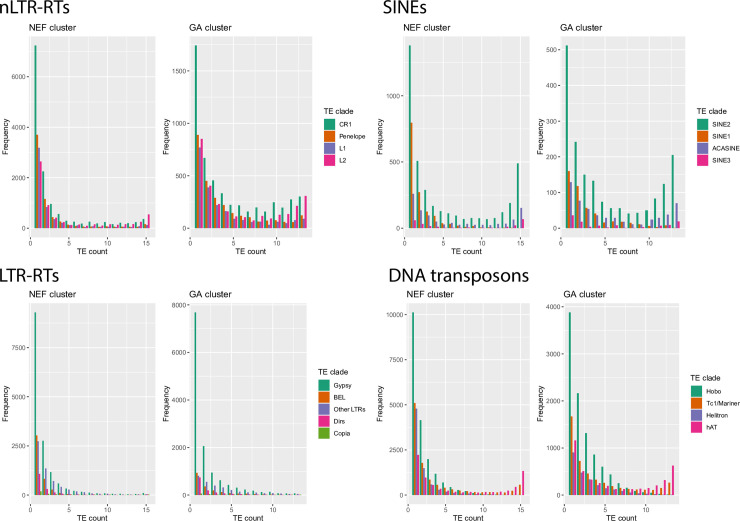
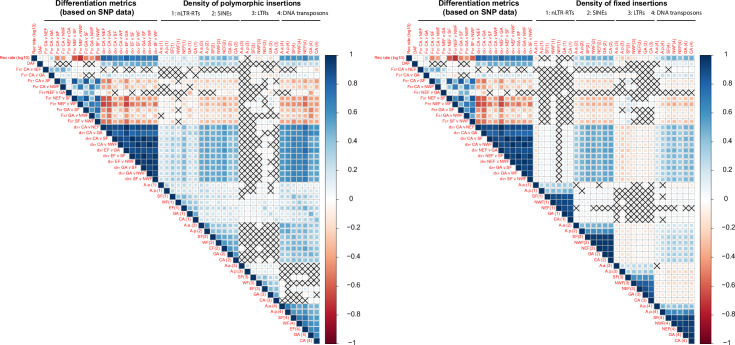
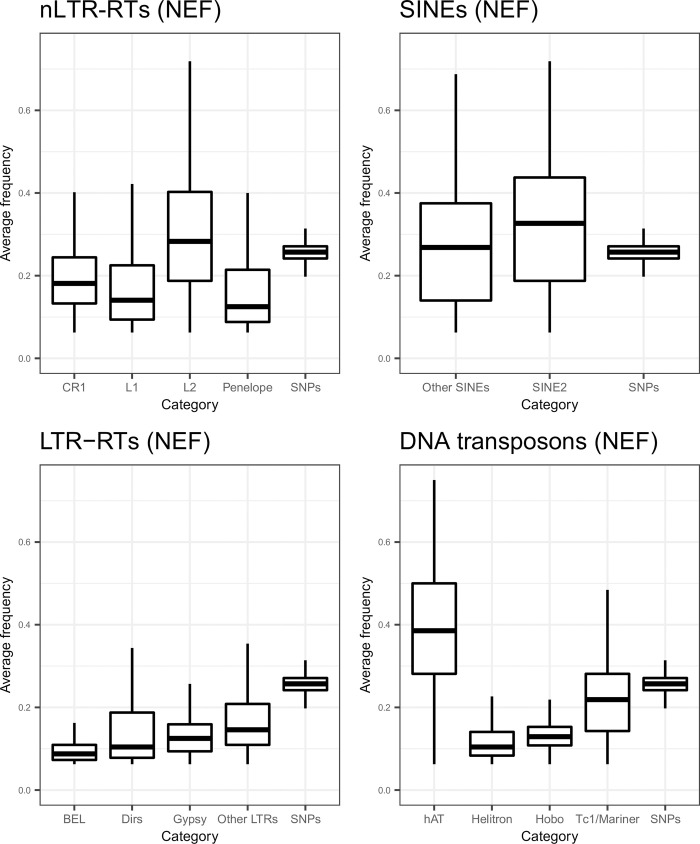
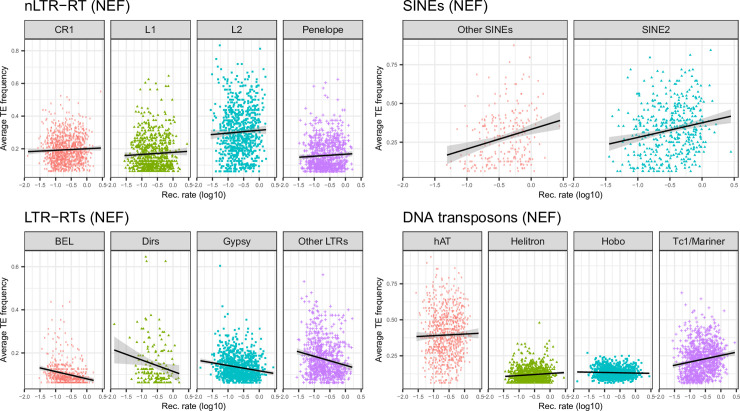
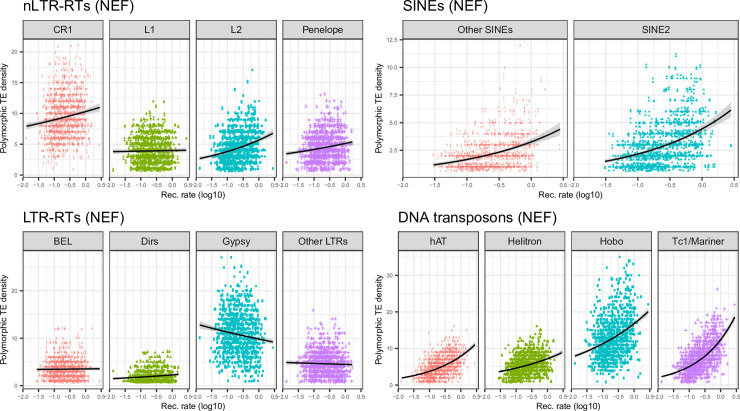
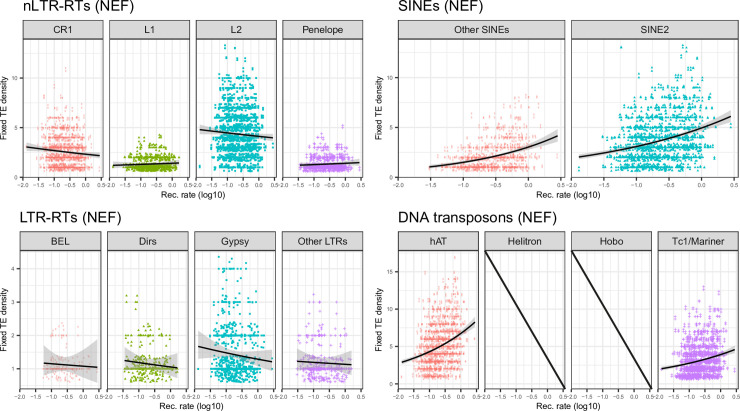
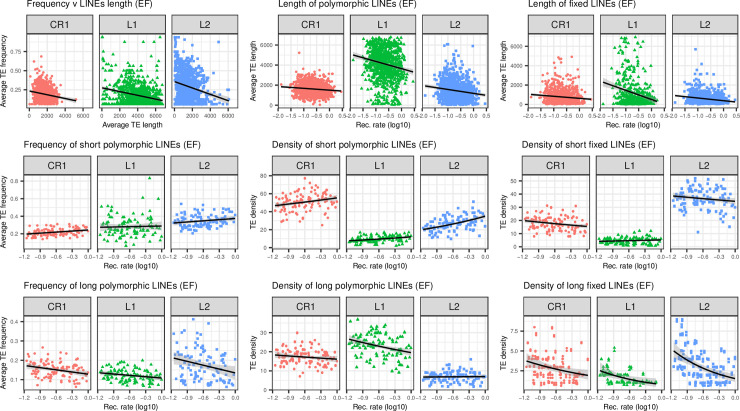
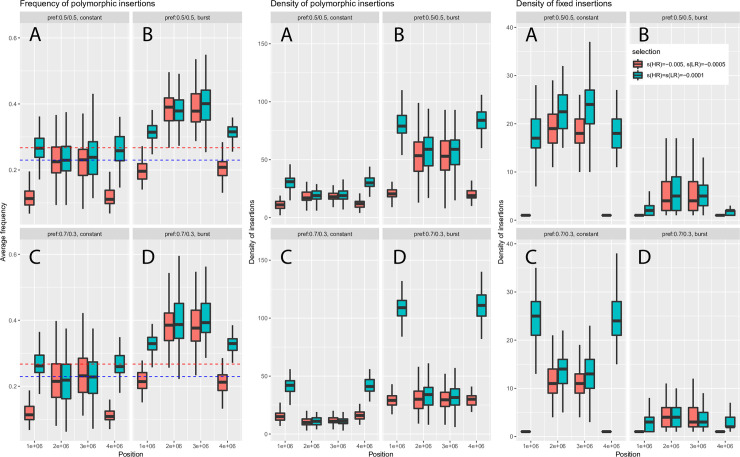
The interactions between transposable elements (TEs) and their hosts constitute one of the most profound co-evolutionary processes found in nature. The population dynamics of TEs depends on factors specific to each TE families, such as the rate of transposition and insertional preference, the demographic history of the host and the genomic landscape. How these factors interact has yet to be investigated holistically. Here we are addressing this question in the green anole (Anolis carolinensis) whose genome contains an extraordinary diversity of TEs (including non-LTR retrotransposons, SINEs, LTR-retrotransposons and DNA transposons). We observed a positive correlation between recombination rate and frequency of TEs and densities for LINEs, SINEs and DNA transposons. For these elements, there was a clear impact of demography on TE frequency and abundance, with a loss of polymorphic elements and skewed frequency spectra in recently expanded populations. On the other hand, some LTR-retrotransposons displayed patterns consistent with a very recent phase of intense amplification. To determine how demography, genomic features and intrinsic properties of TEs interact we ran simulations using SLiM3. We determined that i) short TE insertions are not strongly counter-selected, but long ones are, ii) neutral demographic processes, linked selection and preferential insertion may explain positive correlations between average TE frequency and recombination, iii) TE insertions are unlikely to have been massively recruited in recent adaptation. We demonstrate that deterministic and stochastic processes have different effects on categories of TEs and that a combination of empirical analyses and simulations can disentangle these mechanisms.
Conflict of interest statement
The authors have declared that no competing interests exist.
Figures
Similar articles
-
Genome-wide characterization of nonreference transposons reveals evolutionary propensities of transposons in soybean.Plant Cell. 2012 Nov;24(11):4422-36. doi: 10.1105/tpc.112.103630. Epub 2012 Nov 21. Plant Cell. 2012. PMID: 23175746 Free PMC article.
-
Lizards and LINEs: selection and demography affect the fate of L1 retrotransposons in the genome of the green anole (Anolis carolinensis).Genome Biol Evol. 2013;5(9):1754-68. doi: 10.1093/gbe/evt133. Genome Biol Evol. 2013. PMID: 24013105 Free PMC article.
-
Comparative analysis of transposable elements highlights mobilome diversity and evolution in vertebrates.Genome Biol Evol. 2015 Jan 9;7(2):567-80. doi: 10.1093/gbe/evv005. Genome Biol Evol. 2015. PMID: 25577199 Free PMC article.
-
Mammalian transposable elements and their impacts on genome evolution.Chromosome Res. 2018 Mar;26(1-2):25-43. doi: 10.1007/s10577-017-9570-z. Epub 2018 Feb 1. Chromosome Res. 2018. PMID: 29392473 Free PMC article. Review.
-
Becoming a Selfish Clan: Recombination Associated to Reverse-Transcription in LTR Retrotransposons.Genome Biol Evol. 2019 Dec 1;11(12):3382-3392. doi: 10.1093/gbe/evz255. Genome Biol Evol. 2019. PMID: 31755923 Free PMC article. Review.
Cited by
-
The Structural, Functional and Evolutionary Impact of Transposable Elements in Eukaryotes.Genes (Basel). 2021 Jun 15;12(6):918. doi: 10.3390/genes12060918. Genes (Basel). 2021. PMID: 34203645 Free PMC article. Review.
-
Controlling for Variable Transposition Rate with an Age-Adjusted Site Frequency Spectrum.Genome Biol Evol. 2022 Feb 4;14(2):evac016. doi: 10.1093/gbe/evac016. Genome Biol Evol. 2022. PMID: 35104327 Free PMC article.
-
The evolution of transposable elements in Brachypodium distachyon is governed by purifying selection, while neutral and adaptive processes play a minor role.Elife. 2024 Apr 12;12:RP93284. doi: 10.7554/eLife.93284. Elife. 2024. PMID: 38606833 Free PMC article.
-
On the Base Composition of Transposable Elements.Int J Mol Sci. 2022 Apr 26;23(9):4755. doi: 10.3390/ijms23094755. Int J Mol Sci. 2022. PMID: 35563146 Free PMC article. Review.
-
Differential Conservation and Loss of CR1 Retrotransposons in Squamates Reveals Lineage-Specific Genome Dynamics across Reptiles.bioRxiv [Preprint]. 2024 Feb 12:2024.02.09.579686. doi: 10.1101/2024.02.09.579686. bioRxiv. 2024. Update in: Genome Biol Evol. 2024 Aug 5;16(8):evae157. doi: 10.1093/gbe/evae157. PMID: 38405926 Free PMC article. Updated. Preprint.
References
Publication types
MeSH terms
Substances
Associated data
Grants and funding
LinkOut - more resources
Full Text Sources
Miscellaneous
