. 2020 Nov 2;130(11):5951-5966.
doi: 10.1172/JCI130445.

Inhibition of the ATM/Chk2 axis promotes cGAS/STING signaling in ARID1A-deficient tumors

Affiliations

Inhibition of the ATM/Chk2 axis promotes cGAS/STING signaling in ARID1A-deficient tumors

Lulu Wang et al. J Clin Invest. .

Abstract

ARID1A, a component of the chromatin-remodeling complex SWI/SNF, is one of the most frequently mutated genes in human cancer. We sought to develop rational combination therapy to potentiate the efficacy of immune checkpoint blockade in ARID1A-deficient tumors. In a proteomic analysis of a data set from The Cancer Genomic Atlas, we found enhanced expression of Chk2, a DNA damage checkpoint kinase, in ARID1A-mutated/deficient tumors. Surprisingly, we found that ARID1A targets the nonchromatin substrate Chk2 for ubiquitination. Loss of ARID1A increased the Chk2 level through modulating autoubiquitination of the E3-ligase RNF8 and thereby reducing RNF8-mediated Chk2 degradation. Inhibition of the ATM/Chk2 DNA damage checkpoint axis led to replication stress and accumulation of cytosolic DNA, which subsequently activated the DNA sensor STING-mediated innate immune response in ARID1A-deficient tumors. As expected, tumors with mutation or low expression of both ARID1A and ATM/Chk2 exhibited increased tumor-infiltrating lymphocytes and were associated with longer patient survival. Notably, an ATM inhibitor selectively potentiated the efficacy of immune checkpoint blockade in ARID1A-depleted tumors but not in WT tumors. Together, these results suggest that ARID1A's targeting of the nonchromatin substrate Chk2 for ubiquitination makes it possible to selectively modulate cancer cell-intrinsic innate immunity to enhance the antitumor activity of immune checkpoint blockade.

Keywords: Cancer; Cancer immunotherapy; Cell Biology; Immunology.


Conflict of interest statement

Conflict of interest: GBM has received sponsored research support from Nanostring Center of Excellence, Ionis (provision of tool compounds) and clinical trials support from AstraZeneca, Genentech, GSK, and Eli Lilly; he has ownership interest in Catena Pharmaceuticals, ImmunoMet, SignalChem, and Tarveda; he is a consultant/advisory board member of AstraZeneca, Chrysallis Biotechnology, ImmunoMet, Ionis, Lilly,PDX Pharmaceuticals, SignalChem Lifesciences, Symphogen, Tarveda, Turbine, and Zentalis Pharmaceuticals; he has licensed technology for a homologous recombination deficiency assay to Myriad Genetics and for digital spatial profiling to Nanostring. TAY has received sponsored research support from AstraZeneca, Bayer, Clovis, Constellation, Cyteir, Eli Lilly, EMD Serono, Forbius/Formation Biologics, F-Star, GlaxoSmithKline, Genentech, ImmuneSensor, Ipsen, Jounce, Karyopharm, Kyowa, Novartis, Pfizer, Ribon Therapeutics, Regeneron, Sanofi, Seattle Genetics, Tesaro, and Vertex Pharmaceuticals; he is a consultant/advisory board member of Almac, Aduro, AstraZeneca, Atrin, Axiom, Bayer, Calithera, Clovis, Cybrexa, EMD Serono, F-Star, Guidepoint, Ignyta, I-Mab, Jansen, Kyn Therapeutics, Merck, Pfizer, Roche, Seattle Genetics, and Zai Labs. GP has received sponsored research support from Pfizer.

Figures

Figure 1
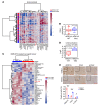
Figure 1. Chk2 signaling is enhanced in tumors with mutant ARID1A or low expression of ARID1A.
(A) Heatmap representing expression profiles of the 31 proteins most differentially expressed between ARID1A-WT and ARID1A-mutant (ARID1A-Mut) endometrioid carcinomas from patients. P < 0.05 (n = 187). (B) Chk2 protein levels in ARID1A-WT and ARID1A-Mut endometrioid carcinomas from patients. P < 0.01 (n = 187). (C) Heatmap representing RPPA expression profiles of the 45 proteins most differentially expressed between HCT116-WT (n = 6) and HCT116–ARID1A-KO (HCT116-KO) (n = 5) xenograft tumors treated with PARP inhibitor BMN 673. P < 0.05. (D) p-Chk2 (Thr68) protein levels in HCT116-WT (n = 6) and HC116–ARID1A-Mut (n = 5) xenograft tumors treated with BMN 673. P < 0.05. (E) Top, representative images of IHC staining of ARID1A, Chk2, and p-Chk2 in ovarian clear cell carcinoma patient specimens (n = 8). Scale bar: 200 μm. Bottom, quantitative results represent the mean ± SD. *P < 0.05; ***P < 0.001. Two-tailed unpaired Student’s t test (AE).
Figure 2
Figure 2. ARID1A regulates E3-ligase RNF8-mediated Chk2 ubiquitination.
(A) Left, Western blots of ARID1A and Chk2 in ARID1A-WT (HOC8 and FUOV1) and -mutant (OAW42 and EF027) ovarian cancer cells. Right, quantitative results represent the mean ± SD from 3 independent experiments. (B) Left, Western blots of ARID1A induction by doxycycline (Dox, 2 μg/mL, 3 days) in ARID1A-null OAW42 cells. Right, quantitative results represent the mean ± SD from 3 independent experiments. (C) Left, Western blots of p-Chk2 (T68) induction by ionizing radiation (IR) (10 Gy) in ARID1A-WT (HOC8 and FUOV1) and -mutant (OAW42 and EF027) ovarian cancer cells. Right, quantitative results represent the mean ± SD from 3 independent experiments. (D) Immunoblot (IB) of U2OS cells transfected with indicated plasmid and siRNA, SFB-tagged (S-tag, Flag epitope tag, and streptavidin-binding peptide tag) Chk2 (SFB-Chk2), si-Nontarget, or siRNA targeting ARID1A along with His-ubiquitin (His-Ub) constructs; Ni–nitrilotriacetic acid (Ni-NTA), nickel bead precipitate. IB, FLAG (immunoblotting by anti-FLAG antibody). (E) Immunoblot of U2OS cells transfected with indicated plasmid and siRNA, SFB-RNF8, si-Nontarget, or siRNA targeting ARID1A along with His-Ub constructs. IB, FLAG. (F) Immunoblot of U2OS cells transfected with indicated plasmid and siRNA, SFB-RNF8, SFB-RNF8 RING domain depletion (ΔRING), si-Nontarget, or siRNA targeting ARID1A along with His-Ub constructs. IB, FLAG. (G) Immunoprecipitation (IP) of SFB-RNF8 with Myc-Chk2 in U2OS cells with si-Nontarget or siRNA targeting ARID1A. (H) Left, coimmunoprecipitation (Co-IP) of endogenous RNF8 and Chk2 in HCT116-WT and ARID1A-KO (HCT116-KO) cells. Right, quantitative analysis from normalization of Chk2 bound by RNF8 represent the mean ± SD from 3 independent experiments. One-way ANOVA with Holm-Šidák’s multiple comparisons test (A and C); 2-tailed unpaired Student’s t test (B and H). **P < 0.01; ***P < 0.001; ****P < 0.0001.
Figure 3
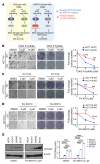
Figure 3. Inhibition of the ATM/Chk2 axis selectively inhibits ARDI1A-deficient cancer cell growth.
(A) Schematic diagram of DNA damage response signaling in ARID1A-WT and ARID1A-deficient cells. (BD) ARID1A-WT and ARID1A-KO HCT116 cells treated with the Chk2 inhibitors II hydrate (B) and PV1019 (C) and the ATM inhibitor KU-60019 (D) at indicated concentrations. Clonogenic assays were performed. Left, representative images of 3D culture. Scale bar: 100 μm. Middle, representative images of colony formation. Right, quantitative results represent the mean ± SD from 3 independent experiments from colony formation. **P < 0.01; ***P < 0.001; ****P < 0.0001 by 2-tailed unpaired Student’s t test. (E) Expression of the basal level of CDC25A in ARID1A-WT (HOC8 and FUOV1) and -mutant (OAW42 and EF027) ovarian cancer cells. Left, cells were treated with ATM inhibitor KU-60019 for 48 hours and the whole-cell lysis was subjected to Western blot analysis. Right, quantitative results represent the mean ± SD from 3 independent experiments. ****P < 0.0001 by 1-way ANOVA with Holm-Šidák’s multiple comparisons test.
Figure 4
Figure 4. Inhibition of the ATM/Chk2 axis selectively enhances replication stress in ARID1A-deficient cancer cells.
(A and B) Left, representative images of DNA fiber assay in control (sh-Luc) and ARID1A-depleted (sh-ARID1A#1 and #2) HOC8 cells treated with PV1019 (A) and KU-60019 (B) at indicated concentrations. Middle, quantitative results represent the mean ± SD from 3 independent experiments. **P < 0.01; ***P < 0.001; ****P < 0.0001 by 1-way ANOVA with Dunnett’s multiple comparisons test. Right, Western blots indicate effective ARID1A knockdown. (C) Analysis of homologous recombination (HR) efficiency with the DR-green fluorescent protein (GFP) assay. Left, representative flow cytometry profiles. Right, values are normalized to the percentage of GFP-positive cells in I-SceI–transfected cells without treatment and represent the mean ± SD of 3 independent experiments. ****P < 0.0001 1-way ANOVA with Holm-Šidák’s multiple comparisons test.
Figure 5
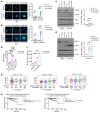
Figure 5. Inhibition of the ATM/Chk2 axis stimulates cytosolic DNA accumulation and promotes immune responsiveness in ARID1A-deficient tumors.
(A and B) Left, representative images of PicoGreen staining in control (sh-Luc) and Arid1a-depleted (sh-Arid1a#1 and #2) ID8 cells treated with DMSO, PV1019 (2 μM) (A), or KU-60019 (2 μM) (B) for 48 hours. DAPI (blue) was used to visualize the nuclei. Scale bar: 10 μm. Right, quantitative results represent the mean ± SD of 3 independent experiments. ***P < 0.001; ****P < 0.0001. (C and D) Left, Western blots of phosphorylated TBK1 (p-TBK1) and total TBK1 (TBK1) in ID8 cells treated with PV1019 (C) or KU-60019 (D) for 48 hours. Right, quantitative data represent the mean ± SD from 3 independent experiments. *P < 0.05; **P < 0.01, ***P < 0.001. (E) qPCR analysis of Ccl5 mRNA expression in ARID1A knockdown ID8 cells under DMSO, KU-60019, or PV1019 treatment. Data represent mean ± SD of 3 independent experiments. ****P < 0.0001. (F) ELISA quantification of mouse CCL5 level in ARID1A knockdown ID8 cells treated with DMSO or KU-60019. Data represent mean ± SD of 3 independent experiments. ****P < 0.0001. (G) Association of TILs with mutation and expression of ARID1A, ATM, and CHK2 in UCEC patient samples as analyzed by TIL signatures. The box plot represents median and quantiles of the data. UCEC mutation data set: n = 242, ARID1A/ATM WT/WT vs. Mut/Mut, P = 0.0271; UCEC expression data set: n = 567, ARID1A/ATM high/high vs. low/low, P = 0.000642; ARID1A/CHK2 high/high vs. low/low, P = 0.023. (H) Survival analysis for UCEC patients with ARID1A, ATM, and CHK2 mutation (Mut). Left, comutation of ARID1A and ATM. Right, comutation of ARID1A and CHK2. UCEC (n = 239): ARID1A/ATM Mut (n = 19) vs. ARID1A Mut (n = 63), P < 0.0001; ARID1A/CHK2 Mut (n = 9) vs. ARID1A Mut (n = 74), P = 0.5441. One-way ANOVA with Dunnett’s multiple comparisons test (AD); 1-way ANOVA with Holm-Šidák’s multiple comparisons test (E and F); 2-tailed unpaired Student’s t test (G and H).
Figure 6
Figure 6. ATM inhibition enhances the therapeutic efficacy of ICB in ARID1A-deficient tumors.
(A) Schematic of isotype control IgG, KU-60019, and anti–PD-L1 antibody treatment. Treatments were started on day 5 after inoculation and stopped on day 32. (B) Representative images for bioluminescence of mice with i.p. ID8 tumors on day 7 and day 26. Left, parental ID8 tumors. Right, ARID1A-depleted (sgRNA) ID8 i.p. tumors. (C) Endpoint of bioluminescence in mice bearing parental and ARID1A-depleted (sgRNA) ID8 i.p. tumors. Parental: IgG vs. anti–PD-L1, not significant; IgG vs. combination, not significant. sgRNA: IgG vs. anti–PD-L1, P = 0.097; IgG vs. combination, P = 0.014. Data represent mean ± SD (n = 3–5). (D) Survival curves of mice with ID8 i.p. tumors. Top, parental ID8 tumors. Bottom, ARID1A-depleted (sgRNA) ID8 tumors. Parental: anti–PD-L1 vs. combination, not significant; sgRNA: anti–PD-L1 vs. combination, P = 0.0069. (E) Top, CD8 and PD-L1 fluorescence-based IHC staining in parental and ARID1A-depleted ID8 i.p. tumors (n = 3 or 4). Bottom, quantitative analysis represent mean  ±  SD with indicated P value. +, positive. Scale bar: 50 μm. Two-tailed unpaired Student’s t test (C and E); log-rank (Mantel-Cox) test (D).

Similar articles

Cited by

References

    1. Hodges C, Kirkland JG, Crabtree GR. The many roles of BAF (mSWI/SNF) and PBAF complexes in cancer. Cold Spring Harb Perspect Med. 2016;6(8):a026930. doi: 10.1101/cshperspect.a026930. - DOI - PMC - PubMed
    1. Wu JN, Roberts CW. ARID1A mutations in cancer: another epigenetic tumor suppressor? Cancer Discov. 2013;3(1):35–43. doi: 10.1158/2159-8290.CD-12-0361. - DOI - PMC - PubMed
    1. Wiegand KC, et al. ARID1A mutations in endometriosis-associated ovarian carcinomas. N Engl J Med. 2010;363(16):1532–1543. doi: 10.1056/NEJMoa1008433. - DOI - PMC - PubMed
    1. Jones S, et al. Frequent mutations of chromatin remodeling gene ARID1A in ovarian clear cell carcinoma. Science. 2010;330(6001):228–231. doi: 10.1126/science.1196333. - DOI - PMC - PubMed
    1. Liang H, et al. Whole-exome sequencing combined with functional genomics reveals novel candidate driver cancer genes in endometrial cancer. Genome Res. 2012;22(11):2120–2129. doi: 10.1101/gr.137596.112. - DOI - PMC - PubMed

Publication types

MeSH terms