

Viruses Masquerading as Antibodies in Biosensors: The Development of the Virus BioResistor
- PMID: 33001632
- PMCID: PMC9126651
- DOI: 10.1021/acs.accounts.0c00474
Viruses Masquerading as Antibodies in Biosensors: The Development of the Virus BioResistor
Abstract
The 2018 Nobel Prize in Chemistry recognized in vitro evolution, including the development by George Smith and Gregory Winter of phage display, a technology for engineering the functional capabilities of antibodies into viruses. Such bacteriophages solve inherent problems with antibodies, including their high cost, thermal lability, and propensity to aggregate. While phage display accelerated the discovery of peptide and protein motifs for recognition and binding to proteins in a variety of applications, the development of biosensors using intact phage particles was largely unexplored in the early 2000s. Virus particles, 16.5 MDa in size and assembled from thousands of proteins, could not simply be substituted for antibodies in any existing biosensor architectures.Incorporating viruses into biosensors required us to answer several questions: What process will allow the incorporation of viruses into a functional bioaffinity layer? How can the binding of a protein disease marker to a virus particle be electrically transduced to produce a signal? Will the variable salt concentration of a bodily fluid interfere with electrical transduction? A completely new biosensor architecture and a new scheme for electrical transduction of the binding of molecules to viruses were required.This Account describes the highlights of a research program launched in 2006 that answered these questions. These efforts culminated in 2018 in the invention of a biosensor specifically designed to interface with virus particles: the Virus BioResistor (VBR). The VBR is a resistor consisting of a conductive polymer matrix in which M13 virus particles are entrained. The electrical impedance of this resistor, measured across 4 orders of magnitude in frequency, simultaneously measures the concentration of a target protein and the ionic conductivity of the medium in which the resistor is immersed. Large signal amplitudes coupled with the inherent simplicity of the VBR sensor design result in high signal-to-noise ratio (S/N > 100) and excellent sensor-to-sensor reproducibility. Using this new device, we have measured the urinary bladder cancer biomarker nucleic acid deglycase (DJ-1) in urine samples. This optimized VBR is characterized by extremely low sensor-to-sensor coefficients of variation in the range of 3-7% across the DJ-1 binding curve down to a limit of quantitation of 30 pM, encompassing 4 orders of magnitude in concentration.
Figures
Similar articles
-
Virus Bioresistor (VBR) for Detection of Bladder Cancer Marker DJ-1 in Urine at 10 pM in One Minute.Anal Chem. 2020 May 5;92(9):6654-6666. doi: 10.1021/acs.analchem.0c00534. Epub 2020 Apr 20. Anal Chem. 2020. PMID: 32252524 Free PMC article.
-
The Virus Bioresistor: Wiring Virus Particles for the Direct, Label-Free Detection of Target Proteins.Nano Lett. 2018 Jun 13;18(6):3623-3629. doi: 10.1021/acs.nanolett.8b00723. Epub 2018 May 9. Nano Lett. 2018. PMID: 29718676 Free PMC article.
-
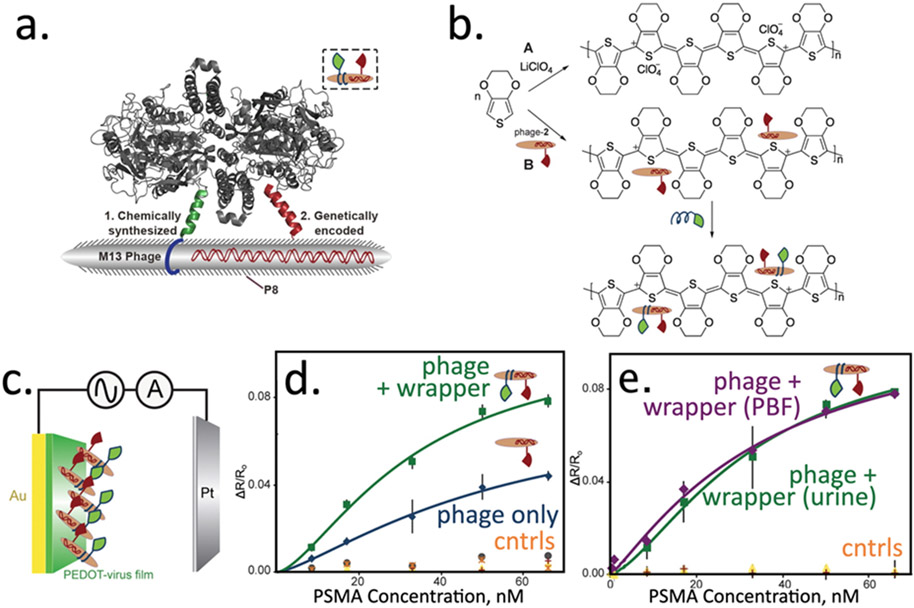
Virus-polymer hybrid nanowires tailored to detect prostate-specific membrane antigen.Anal Chem. 2012 Mar 20;84(6):2776-83. doi: 10.1021/ac203143y. Epub 2012 Mar 7. Anal Chem. 2012. PMID: 22339784 Free PMC article.
-
New directions in medical biosensors employing poly(3,4-ethylenedioxy thiophene) derivative-based electrodes.Anal Bioanal Chem. 2009 Oct;395(3):637-45. doi: 10.1007/s00216-009-2981-8. Epub 2009 Jul 31. Anal Bioanal Chem. 2009. PMID: 19644677 Review.
-
Phage Display in the Quest for New Selective Recognition Elements for Biosensors.ACS Omega. 2019 Jul 3;4(7):11569-11580. doi: 10.1021/acsomega.9b01206. eCollection 2019 Jul 31. ACS Omega. 2019. PMID: 31460264 Free PMC article. Review.
Cited by
-
Engineered M13 phage as a novel therapeutic bionanomaterial for clinical applications: From tissue regeneration to cancer therapy.Mater Today Bio. 2023 Mar 24;20:100612. doi: 10.1016/j.mtbio.2023.100612. eCollection 2023 Jun. Mater Today Bio. 2023. PMID: 37063776 Free PMC article. Review.
-
Beyond the Gut: The intratumoral microbiome's influence on tumorigenesis and treatment response.Cancer Commun (Lond). 2024 Oct;44(10):1130-1167. doi: 10.1002/cac2.12597. Epub 2024 Aug 1. Cancer Commun (Lond). 2024. PMID: 39087354 Free PMC article. Review.
-
Enhancing the Sensitivity of the Virus BioResistor by Overoxidation: Detecting IgG Antibodies.Anal Chem. 2021 Aug 17;93(32):11259-11267. doi: 10.1021/acs.analchem.1c02191. Epub 2021 Aug 4. Anal Chem. 2021. PMID: 34347442 Free PMC article.
-
Phage Display's Prospects for Early Diagnosis of Prostate Cancer.Viruses. 2024 Feb 10;16(2):277. doi: 10.3390/v16020277. Viruses. 2024. PMID: 38400052 Free PMC article. Review.
References
-
-
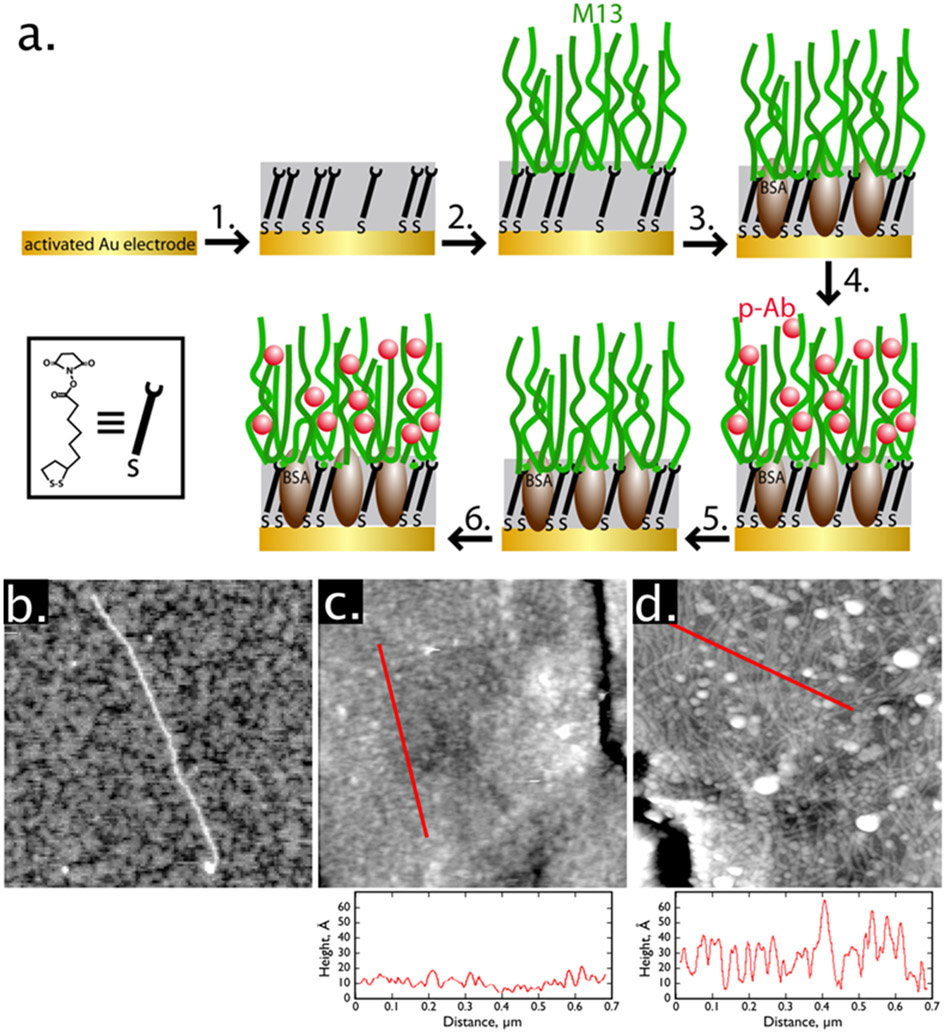
Yang LMC; Tam PY; Murray BJ; McIntire TM; Overstreet CM; Weiss GA; Penner RM Virus Electrodes for Universal Biodetection. Anal. Chem 2006, 78, 3265–3270.
Our first biosensor exploiting immobilized virus particles, instead of antibodies, as receptors.
-
-
-
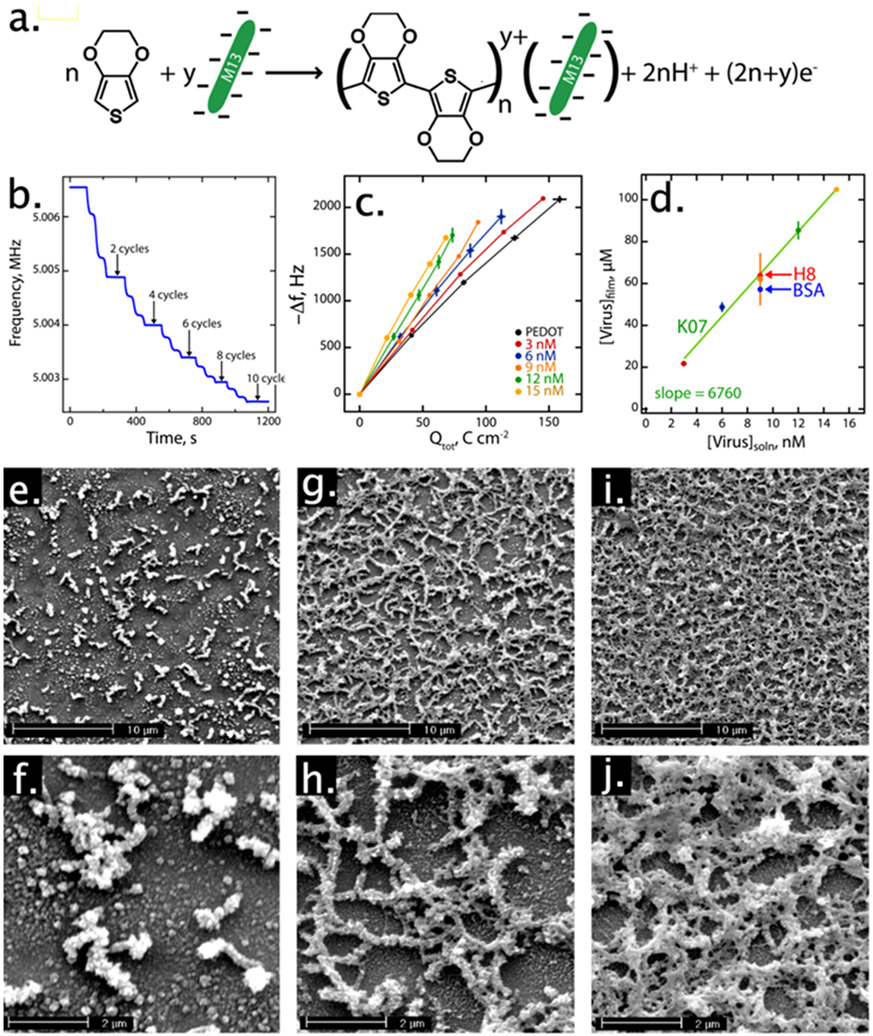
Donavan KC; Arter JA; Weiss GA; Penner RM Virus-Poly(3,4-Ethylenedioxythiophene) Biocomposite Films. Langmuir 2012, 28, 12581–12587.
First description and characterization of the electrodeposition of virus-PEDOT composite films.
-
-
-
Bhasin A; Ogata AF; Briggs JS; Tam PY; Tan MX; Weiss GA; Penner RM The Virus Bioresistor: Wiring Virus Particles for the Direct, Label-Free Detection of Target Proteins. Nano Lett. 2018, 18, 3623–3629.
The first paper describing the Virus BioResistor (VBR).
-
-
-
Bhasin A; Sanders EC; Ziegler JM; Briggs JS; Drago NP; Attar AM; Santos AM; True MY; Ogata AF; Yoon D V; et al. Virus Bioresistor (VBR) for Detection of Bladder Cancer Marker DJ-1 in Urine at 10 PM in One Minute. Anal. Chem 2020, 92, 6654–6666.
First demonstration of detection, at 10 pico-molar concentrations, of a cancer marker in human urine using the VBR.
-
-
- Smith GP; Petrenko VA Phage Display. Chem. Rev 1997, 97, 391–410. - PubMed
Publication types
MeSH terms
Substances
Grants and funding
LinkOut - more resources
Full Text Sources
