

Risk to human health related to the presence of perfluoroalkyl substances in food
- PMID: 32994824
- PMCID: PMC7507523
- DOI: 10.2903/j.efsa.2020.6223
Risk to human health related to the presence of perfluoroalkyl substances in food
Abstract
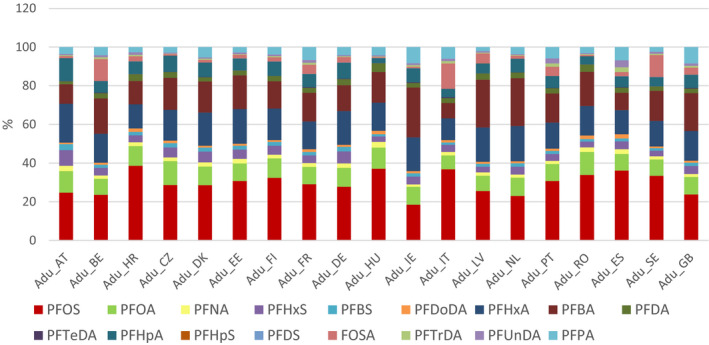
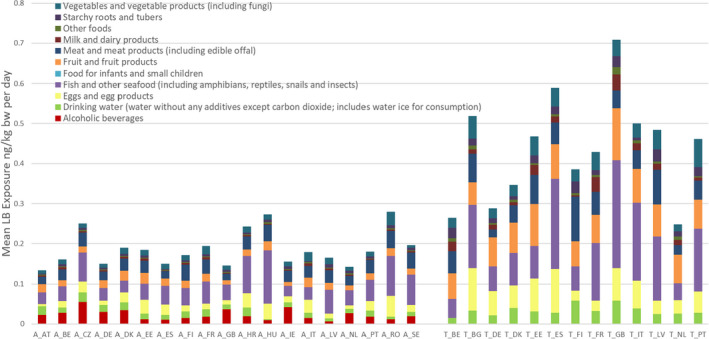
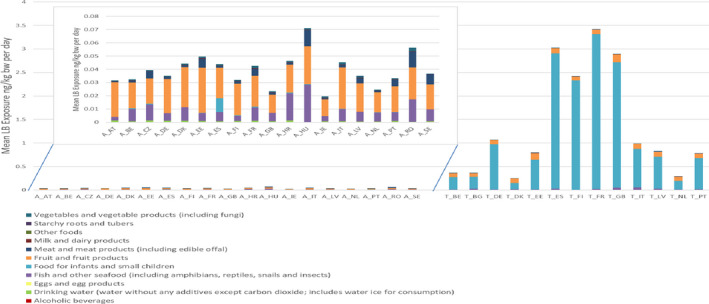
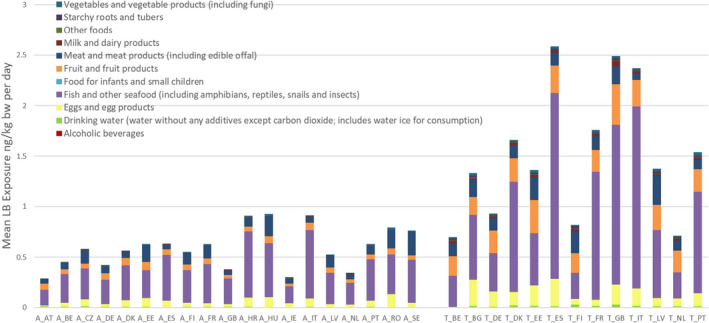
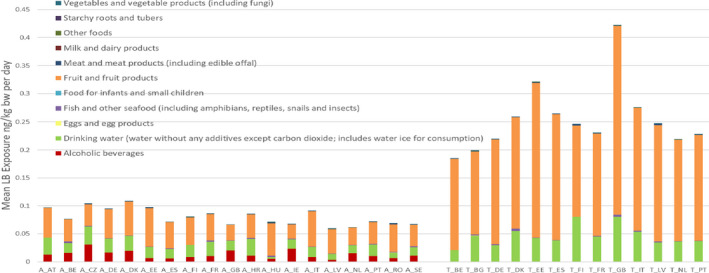
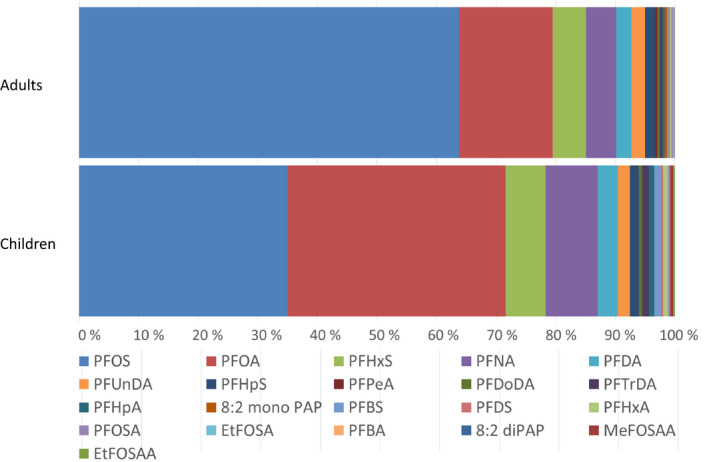
The European Commission asked EFSA for a scientific evaluation on the risks to human health related to the presence of perfluoroalkyl substances (PFASs) in food. Based on several similar effects in animals, toxicokinetics and observed concentrations in human blood, the CONTAM Panel decided to perform the assessment for the sum of four PFASs: PFOA, PFNA, PFHxS and PFOS. These made up half of the lower bound (LB) exposure to those PFASs with available occurrence data, the remaining contribution being primarily from PFASs with short half-lives. Equal potencies were assumed for the four PFASs included in the assessment. The mean LB exposure in adolescents and adult age groups ranged from 3 to 22, the 95th percentile from 9 to 70 ng/kg body weight (bw) per week. Toddlers and 'other children' showed a twofold higher exposure. Upper bound exposure was 4- to 49-fold higher than LB levels, but the latter were considered more reliable. 'Fish meat', 'Fruit and fruit products' and 'Eggs and egg products' contributed most to the exposure. Based on available studies in animals and humans, effects on the immune system were considered the most critical for the risk assessment. From a human study, a lowest BMDL 10 of 17.5 ng/mL for the sum of the four PFASs in serum was identified for 1-year-old children. Using PBPK modelling, this serum level of 17.5 ng/mL in children was estimated to correspond to long-term maternal exposure of 0.63 ng/kg bw per day. Since accumulation over time is important, a tolerable weekly intake (TWI) of 4.4 ng/kg bw per week was established. This TWI also protects against other potential adverse effects observed in humans. Based on the estimated LB exposure, but also reported serum levels, the CONTAM Panel concluded that parts of the European population exceed this TWI, which is of concern.
Keywords: PBPK; PFAS; exposure; food; immune system; mixtures; risk assessment.
© 2020 European Food Safety Authority. EFSA Journal published by John Wiley and Sons Ltd on behalf of European Food Safety Authority.
Figures
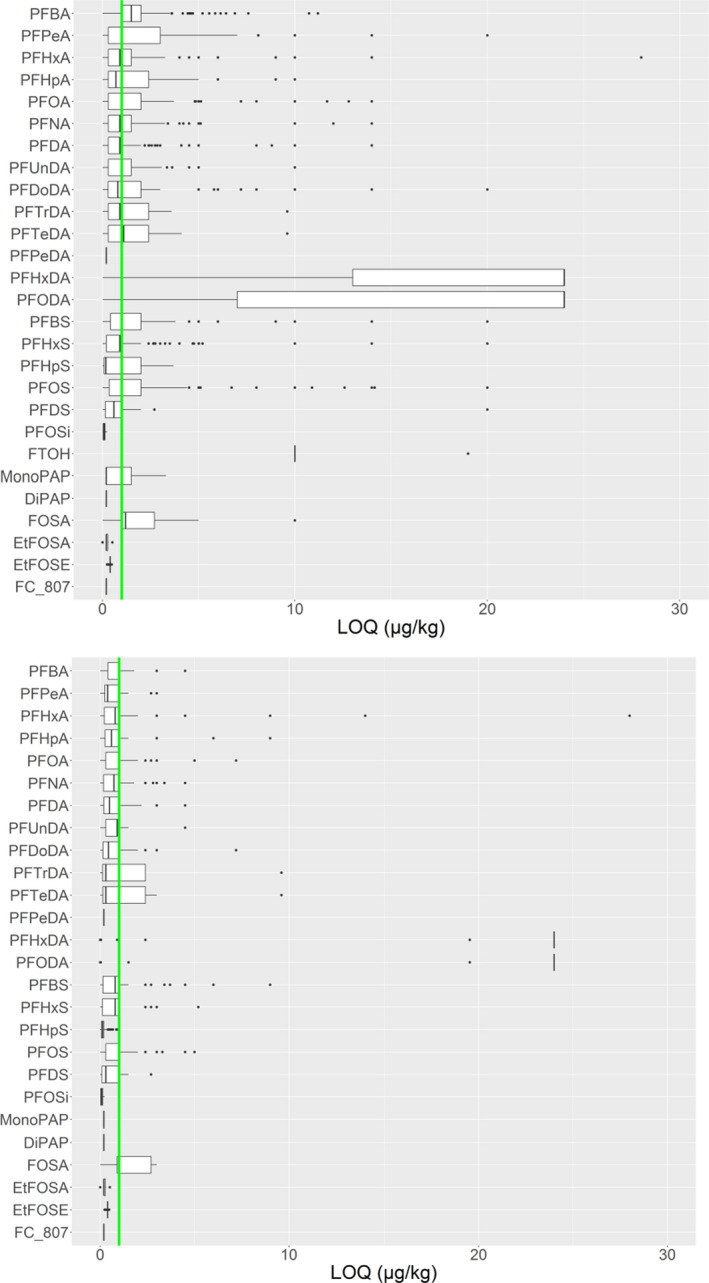
Box plot showing whiskers at minimum and maximum, box at P25 and P75 with line at P50, outliers shown as dots. The vertical green line shows the 1 μg/kg
LOQ cut‐off, applied to most foods categories except drinking water (0.01 μg/kg) and ‘Edible offal, game animals’ and ‘Fish offal’ (no cut‐off).
LB: lower bound; PFOA: perfluorooctanoic acid.
LB: lower bound; PFOA: perfluorooctanoic acid; PFNA: perfluorononanoic acid. Note: It should be stressed that the exposure from food for infants and small children was based on only one quantified level in 10 samples. This sample had a quantified
PFNA level above the mean in liver from farmed animals, andPFOS orPFOA were not detected in the same sample, which is unexpected.
LB: lower bound; PFOS: perfluoroheptane sulfonate.
LB: lower bound; PFHxS: perfluorohexane sulfonic acid.
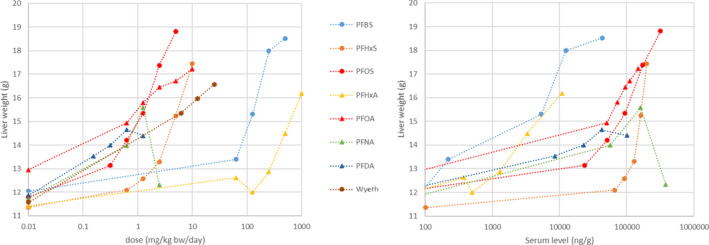
PFAS: perfluoroalkyl substance; PFBS: perfluorobutane sulfonic acid; PFOS: perfluoroheptane sulfonate. For
WY ‐14,643 serum levels were not determined. There is a clear shift in the order of the differentPFAS s; compare e.g.PFBS (blue dots) andPFOS (red dots).
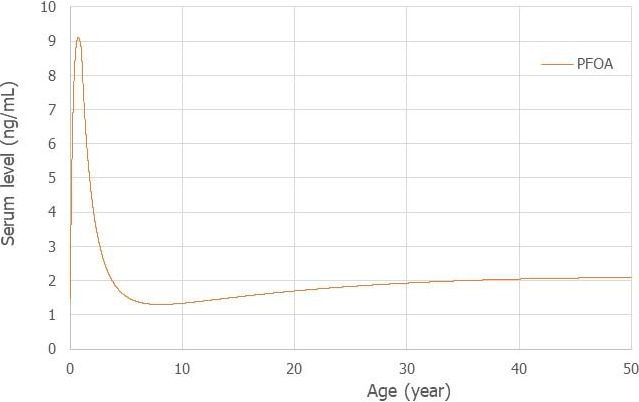
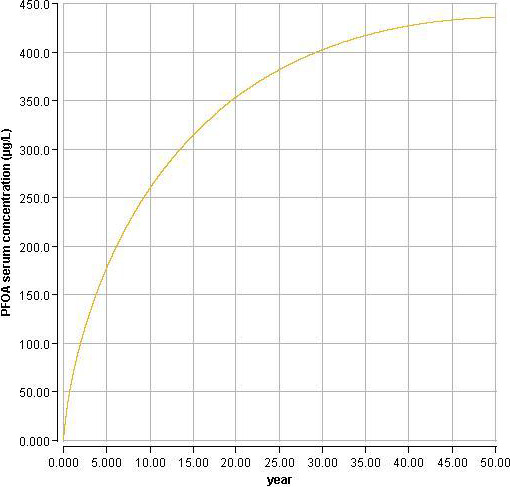
The level peaks at 9 months of breastfeeding around 9.1 ng/
mL , decreases and then increases to 2.0 ng/mL at 35 years and a steady state level at 50 years around 2.1 ng/mL .
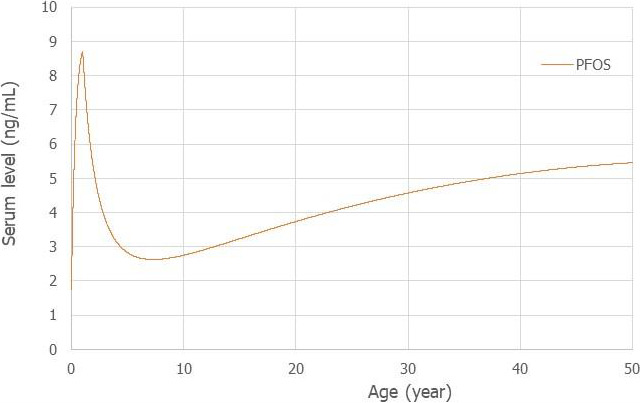
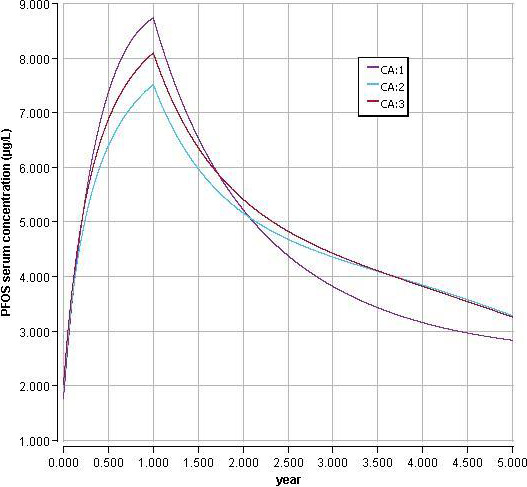
The level peaks at the end of breastfeeding around 8.7 ng/
mL , decreases and then increases to 4.9 ng/mL at 35 years and a steady state level at 50 years around 5.5 ng/mL .
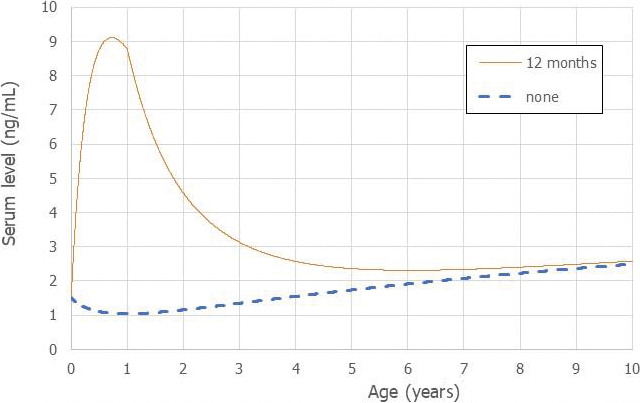
The level peaks at 9 months before the end of breastfeeding around 9.1 ng/
mL , decreases and then reaches levels of 8.8, 2.4 and 2.6 ng/mL at, respectively, 1, 5 and 10 years of age. Estimated levels ofPFOA in children who are not breastfed are also shown (none).
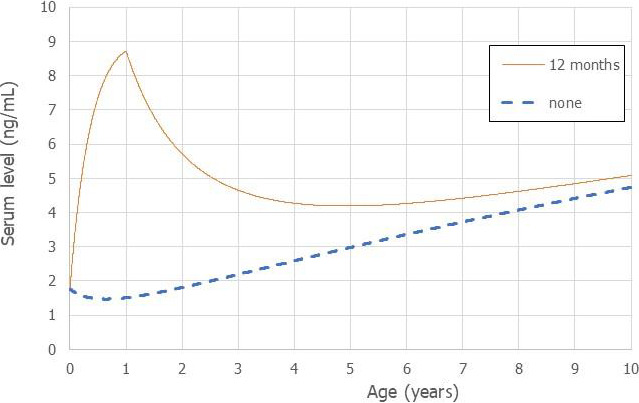
The level peaks at the end of breastfeeding around 8.7 ng/
mL , decreases and then reaches levels of 4.2 and 5.1 ng/mL at, respectively, 5 and 10 years of age. Estimated levels ofPFOS in children who are not breastfed are also shown (none).
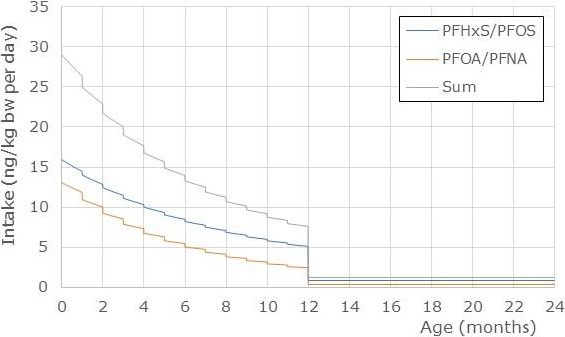
Exposure from food during the second year was 0.374 and 0.888 ng/kg bw per day for
PFOA /PFNA andPFH xS/PFOS , respectively, being twice that of the mothers. Serum levels of the mother at 35 years were 2.00 and 4.89 ng/mL forPFOA /PFNA andPFH xS/PFOS , respectively. Based on milk/serum ratios of 0.015 and 0.03, this resulted in initial milk levels of 0.073 and 0.060 ng/mL forPFOA /PFNA andPFH xS/PFOS , respectively. These levels were modelled to decline with 7.7 and 3.1% each month forPFOA /PFNA andPFH xS/PFOS , respectively.
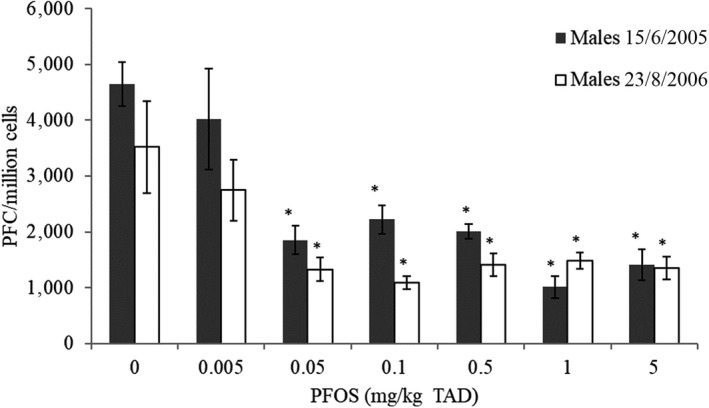
* Significantly different from control (p < 0.05). (Mean and
SEM ). Two independent experiments.PFC: perfluorinated compound; PFOS: Perfluorooctanesulfonic acid; SEM: standard error of mean; TAD: total applied dose.
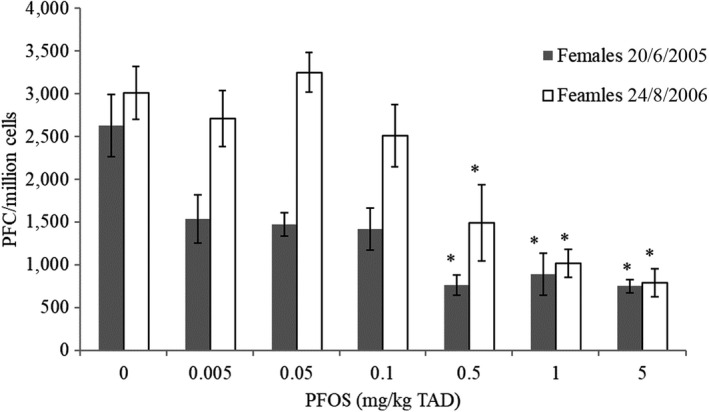
* Significantly different from control (p < 0.05). (Mean and
SEM ). Two independent experiments.PFC: perfluorinated compound; PFOS: Perfluorooctanesulfonic acid; SEM: standard error of mean; TAD: total applied dose.
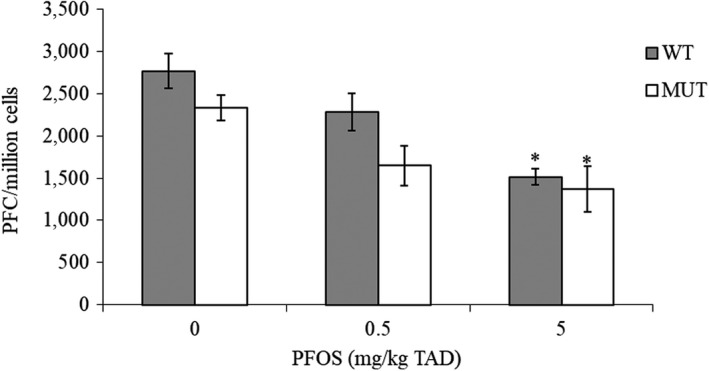
* Significantly different from control (p < 0.05). Samples were blinded to person reading slides. Doses of 0, 0.5 and 5 mg/kg bw (
TAD ).PFC: perfluorinated compound; PFOS: Perfluorooctanesulfonic acid; SEM: standard error of mean; TAD: total applied dose.
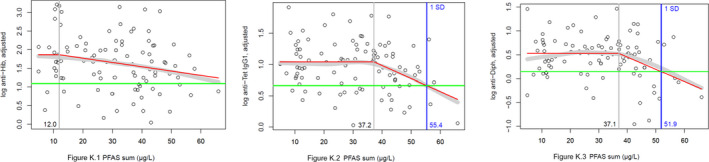
Titres are presented as log 10 transformed values. Broad grey band: moving average; red line: Fitted ‘knee’ function; horizontal green line: mean minus one standard deviation of the antibody levels below the ‘knee’; vertical grey line:
PFAS sum level of the ‘knee’; vertical blue line:PFAS sum level of the ‘knee’ function with antibody levels averagely diminished by one standard deviation.
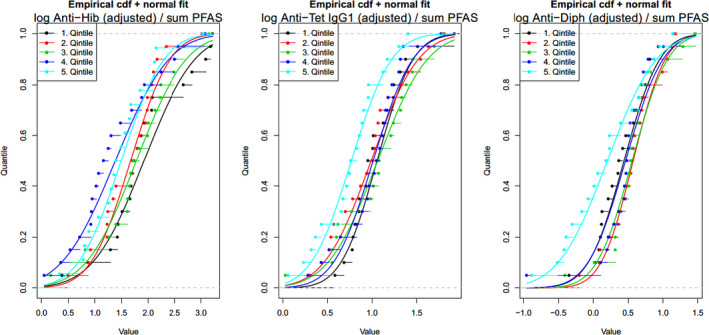
Titres on the X‐axis presented as log 10 transformed values.
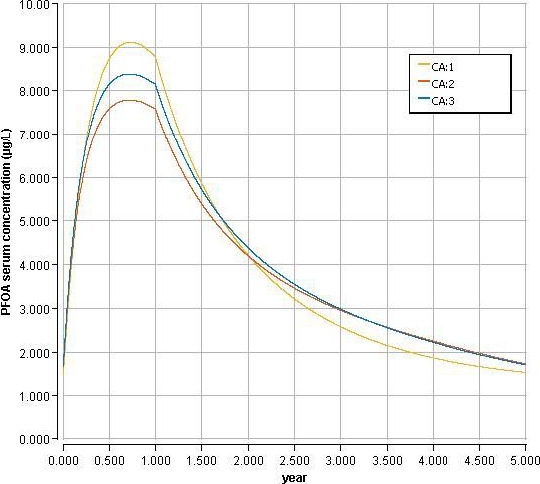
CA1 corresponds to equation used in the current opinion (French survey), CA2 to the WHO curve (P50 in boys), CA3 to the WHO curve (P50 in girls).
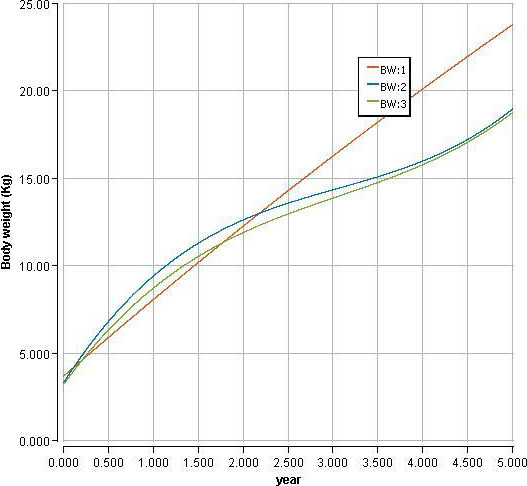
BW1 represents the body weight curve from the French survey (used in the current opinion), BW2 the body weight curve from P50 WHO curve for boys and BW3 the body weight curve from P50 WHO curve for girls.
CA1 corresponds to equation used in the current opinion (French survey), CA2 to the WHO curve (P50 in boys), CA3 to the WHO curve (P50 in girls).
Similar articles
-
Risk to human health related to the presence of perfluorooctane sulfonic acid and perfluorooctanoic acid in food.EFSA J. 2018 Dec 13;16(12):e05194. doi: 10.2903/j.efsa.2018.5194. eCollection 2018 Dec. EFSA J. 2018. PMID: 32625773 Free PMC article.
-
PFASs intake from fish, eggs and drinking water in Greece in relation to the safety limits for weekly intake proposed in the EFSA scientific opinion of 2020.Chemosphere. 2022 Jan;286(Pt 3):131851. doi: 10.1016/j.chemosphere.2021.131851. Epub 2021 Aug 9. Chemosphere. 2022. PMID: 34391114
-
Occurrence of selected per- and polyfluorinated alkyl substances (PFASs) in food available on the European market - A review on levels and human exposure assessment.Chemosphere. 2022 Jan;287(Pt 4):132378. doi: 10.1016/j.chemosphere.2021.132378. Epub 2021 Sep 27. Chemosphere. 2022. PMID: 34592212 Review.
-
Per- and poly-fluoroalkyl substances in commercial organic eggs via fishmeal in feed.Chemosphere. 2024 Jan;346:140553. doi: 10.1016/j.chemosphere.2023.140553. Epub 2023 Nov 7. Chemosphere. 2024. PMID: 37944762
-
PFASs: What can we learn from the European Human Biomonitoring Initiative HBM4EU.Int J Hyg Environ Health. 2023 May;250:114168. doi: 10.1016/j.ijheh.2023.114168. Epub 2023 Apr 15. Int J Hyg Environ Health. 2023. PMID: 37068413 Review.
Cited by
-
From science to policy: How European HBM indicators help to answer policy questions related to phthalates and DINCH exposure.Int J Hyg Environ Health. 2023 Jan;247:114073. doi: 10.1016/j.ijheh.2022.114073. Epub 2022 Nov 23. Int J Hyg Environ Health. 2023. PMID: 36434900 Free PMC article. Review.
-
Comprehensive analysis of PFAS presence from environment to plate.NPJ Sci Food. 2024 Oct 6;8(1):80. doi: 10.1038/s41538-024-00319-1. NPJ Sci Food. 2024. PMID: 39369000 Free PMC article. Review.
-
Luminescence Lifetime-Based Sensing Platform Based on Cyclometalated Iridium(III) Complexes for the Detection of Perfluorooctanoic Acid in Aqueous Samples.Anal Chem. 2024 Jan 30;96(4):1565-1575. doi: 10.1021/acs.analchem.3c04289. Epub 2024 Jan 16. Anal Chem. 2024. PMID: 38226978 Free PMC article.
-
Truth in the Serum? Estimating PFAS Relative Potency for Human Risk Assessment.Environ Health Perspect. 2022 Sep;130(9):94001. doi: 10.1289/EHP11799. Epub 2022 Sep 21. Environ Health Perspect. 2022. PMID: 36129438 Free PMC article.
-
Per- and polyfluoroalkyl substances activate UPR pathway, induce steatosis and fibrosis in liver cells.Environ Toxicol. 2023 Jan;38(1):225-242. doi: 10.1002/tox.23680. Epub 2022 Oct 17. Environ Toxicol. 2023. PMID: 36251517 Free PMC article.
References
-
- Abbott BD, Wolf CJ, Schmid JE, Das KP, Zehr RD, Helfant L, Nakayama S, Lindstrom AB, Strynar MJ and Lau C, 2007. Perfluorooctanoic acid induced developmental toxicity in the mouse is dependent on expression of peroxisome proliferator activated receptor‐alpha. Toxicological Sciences, 98, 571–581. - PubMed
-
- Abbott BD, Wolf CJ, Das KP, Zehr RD, Schmid JE, Lindstrom AB, Strynar MJ and Lau C, 2009. Developmental toxicity of perfluorooctane sulfonate (PFOS) is not dependent on expression of peroxisome proliferator activated receptor‐alpha (PPARα) in the mouse. Reproductive Toxicology, 27, 258–265. - PubMed
-
- Abbott BD, Wood CR, Watkins AM, Tatum‐Gibbs K, Das KP and Lau C, 2012. Effects of perfluorooctanoic acid (PFOA) on expression of peroxisome proliferator‐activated receptors (PPAR) and nuclear receptor‐regulated genes in fetal and postnatal CD‐1 mouse tissues. Reproductive Toxicology, 33, 491–505. - PubMed
-
- Abe T, Takahashi M, Kano M, Amaike Y, Ishii C, Maeda K, Kudoh Y, Morishita T, Hosaka T, Sasaki T, Kodama S, Matsuzawa A, Kojima H and Yoshinari K, 2017. Activation of nuclear receptor CAR by an environmental pollutant perfluorooctanoic acid. Archives of Toxicology, 91, 2365–2374. 10.1007/s00204-016-1888-3 - DOI - PubMed
-
- Abraham K, Mielke H, Fromme H, Volkel W, Menzel J, Peiser M, Zepp F, Willich SN and Weikert C, 2020. Internal exposure to perfluoroalkyl substances (PFASs) and biological marker in 101 healthy 1‐year‐old children: associations between levels of perfluorooctanoic acid (PFOA) and vaccine response. Archives of Toxicology, 94, 2131–2147. - PMC - PubMed