Review
. 2020 Sep 4:2020:3262835.
doi: 10.1155/2020/3262835. eCollection 2020.

MnDPDP: Contrast Agent for Imaging and Protection of Viable Tissue

Affiliations
Review

MnDPDP: Contrast Agent for Imaging and Protection of Viable Tissue

Per Jynge et al. Contrast Media Mol Imaging. .

Abstract

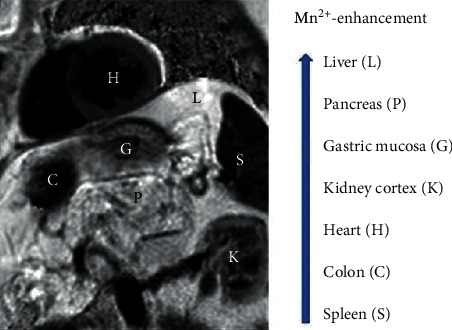
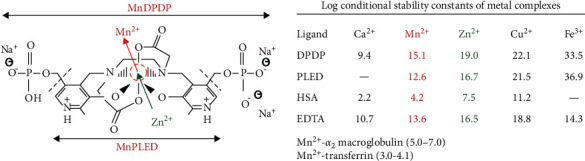
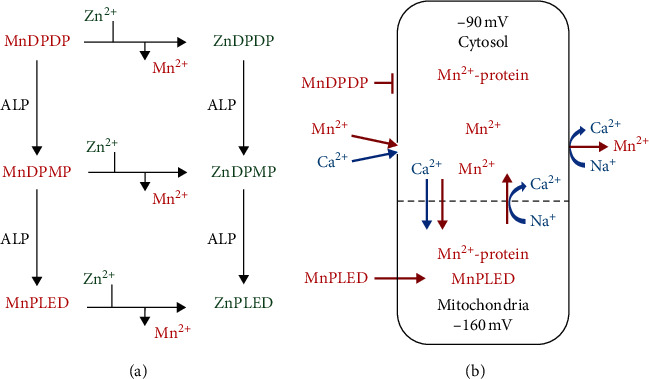
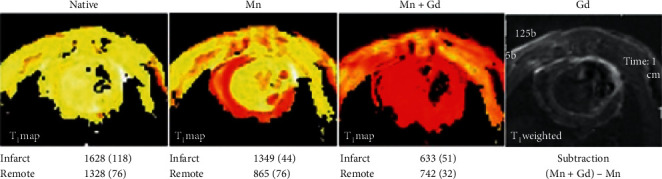
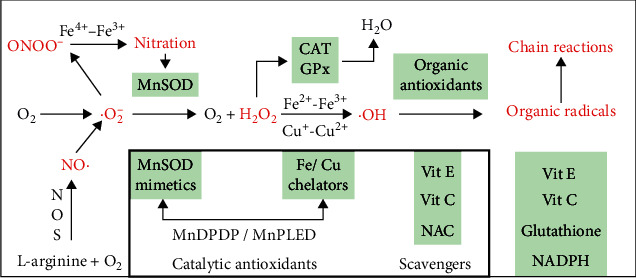
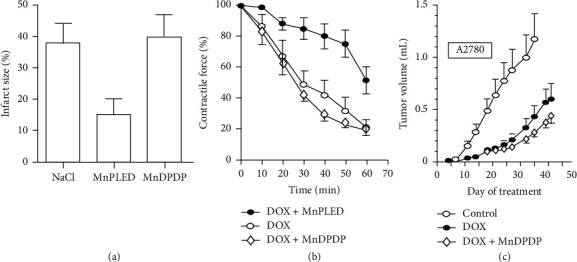
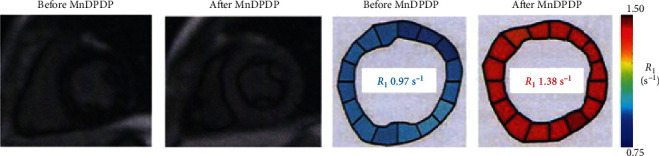
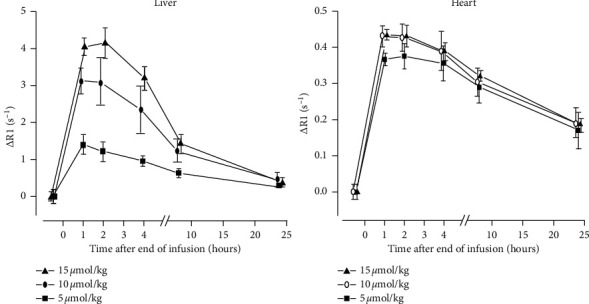
The semistable chelate manganese (Mn) dipyridoxyl diphosphate (MnDPDP, mangafodipir), previously used as an intravenous (i.v.) contrast agent (Teslascan™, GE Healthcare) for Mn-ion-enhanced MRI (MEMRI), should be reappraised for clinical use but now as a diagnostic drug with cytoprotective properties. Approved for imaging of the liver and pancreas, MnDPDP enhances contrast also in other targets such as the heart, kidney, glandular tissue, and potentially retina and brain. Transmetallation releases paramagnetic Mn2+ for cellular uptake in competition with calcium (Ca2+), and intracellular (IC) macromolecular Mn2+ adducts lower myocardial T 1 to midway between native values and values obtained with gadolinium (Gd3+). What is essential is that T 1 mapping and, to a lesser degree, T 1 weighted imaging enable quantification of viability at a cellular or even molecular level. IC Mn2+ retention for hours provides delayed imaging as another advantage. Examples in humans include quantitative imaging of cardiomyocyte remodeling and of Ca2+ channel activity, capabilities beyond the scope of Gd3+ based or native MRI. In addition, MnDPDP and the metabolite Mn dipyridoxyl diethyl-diamine (MnPLED) act as catalytic antioxidants enabling prevention and treatment of oxidative stress caused by tissue injury and inflammation. Tested applications in humans include protection of normal cells during chemotherapy of cancer and, potentially, of ischemic tissues during reperfusion. Theragnostic use combining therapy with delayed imaging remains to be explored. This review updates MnDPDP and its clinical potential with emphasis on the working mode of an exquisite chelate in the diagnosis of heart disease and in the treatment of oxidative stress.


Conflict of interest statement

Jynge, Skjold, and Eidsaunet own shares in the Norwegian R&D company IC Targets AS that attempts to reintroduce MnDPDP for diagnostic use. Andersson and Karlsson own shares in the Swedish company PledPharma AB that promotes derivatives of MnDPDP for therapy. Jynge, Skjold, Andersson, and Karlsson are inventors of patents involving MnDPDP for diagnosis and/or therapy. Falkmer, Bruvold, Seland, and Blomlie declare no conflicts of interest.

Figures

Figure 1
Figure 1
MnDPDP: T1 weighted image (T1WI) of heart and abdominal organs. Signal intensity (SI) in Mn2+-enhanced tissue increases from spleen to liver. Imaging 60 min after i.v. infusion of MnDPDP 5 μmol/kg in a patient with a recent acute myocardial infarction (AMI) located to left ventricular (LV) septum (Skjold A, unpublished data).
Figure 2
Figure 2
MnDPDP: structure, transmetallation, and stability. In MnDPDP 3 anionic sites are balanced by 3 sodium ions. MW: MnDPDP ∼680 Da, MnPLED ∼520 Da. Transmetallation mainly by zinc (Zn2+) releases Mn2+. The enclosed table presents log conditional stability constants for metal complexes with DPDP, PLED, HSA (human serum albumin), and EDTA (ethylene-diamine tetra-acetic acid). Log values for Mn2+ binding to main transport proteins in plasma are also included. Material derived from [–29].
Figure 3
Figure 3
MnDPDP: metabolism and Mn2+ uptake and retention in excitable cells. (a) MnDPDP is metabolized in plasma, microcirculation, and interstitium by transmetallation, mainly with Zn2+, and by the action of alkaline phosphatase (ALP) before delivering Mn2+ and MnPLED for cellular uptake. (b) Mn2+ follows Ca2+ and electrochemical gradients into and out of cardiomyocytes. Lipid soluble MnPLED is able to enter cells as intact agent. IC Mn2+ retention for hours is caused by macromolecular binding, especially in protein-dense mitochondria, and by a slow efflux via bidirectional Na+/Ca2+ exchangers (NCXs). Material derived from [, –37].
Figure 4
Figure 4
Dual contrast imaging with IC Mn and EC Gd in infarcted rat myocardium. Rats with permanently ligated left coronary artery underwent single session cardiac MRI at 7.0 T. The figure displays T1 maps of LV myocardium: Native; Mn (MnCl2 infusion (25 μmol/kg)); and Mn + Gd (gadodiamide injection 150 μmol/kg)). At the end of the experiment, Gd was obtained by late (10 min) Gd-enhancement and subtraction technique (T1WI). T1 values in msec (mean (SD)) are included. IC Mn adducts lower T1 mainly, but not exclusively, in viable cardiomyocytes whereas EC located gadodiamide lowers T1 and raises SI mainly inside infarcted tissue (Bruvold M, Seland JG, Jynge P, unpublished data 2006).
Figure 5
Figure 5
ROS-RNS with intrinsic cell defence (outer box) and exogenous antioxidants (inner box). The diagram presents free radicals with unpaired electrons (.marked) and other oxidizing byproducts of respiration. Secondary pathways activated by ROS-RNS are not included. Observe the dependence of NO· upon MnSOD and H2O2 upon CAT and GPx or upon binding of prooxidant Cu+ and Fe2+. Suboptimal control of ·O2 and Fe2+ or Cu+ may release highly toxic ONOO and ·OH, radicals which initiate protein nitration and secondary chain reactions attacking most cell constituents. The strategic position of MnDPDP/MnPLED as direct (MnSOD mimetic) and indirect (Fe2+/Cu+ chelation) catalytic antioxidants is indicated. Material derived from [, , –59]. ·O2, superoxide; H2O2, hydrogen peroxide;·OH, hydroxyl radical; NO·, nitric oxide; ONOO, peroxynitrite; NOS, nitric oxide synthase; MnSOD, mitochondrial SOD; CAT, catalase; GPx, glutathion peroxidase; NAC, N-acetyl-cysteine; scavengers, antioxidants consumed by ROS-RNS and chain reactants in a one-to-one manner.
Figure 6
Figure 6
Therapy with MnDPDP: preclinical examples. (a) Reperfusion after AMI [10]. In anesthetized pigs MnPLED, but not MnDPDP and NaCl (placebo), infused i.v. prior to and during reperfusion reduced infarct size at the end of the experiments. Reversible ligation of left coronary artery ligation with 30 min ischemia and 120 min reperfusion (reprinted with permission from Acta Radiol). (b) Cardioprotection during chemotherapy with doxorubicin (DOX) [58]. MnPLED but not MnDPDP improved inotropy during in vitro exposure to toxic doses of DOX. Water bath model with paced left atrial preparations excised from mice after pretreatment with MnDPDP (10 μM) or MnPLED (10 μM). Groups: DOX alone; DOX + MnDPDP; DOX + MnPLED (reprinted with permission from Transl Oncol). (c) Antitumoral efficacy of doxorubicin (DOX) [58]. Human ovarian tumor (A2780) bearing nude mice were treated with repeated cycles of DOX and prior infusion of MnDPDP. At the end of the study, DOX alone (control) significantly reduced tumor volumes by about 50%. There was a tendency that MnDPDP increased the antitumoral effect of DOX (reprinted with permission from Transl Oncol).
Figure 7
Figure 7
MnDPDP: cardiac MEMRI in a healthy human volunteer [17]. Short axis T1WI and R1 maps before (native) and 60 min after i.v. infusion of MnDPDP 5 μmol/kg are presented. Imaging at 1.5 T. Mean T1 values of 16 sectors were before MnDPDP 1030 ms and after MnDPDP 725 ms (reproduced with permission from J Magn Reson Imaging).
Figure 8
Figure 8
MnDPDP: dose-response and Mn2+ uptake/retention [17]. R1 was measured at 1.5 T in liver and LV myocardium before and after MnDPDP (5, 10, or 15 μmol/kg) administered outside magnet. ΔR1 values are displayed (reproduced with permission from J Magn Reson Imaging).
Figure 9
Figure 9
MnDPDP: myocardial Mn2+ uptake in healthy human volunteers [18]. MnDPDP 5 μmol/kg was administered i.v. inside magnet with infusion time of 5 min (n = 5) or 30 min (n = 5). R1 values obtained at 1.5 T over 40 min after start of infusion were converted to tissue [Mn2+] in arbitrary units (a.u.). ΔR1 values were as follows: 5 min, 0.32 s−1; 30 min, 0.35 s−1 (reproduced with permission from J Magn Reson Imaging).
Figure 10
Figure 10
MnDPDP: myocardial remodeling in a patient examined 3 weeks after AMI treated with pPCI [19]. One hour after i.v. infusion of MnDPDP (5 μmol/kg, 5 min) T1WI shows a transmural infarct in the LV lateral wall and an apparent thickening of remote myocardium. LV maps of SWT (mm) and of R1 (s−1) show parallel directions of rising values from the infarct towards remote sectors. Myocardial Mn2+ uptake (arbitrary units (a.u.)) over 30 min is biphasic in remote sectors and monophasic and smaller in the infarct. LV ejection fraction (LVEF): 48%. Reproduced with permission from J Magn Reson Imaging.
Figure 11
Figure 11
MnDPDP: myocardial remodeling—sectorial R1 (T1) vs. systolic wall thickening (SWT) [19]. Mapping of SWT and R1 at 1.5 T was undertaken in 24 sectors of LV myocardium before (native reference) and one hour after i.v. infusion of MnDPDP (5 μmol/kg, 5 min). Data were obtained from 10 patients undergoing remodeling after AMI. (a) Measured values of R1 (s−1) vs. SWT (mm) before and after MnDPDP. Dotted black lines are drawn at SWT 0 and 5 mm; blue and red lines are drawn between mean R1 values at 0 and 5 mm SWT. In spite of large spread in individual R1 values, significant correlations were found between infarct-to-remote directional angles for SWT and R1 both before and after MnDPDP. Figure reproduced with permission from J Magn Reson Imaging. (b) Diagram based on values from (a) but presented as T1 (ms) vs. SWT (range 0–5 mm). The dotted horizontal lines mark T1 of normal myocardium [17, 18]. T1-SWT correlations are marked by continuous lines. Blue line: native T1 values (1150–1040 ms). Red line: T1 values after MnDPDP (900–740 ms).
Figure 12
Figure 12
Predictive imaging prior to therapy of rat livers with hepatocellular carcinoma (HCC) of high (I) and low (III) grade of differentiation [89]. MnDPDP raised tumor-to-liver contrast in T1WIs, see arrow, in grade I HCC to the left, but hardly in grade III HCC as depicted to the right (reproduced with permission from Transl Oncol).
Figure 13
Figure 13
Brain MRI in a patient receiving MnDPDP 140 μmol/kg over 8 months [22, 90]. MnDPDP (10 μmol/kg) was applied as cytoprotective adjunct to 14 cycles of chemotherapy with oxaliplatin as the primary drug in a patient with cancer of colon. MRI of the brain (1.5 T) was undertaken after the last cycle. Sagittal and parasagittal images (A-B, a-b) were obtained by T1W-FLAIR and descending axial images (C-D, c-d) by T1W-SE. High SI reflects marked Mn deposition in: A-a, corpus callosum (open arrow), mesencephalon (thick white arrow), and pituitary gland (thin white arrow); B-b, C-c, putamen and globus pallidus (L nucleus lentiformis) and caput nucleus caudatus (N); D-d, cerebellum with nucleus dentatus (curved white arrow) and brain stem (white angled arrow) (Blomlie V, Jynge P., unpublished images).
Figure 14
Figure 14
MnDPDP as cytoprotective adjunct to chemotherapy. Patients with advanced cancer of colon were treated with repeated cycles with oxaliplatin as primary anticancer drug and MnDPDP as adjunct for protection of normal tissues. (a) Adverse events (AEs) [23]. AEs of grade I (mild), II (moderate), III (severe), and IV (life-threatening) were recorded in 14 patients during 3 therapy cycles with oxaliplatin and with preinfusion of MnDPDP 2 μmol/kg or saline (placebo). There was a major reduction in AEs grade II-IV with MnDPDP. Also plasma leukocyte content was maintained at a higher level with MnDPDP (reprinted with permission from Translational Oncology). (b) Peripheral sensory neuropathy (PSN) [24]. Patients that experienced PSN during previous oxaliplatin cycles were followed for up to 8 further cycles, each with preinfusion of MnDPDP 5 μmol/kg. In these cycles, MnDPDP gradually reduced the initial severity of PSN (black > dark gray > light gray) indicating a reversal of the underlying nerve injuries (reprinted with permission from J Clin Invest). (c) Plasma [Mn] (nmol/L) during therapy with oxaliplatin and MnDPDP [24]. Patients cited in B showed a gradual rise in plasma [Mn] over 8 cycles in 4 months without exceeding normal levels of 10–20 nmol/L [29, 33] (reprinted with permission from J Clin Invest).

Similar articles

Cited by

References

    1. Paiman E. H. M., Lamb H. J. When should we use contrast material in cardiac MRI? Journal of Magnetic Resonance Imaging. 2017;46(6):1551–1572. doi: 10.1002/jmri.25754. - DOI - PubMed
    1. European Medicines Agency (EMA) PRAC Concludes Assessment of Gadolinium Agents Used in the Body Scans and Recommends Regulatory Action, Including Suspension for Some Marketing Autherizations. Amsterdam, Netherlands: EMA; 2017.
    1. Lauterbur P. C., Mendoca Dias M. H., Rudin A. M. Augmentation of water proton spin-lattice relaxation rates by the in vitro addition of paramagnetic ions. In: Duton P. L., Leigh J. S., Scarpa A., editors. Frontiers of Biological Energetics: Electrons to Tissues. New York, NY, USA: Academic Press; 1978. pp. 752–759. - DOI
    1. Wolf G., Baum L. Cardiovascular toxicity and tissue proton T1 response to manganese injection in the dog and rabbit. American Journal of Roentgenology. 1983;141(1):193–197. doi: 10.2214/ajr.141.1.193. - DOI - PubMed
    1. de Roos A., Higgins C. B. Cardiac radiology: centenary review. Radiology. 2014;273(2S):S142–S159. doi: 10.1148/radiol.14140432. - DOI - PubMed