

COVID-19 survival associates with the immunoglobulin response to the SARS-CoV-2 spike receptor binding domain
- PMID: 32991329
- PMCID: PMC7685720
- DOI: 10.1172/JCI142804
COVID-19 survival associates with the immunoglobulin response to the SARS-CoV-2 spike receptor binding domain
Abstract
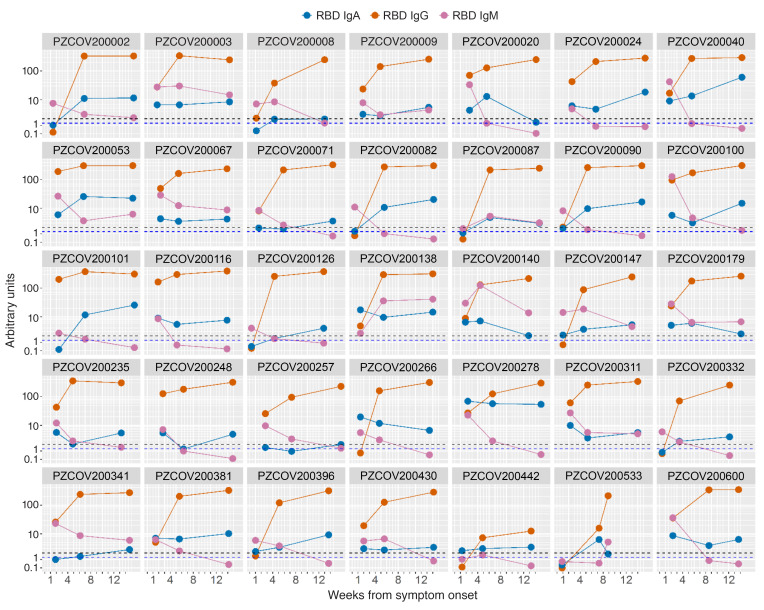
BACKGROUNDSerological assays are of critical importance to investigate correlates of response and protection in coronavirus disease 2019 (COVID-19), to define previous exposure to severe acute respiratory syndrome coronavirus 2 (SARS-CoV-2) in populations, and to verify the development of an adaptive immune response in infected individuals.METHODSWe studied 509 patients confirmed to have COVID-19 from the San Raffaele Hospital of Milan and 480 samples of prepandemic organ donor sera collected in 2010-2012. Using fluid-phase luciferase immune precipitation (LIPS) assays, we characterized IgG, IgM, and IgA antibodies to the spike receptor binding domain (RBD), S1+S2, nucleocapsid, and ORF6 to ORF10 of SARS-CoV-2, to the HCoV-OC43 and HCoV-HKU1 betacoronaviruses spike S2, and the H1N1Ca2009 flu virus hemagglutinin. Sequential samples at 1 and 3 months after hospital discharge were also tested for SARS-CoV-2 RBD antibodies in 95 patients.RESULTSAntibodies developed rapidly against multiple SARS-CoV-2 antigens in 95% of patients by 4 weeks after symptom onset and IgG to the RBD increased until the third month of follow-up. We observed a major synchronous expansion of antibodies to the HCoV-OC43 and HCoV-HKU1 spike S2. A likely coinfection with influenza was neither linked to a more severe presentation of the disease nor to a worse outcome. Of the measured antibody responses, positivity for IgG against the SARS-CoV-2 spike RBD was predictive of survival.CONCLUSIONThe measurement of antibodies to selected epitopes of SARS-CoV-2 antigens can offer a more accurate assessment of the humoral response in patients and its impact on survival. The presence of partially cross-reactive antibodies with other betacoronaviruses is likely to impact on serological assay specificity and interpretation.TRIAL REGISTRATIONCOVID-19 Patients Characterization, Biobank, Treatment Response and Outcome Predictor (COVID-BioB). ClinicalTrials.gov identifier: NCT04318366.FUNDINGIRCCS Ospedale San Raffaele and Università Vita Salute San Raffaele.
Keywords: Adaptive immunity; COVID-19; Immunoglobulins; Immunology; Influenza.
Conflict of interest statement
Figures


Comment in
-
What are protective antibody responses to pandemic SARS-CoV-2?J Clin Invest. 2020 Dec 1;130(12):6232-6234. doi: 10.1172/JCI143466. J Clin Invest. 2020. PMID: 33055417 Free PMC article.
Similar articles
-
Detection of Serum Cross-Reactive Antibodies and Memory Response to SARS-CoV-2 in Prepandemic and Post-COVID-19 Convalescent Samples.J Infect Dis. 2021 Oct 28;224(8):1305-1315. doi: 10.1093/infdis/jiab333. J Infect Dis. 2021. PMID: 34161567 Free PMC article.
-
Mapping SARS-CoV-2 Antibody Epitopes in COVID-19 Patients with a Multi-Coronavirus Protein Microarray.Microbiol Spectr. 2021 Oct 31;9(2):e0141621. doi: 10.1128/Spectrum.01416-21. Epub 2021 Oct 27. Microbiol Spectr. 2021. PMID: 34704808 Free PMC article.
-
Anti-RBD IgG antibodies from endemic coronaviruses do not protect against the acquisition of SARS-CoV-2 infection among exposed uninfected individuals.Front Immunol. 2024 May 23;15:1396603. doi: 10.3389/fimmu.2024.1396603. eCollection 2024. Front Immunol. 2024. PMID: 38846944 Free PMC article.
-
Humoral immune responses and neutralizing antibodies against SARS-CoV-2; implications in pathogenesis and protective immunity.Biochem Biophys Res Commun. 2021 Jan 29;538:187-191. doi: 10.1016/j.bbrc.2020.10.108. Epub 2020 Nov 7. Biochem Biophys Res Commun. 2021. PMID: 33187644 Free PMC article. Review.
-
Immunity to SARS-CoV-2: Lessons Learned.Front Immunol. 2021 Mar 19;12:654165. doi: 10.3389/fimmu.2021.654165. eCollection 2021. Front Immunol. 2021. PMID: 33815415 Free PMC article. Review.
Cited by
-
The longitudinal characterization of immune responses in COVID-19 patients reveals novel prognostic signatures for disease severity, patients' survival and long COVID.Front Immunol. 2024 Jul 29;15:1381091. doi: 10.3389/fimmu.2024.1381091. eCollection 2024. Front Immunol. 2024. PMID: 39136010 Free PMC article.
-
Protective and pathogenic role of humoral responses in COVID-19.J Microbiol. 2022 Mar;60(3):268-275. doi: 10.1007/s12275-022-2037-8. Epub 2022 Mar 2. J Microbiol. 2022. PMID: 35235178 Free PMC article. Review.
-
Third cranial nerve palsy in an 88-year-old man after SARS-CoV-2 mRNA vaccination: change of injection site and type of vaccine resulted in an uneventful second dose with humoral immune response.BMJ Case Rep. 2022 Feb 8;15(2):e246485. doi: 10.1136/bcr-2021-246485. BMJ Case Rep. 2022. PMID: 35135792 Free PMC article.
-
COVID-19-specific transcriptomic signature detectable in blood across multiple cohorts.Front Genet. 2022 Aug 5;13:929887. doi: 10.3389/fgene.2022.929887. eCollection 2022. Front Genet. 2022. PMID: 35991542 Free PMC article.
-
Diagnostic Testing for SARS-CoV-2 Infection.Curr Hepatol Rep. 2021;20(4):166-174. doi: 10.1007/s11901-021-00567-9. Epub 2021 Oct 28. Curr Hepatol Rep. 2021. PMID: 34725630 Free PMC article. Review.
References
Publication types
MeSH terms
Substances
Associated data
LinkOut - more resources
Full Text Sources
Medical
Miscellaneous
