

Ionotropic Receptors as a Driving Force behind Human Synapse Establishment
- PMID: 32986821
- PMCID: PMC7947827
- DOI: 10.1093/molbev/msaa252
Ionotropic Receptors as a Driving Force behind Human Synapse Establishment
Abstract
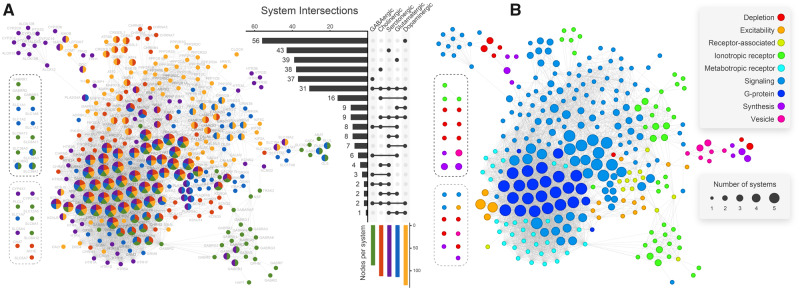
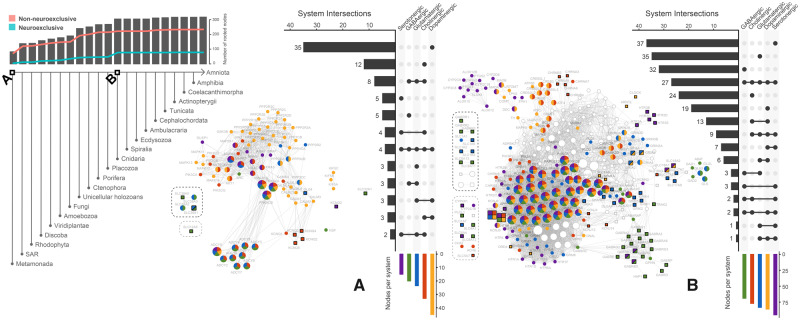
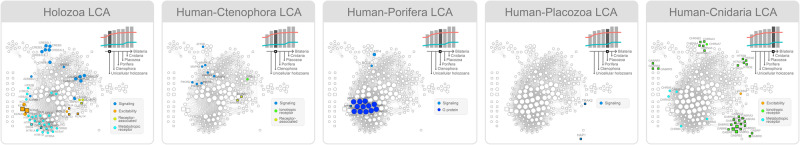
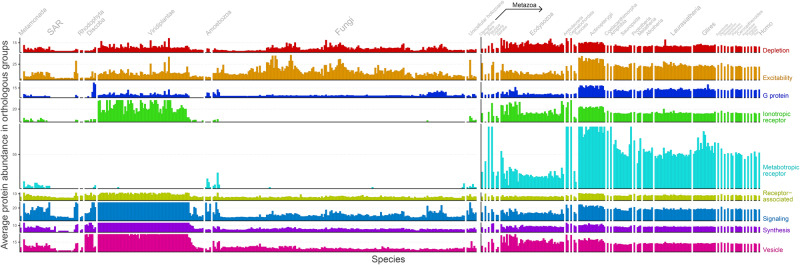
The origin of nervous systems is a main theme in biology and its mechanisms are largely underlied by synaptic neurotransmission. One problem to explain synapse establishment is that synaptic orthologs are present in multiple aneural organisms. We questioned how the interactions among these elements evolved and to what extent it relates to our understanding of the nervous systems complexity. We identified the human neurotransmission gene network based on genes present in GABAergic, glutamatergic, serotonergic, dopaminergic, and cholinergic systems. The network comprises 321 human genes, 83 of which act exclusively in the nervous system. We reconstructed the evolutionary scenario of synapse emergence by looking for synaptic orthologs in 476 eukaryotes. The Human-Cnidaria common ancestor displayed a massive emergence of neuroexclusive genes, mainly ionotropic receptors, which might have been crucial to the evolution of synapses. Very few synaptic genes had their origin after the Human-Cnidaria common ancestor. We also identified a higher abundance of synaptic proteins in vertebrates, which suggests an increase in the synaptic network complexity of those organisms.
Keywords: ionotropic receptor; neurotransmission; synapse evolution; synapse network; systems biology.
© The Author(s) 2020. Published by Oxford University Press on behalf of the Society for Molecular Biology and Evolution.
Figures

Similar articles
-
Unbiased View of Synaptic and Neuronal Gene Complement in Ctenophores: Are There Pan-neuronal and Pan-synaptic Genes across Metazoa?Integr Comp Biol. 2015 Dec;55(6):1028-49. doi: 10.1093/icb/icv104. Epub 2015 Oct 9. Integr Comp Biol. 2015. PMID: 26454853 Free PMC article.
-
Evolutionary origins of chemical synapses.Vitam Horm. 2020;114:1-21. doi: 10.1016/bs.vh.2020.04.009. Epub 2020 Jul 3. Vitam Horm. 2020. PMID: 32723540 Review.
-
Neurotransmitter inactivation is important for the origin of nerve system in animal early evolution: a suggestion from genomic comparison.Prog Neurobiol. 2006 Apr;78(6):390-5. doi: 10.1016/j.pneurobio.2006.03.002. Epub 2006 May 2. Prog Neurobiol. 2006. PMID: 16647180 Review.
-
Analysis of synaptic gene expression in the neocortex of primates reveals evolutionary changes in glutamatergic neurotransmission.Cereb Cortex. 2015 Jun;25(6):1596-607. doi: 10.1093/cercor/bht354. Epub 2014 Jan 9. Cereb Cortex. 2015. PMID: 24408959 Free PMC article.
-
Building a synapse: genetic analysis of glutamatergic neurotransmission.Biochem Soc Trans. 2006 Feb;34(Pt 1):64-7. doi: 10.1042/BST0340064. Biochem Soc Trans. 2006. PMID: 16417484 Review.
Cited by
-
Introduction: What Are Dendritic Spines?Adv Neurobiol. 2023;34:1-68. doi: 10.1007/978-3-031-36159-3_1. Adv Neurobiol. 2023. PMID: 37962793
-
Bridge: A New Algorithm for Rooting Orthologous Genes in Large-Scale Evolutionary Analyses.Mol Biol Evol. 2024 Feb 1;41(2):msae019. doi: 10.1093/molbev/msae019. Mol Biol Evol. 2024. PMID: 38306290 Free PMC article.
-
Unraveling Brain Microcircuits, Dendritic Spines, and Synaptic Processing Using Multiple Complementary Approaches.Front Physiol. 2022 Feb 28;13:831568. doi: 10.3389/fphys.2022.831568. eCollection 2022. Front Physiol. 2022. PMID: 35295578 Free PMC article. No abstract available.
-
Morphological Features of Human Dendritic Spines.Adv Neurobiol. 2023;34:367-496. doi: 10.1007/978-3-031-36159-3_9. Adv Neurobiol. 2023. PMID: 37962801 Review.
References
-
- Achim K, Arendt D.. 2014. Structural evolution of cell types by step-wise assembly of cellular modules. Curr Opin Genet Dev. 27:102–108. - PubMed
-
- Albuixech-Crespo B, López-Blanch L, Burguera D, Maeso I, Sánchez-Arrones L, Moreno-Bravo JA, Somorjai I, Pascual-Anaya J, Puelles E, Bovolenta P, et al.2017. Molecular regionalization of the developing amphioxus neural tube challenges major partitions of the vertebrate brain. PLoS Biol. 15(4):e2001573. - PMC - PubMed
-
- Azmitia E. 2007. Cajal and brain plasticity: insights relevant to emerging concepts of mind. Brain Res Rev. 55(2):395–405. - PubMed
Publication types
MeSH terms
Substances
LinkOut - more resources
Full Text Sources
