

Repression of Irs2 by let-7 miRNAs is essential for homeostasis of the telencephalic neuroepithelium
- PMID: 32985705
- PMCID: PMC7604626
- DOI: 10.15252/embj.2020105479
Repression of Irs2 by let-7 miRNAs is essential for homeostasis of the telencephalic neuroepithelium
Abstract
Structural integrity and cellular homeostasis of the embryonic stem cell niche are critical for normal tissue development. In the telencephalic neuroepithelium, this is controlled in part by cell adhesion molecules and regulators of progenitor cell lineage, but the specific orchestration of these processes remains unknown. Here, we studied the role of microRNAs in the embryonic telencephalon as key regulators of gene expression. By using the early recombiner Rx-Cre mouse, we identify novel and critical roles of miRNAs in early brain development, demonstrating they are essential to preserve the cellular homeostasis and structural integrity of the telencephalic neuroepithelium. We show that Rx-Cre;DicerF/F mouse embryos have a severe disruption of the telencephalic apical junction belt, followed by invagination of the ventricular surface and formation of hyperproliferative rosettes. Transcriptome analyses and functional experiments in vivo show that these defects result from upregulation of Irs2 upon loss of let-7 miRNAs in an apoptosis-independent manner. Our results reveal an unprecedented relevance of miRNAs in early forebrain development, with potential mechanistic implications in pediatric brain cancer.
Keywords: Pax6; apical adherens junction; cancer; ectopia; p53.
© 2020 The Authors. Published under the terms of the CC BY 4.0 license.
Conflict of interest statement
The authors declare that they have no conflict of interest.
Figures
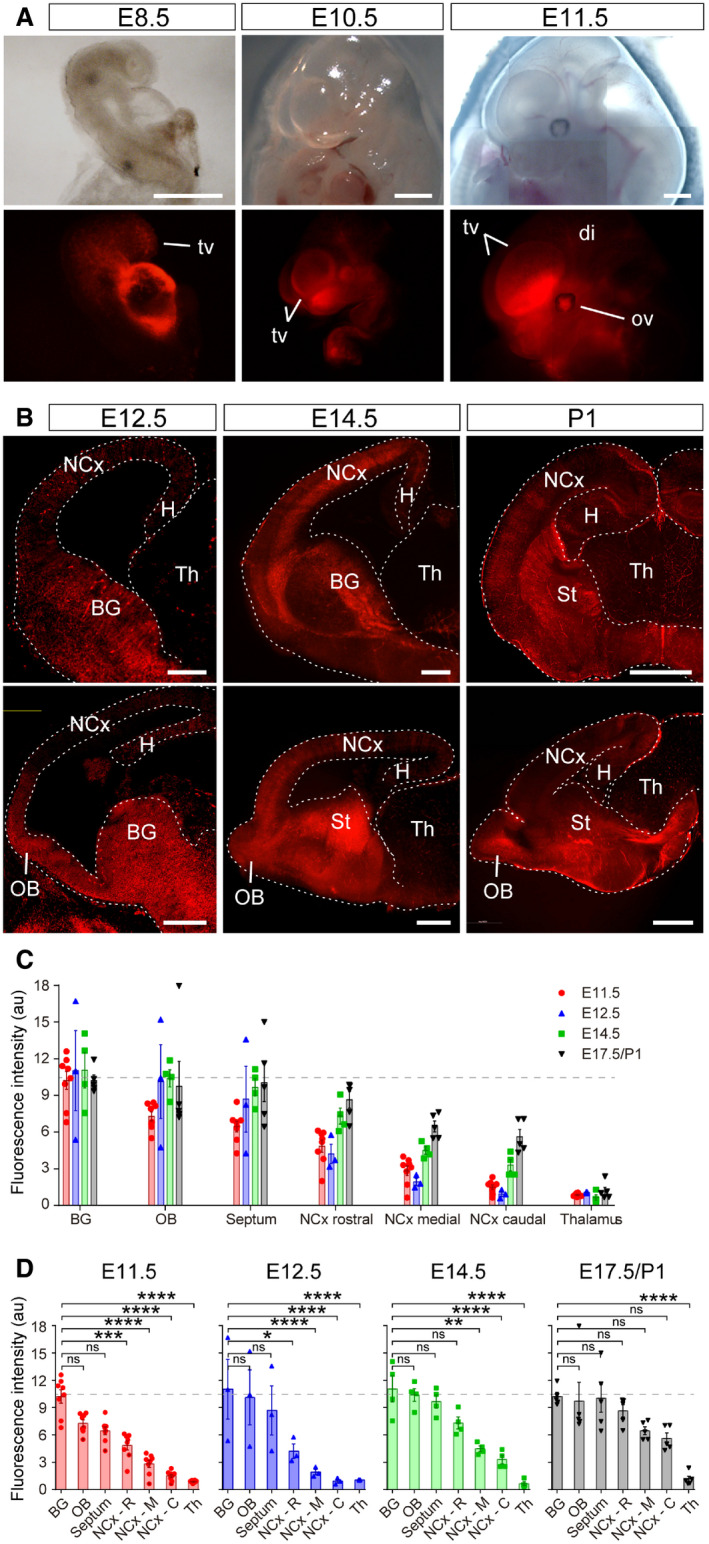
- A, B
Bright field (top row) and TdTomato expression (red) under the Rx3 promoter as seen in whole embryos (A) and brain sections (B) at the embryonic ages indicated. Sections in (B) are in coronal (upper panels) and sagittal plane (bottom panels). BG, basal ganglia; di, diencephalon; H, hippocampus; NCx, neocortex; OB, olfactory bulb; ov, optic vesicle; St, striatum; Th, thalamus; tv, telencephalic vesicle. Scale bars, 500 μm (A), 300 μm (B).
- C, D
Quantification of Tomato fluorescence intensity upon Rx‐Cre recombination in the forebrain areas and at the embryonic stages indicated. BG, basal ganglia; NCx, neocortex; OB, olfactory bulb. Dashed line indicates average level of Tomato fluorescence in Basal Ganglia. Comparison across telencephalic areas at each stage is shown in (D). Data in histograms are mean ± SEM, symbols indicate individual values; n = 3–8 replicates per age. ANOVA followed by Tukey's test; ns, not significant; *P < 0.05, **P < 0.01, ***P < 0.001, ****P < 0.0001. See Table EV1 for the full set of statistical results.
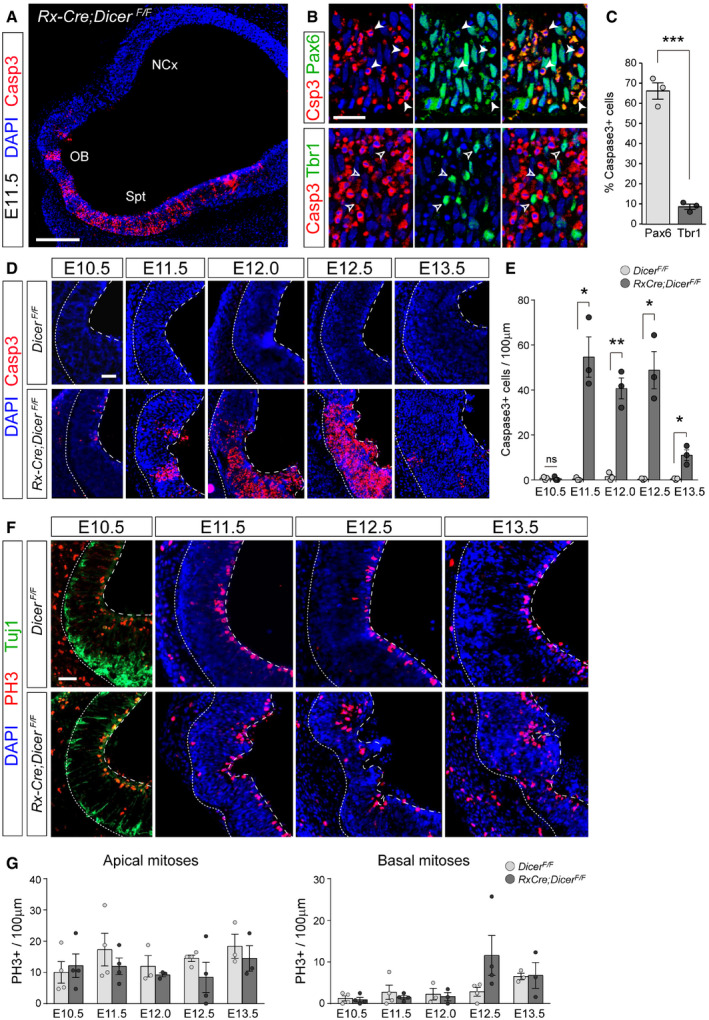
- A
Distribution of Casp3+ cells in rostral and ventral domains of an E11.5 Rx‐Dicer mutant embryo. NCx, neocortex; OB, olfactory bulb; Spt, septum.
- B, C
Marker analysis of Casp3+ cells in the rostral telencephalon of E12.5 Rx‐Dicer mutant embryos. Most apoptotic cells are Pax6+ RGCs (solid arrowheads) and not Tbr1+ neurons (open arrowheads). N = 3 replicates per marker.
- D, E
Distribution and abundance of apoptotic cells (Casp3+) in the rostral telencephalic primordium of control and Rx‐Dicer mutant embryos at the indicated ages. Dotted line indicates basal surface, and dashed line, apical surface. N = 3 replicates per genotype and age.
- F, G
Distribution and abundance of mitoses (PH3+) and neurons (Tuj1) in the rostral telencephalic primordium of control and Rx‐Dicer mutant embryos at the indicated ages. Dotted line indicates basal surface, and dashed line, apical surface. N = 3–4 replicates per genotype and age. No significant differences were found between control and mutant embryos in apical nor basal mitoses.
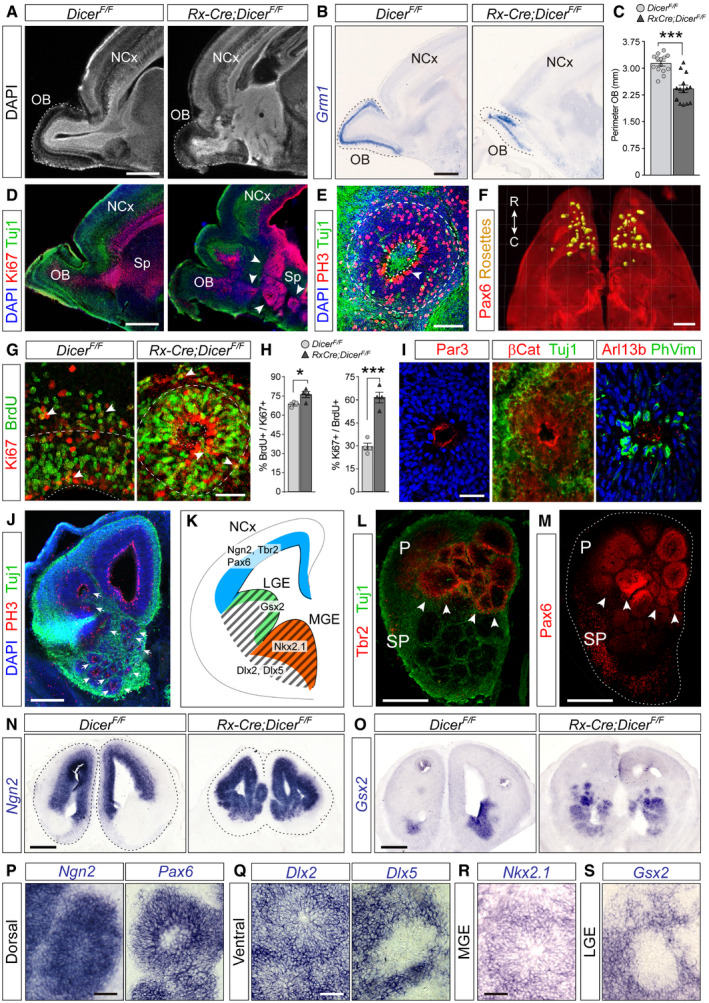
- A
DAPI stain of sagittal sections through the rostral telencephalon of E17.5 control and Rx‐Dicer mutant littermates showing the neocortex (NCx) and olfactory bulb (OB; dashed line).
- B
Expression pattern of Grm1 mRNA in OB (dotted line) of control and Rx‐Dicer mutants.
- C
Quantification of OB perimeter (mean ± SEM; symbols indicate values for individual embryos); t‐test, ***P < 0.001. N = 14 replicates per genotype.
- D
Immunostains of E17.5 control and Rx‐Dicer mutant brains showing the distribution of progenitor cells (Ki67, red) and neurons (Tuj1, green). Arrowheads indicate rosettes. Sp, septum.
- E
Detail of a rosette from an E17.5 Rx‐Dicer mutant embryo displaying typical features: closed apical surface (dotted line) with PH3+ apical mitoses (white arrowhead) and basal mitoses, surrounded by Tuj1+ neurons (green). Dashed line indicates the basal border of the rosette.
- F
Rostral half of an Rx‐Dicer mutant E17.5 brain immunostained for Pax6, clarified, and segmented to reveal rosettes (yellow). C, caudal; R, rostral.
- G, H
BrdU incorporation and cell cycle re‐entry analysis with the progenitor cell marker Ki67 at E17.5, in the rostral cortex of control embryos compared with rostral rosettes of Rx‐Dicer mutants. Dotted lines indicate apical surface, and dashed lines indicate basal border of VZ. Arrowheads indicate double‐positive cells. Data in histograms are mean ± SEM, symbols indicate values for individual embryos; n ≥ 3 embryos; chi‐square test, *P < 0.05, ***P < 0.001.
- I
Apical lumen of rosettes immunostained against apical complex proteins (Par3, β‐catenin), primary cilia (Arl13b), apical mitoses (PhVim), and neurons (Tuj1).
- J
Coronal section through the rostral telencephalon of an E14.5 Rx‐Dicer mutant embryo illustrating the high abundance and location of rosettes (arrows), as revealed by the distribution of mitoses (PH3) and neurons (Tuj1).
- K–S
Analysis of the regional identity of rosettes in E14.5 Rx‐Dicer mutants. (K) Schema of normal transcription factor expression patterns defining telencephalic regional identity. Expression of Ngn2, Tbr2, and Pax6 identifies rosettes in the rostro‐dorsal telencephalon as having dorsal identity (L–N, P); Gsx2, Dlx2, and Dlx5 identify rosettes in the ventral telencephalon as having ventral identity (O, Q); Nkx2.1 identifies MGE rosettes as being normotopic (R); the absence of Gsx2 in LGE rosette cells identifies them as ectopic (S). Tuj1 labels neurons. In (L, M), arrowheads indicate the border between dorsal and ventral territories, and dotted line indicates the outer border of the telencephalon. LGE, lateral ganglionic eminence; MGE, medial ganglionic eminence; P, pallium; SP, subpallium.
- A, B
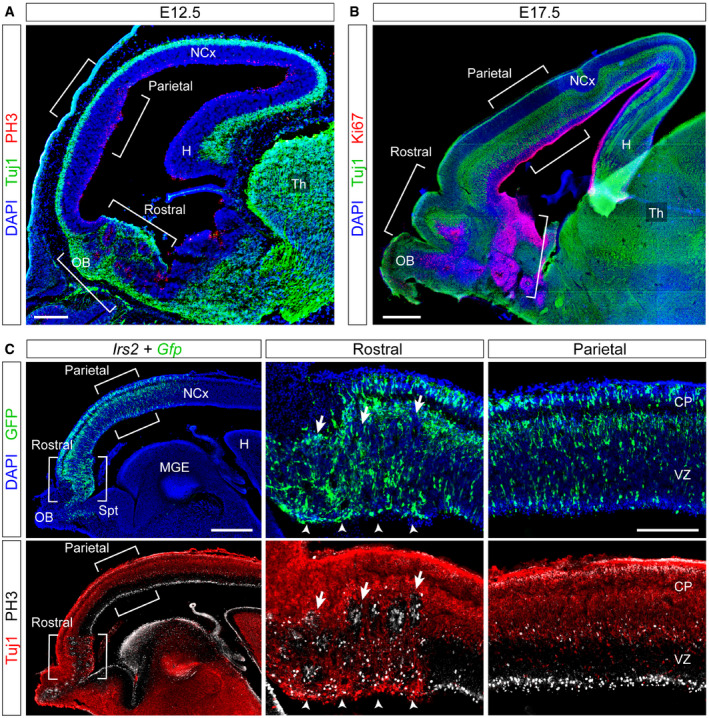
Sagittal sections through the telencephalon of Rx‐Dicer mutant embryos at the indicated ages stained for the indicated markers, showing the formation of proliferative rosettes selectively in the rostral but not the parietal (or caudal) regions, as indicated with brackets.
- C
Sagittal section through the telencephalon of an E14.5 wild‐type embryo electroporated with Irs2 + Gfp encoding plasmids across the entire rostral and parietal regions of the neocortex, stained with the indicated markers. Details of each region are shown on the right. Arrows indicate proliferative rosettes, and arrowheads indicate ectopic Tuj1+ neurons in the apical border of the VZ. The electroporated parietal neocortex (NCx) remained unaffected, with perfect layering of neurons, and apical and basal mitoses.
- A
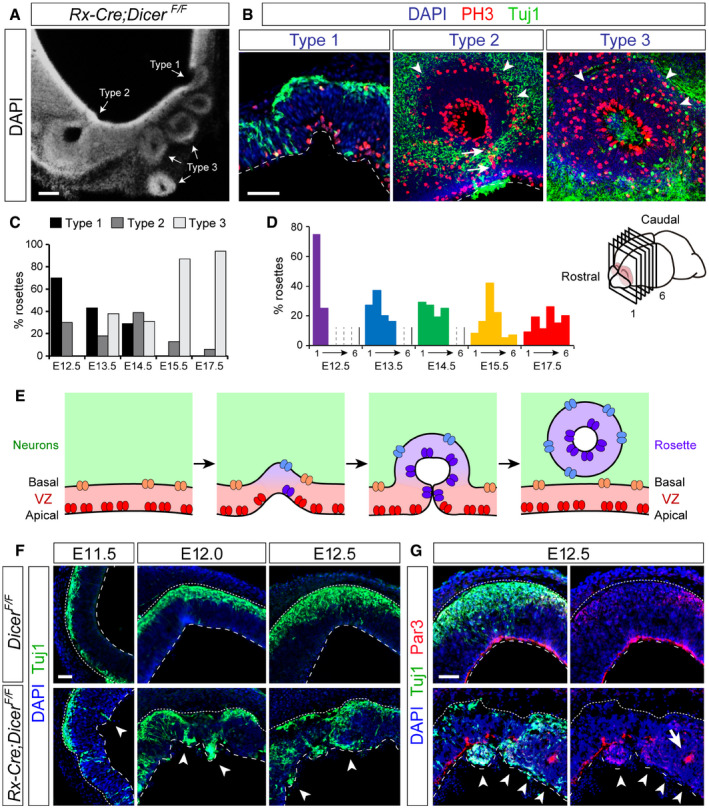
Coronal section through the rostral telencephalon of an E14.5 Rx‐Dicer mutant embryo displaying the three types of rosettes.
- B
High magnification of rosettes in Rx‐Dicer mutants at E12.5 (type 1), E14.5 (type 2), and E17.5 (type 3), immunostained for PH3 and Tuj1. Dashed line indicates ventricular surface; arrowheads indicate basal mitoses; arrows indicate a stream of apical mitoses connecting the lumen of the rosette with the lumen of the telencephalic ventricle.
- C, D
Abundance of rosette types at the indicated ages (C), and rostro‐caudal distribution of total rosette abundance per age, independent of type (D). n ≥ 2 brains per age.
- E
Schematic of the progression of rosette formation in the rostral telencephalon of Rx‐Dicer mutant embryos.
- F, G
Distribution of neurons (Tuj1+ cells) and apical adherens junction protein Par3 in the OB primordium of control and Rx‐Dicer mutant embryos at the indicated ages. Dotted lines indicate basal border, and dashed lines indicate apical border. White arrowheads indicate ectopic neurons and/or the absence of Par3. Arrow in (G) indicates accumulation of Par3 at the lumen of a nascent rosette.
- A, B
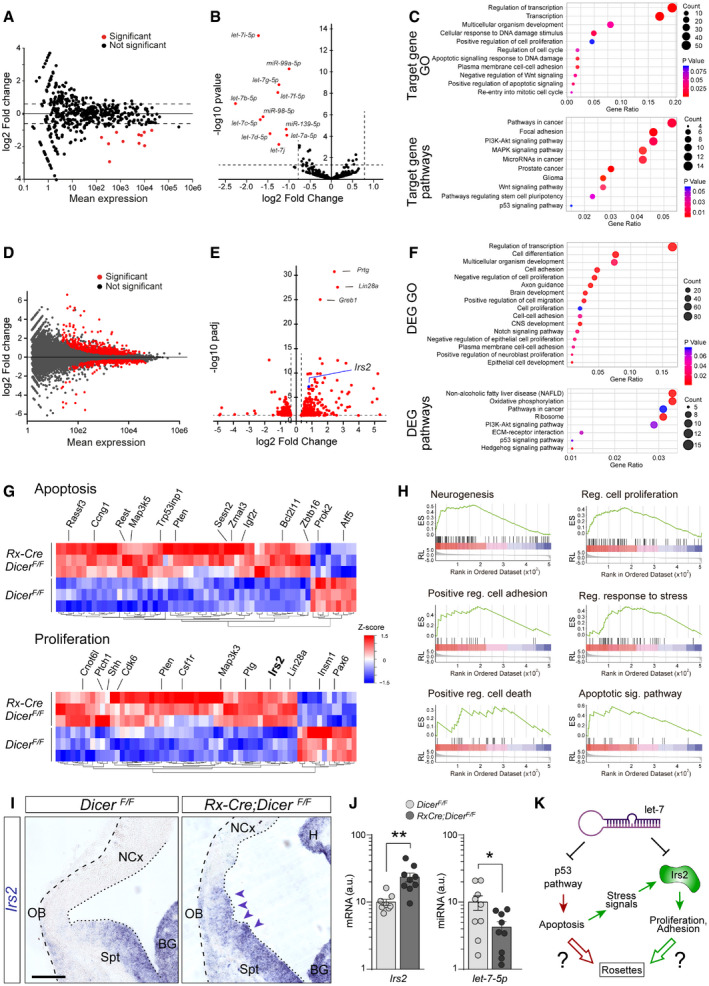
Changes in expression levels of miRNAs between control and Rx‐Dicer mutants at E11.5 in the rostral telencephalon. Red dots indicate statistically differentially expressed miRNAs according to FDR correction of P values based on the Wald statistic (DESeq2 analysis) (B). Dashes lines indicate stringency limits in evaluation of results.
- C
Gene Ontology terms (top) and signaling pathways (bottom) associated with target genes of the miRNAs differentially expressed between control and Rx‐Dicer mutants.
- D, E
Changes in mRNA expression levels between control and Rx‐Dicer mutants at E11.5 in the rostral telencephalon. Statistically differentially expressed mRNAs according to FDR correction of P values based on the Wald statistic (DESeq2 analysis; Adj. P < 0.1 and FC > 1.25) are highlighted in red, and the three with the highest Adj. P value are identified by name. Blue dot indicates Irs2: FC = 1.748, Adj. P = 5.95e‐08.
- F
Gene Ontology terms (top) and signaling pathways (bottom) associated with mRNAs differentially expressed between control and Rx‐Dicer mutants.
- G
Heat maps of relative expression levels of DEGs related to apoptosis (top) and proliferation (bottom). Rows correspond to independent biological replicates. Indicated are some example genes.
- H
Enrichment plots from GSEA for MSigDB hallmark neurogenesis (NES = 2.98; P = 0; Adj. P = 0.00045), regulation of cell proliferation (NES = 2.40; P = 0; Adj. P = 0.0033), positive regulation of cell adhesion (NES = 2.06; P = 0.0058; Adj. P = 0.013), regulation of response to stress (NES = 2.50; P = 0; Adj. P = 0.0023), positive regulation of cell death (NES = 1.84; P = 0.0179; Adj. P = 0.0326), and apoptotic signaling pathway (NES = 1.59; p = 0.047; Adj. P = 0.084).
- I, J
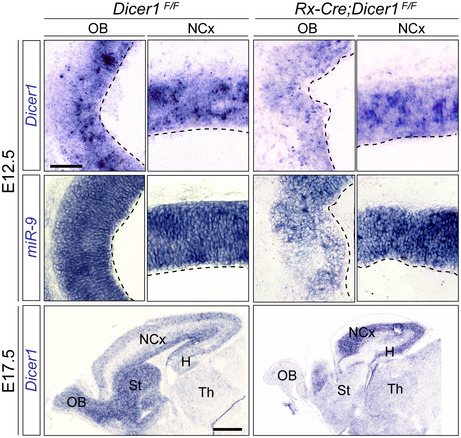
ISH stains of Irs2 mRNA, and qPCR for Irs2 mRNA and let‐7-5p miRNA, in the rostral telencephalon of control and Rx‐Dicer mutant embryos. Dashed line indicates basal border, and dotted line indicates apical surface. Arrowheads indicate area with the greatest increase in Irs2 expression. BG, basal ganglia; H, hippocampus; NCx, neocortex; OB, olfactory bulb; Spt, septum. Histograms represent mean ± SEM (logarithmic scale); symbols in plots indicate values for individual embryos; t‐test, *P < 0.05, **P < 0.01. N = 6–9 replicates per group. Scale bar, 100 μm.
- K
Working model of two potential genetic mechanisms leading to rosette formation in Dicer mutants: red, direct effect of increased p53 pathway activity upon loss of let‐7; green, Irs2 expression is massively increased by the combined effect of let‐7 loss and increased p53‐related cell stress signals, which enhances proliferation and decreases cell adhesion, leading to rosettes.
- A–C
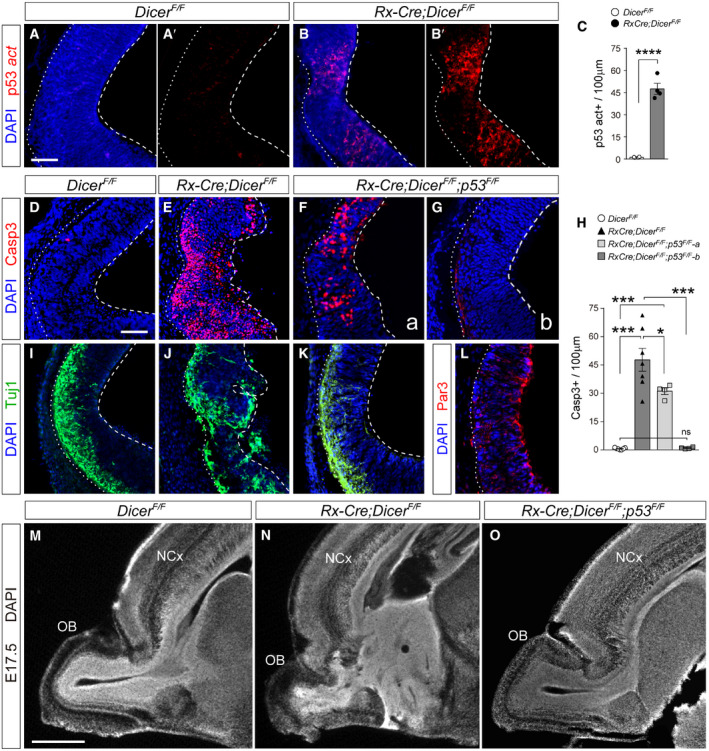
Immunostains for activated p53 (red) in the rostral telencephalon of control and Rx‐Dicer mutant embryos at E12.5, and quantification of positive cells (C). Dashed lines indicate apical side, and dotted lines indicate basal side. N = 4 replicates per genotype. Scale bar, 50 μm.
- D–L
Rostral telencephalon of E12.5 embryos of the indicated genotypes immunostained for the detection of apoptotic cells (Casp3), neurons (Tuj1), and the apical complex protein Par3, and quantification of cells positive for Casp3 (H). N = 4–7 replicates per genotype. Scale bar, 50 μm.
- M–O
Sagittal sections through the rostral telencephalon of E17.5 embryos of the indicated genotypes. Note the rosettes and general disorganization in Rx‐Dicer single mutants, and complete rescue of this phenotype in Rx‐Dicer‐p53 double mutants. Images in panels M, N are re‐used from Fig 2A. NCx, neocortex; OB, olfactory bulb. Scale bar, 1 mm.
- A
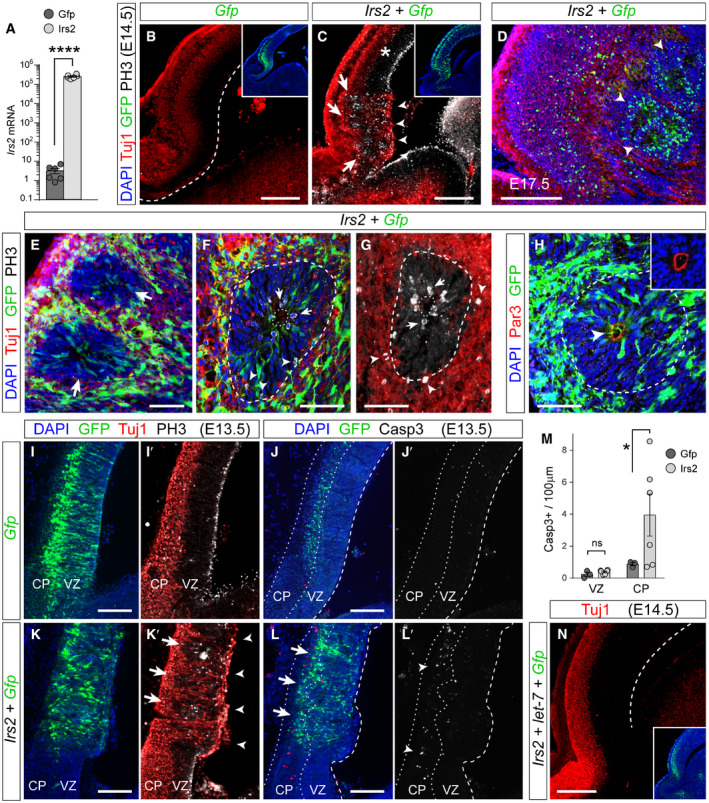
Relative Irs2 mRNA levels in HEK cells upon transfection with Gfp‐ or Irs2‐encoding plasmids. Mean ± SEM; t‐test, ****P < 0.0001. N = 6 replicates per group.
- B–D
Distribution of neurons (Tuj1, red), GFP (green), and mitoses (PH3, white) in the rostral telencephalon of wild‐type E14.5 or E17.5 mouse embryos, as indicated, electroporated at E12.5 with the indicated plasmid combinations. Dashed line indicates the apical surface. Insets show the same field of view, with location and extent of electroporations. Note the overlap of rosettes (arrows) with ectopic neurons at the apical surface (arrowheads) and increased basal mitoses, upon overexpression of Irs2 (C). Asterisk indicates the absence of malformation in nearby cortex. At E17.5 (D), GFP+ rosettes remain in deep cortical layers (arrowheads).
- E–H
Details of rosettes (large arrows in E; dashed lines in F–H) from Irs2 + Gfp‐overexpressing E14.5 embryos immunostained as indicated. Small arrows indicate apical mitoses, arrowheads indicate basal mitoses (F, G) and Par3+ apical surface at the center of rosettes (H), dotted lines indicate apical surface, and dashed lines indicate basal side of rosettes. Inset in (H) is at the same scale.
- I–M
Distribution of neurons (Tuj1, red), GFP (green), and mitotic (PH3, white) or apoptotic (Casp3, white) cells in the rostral telencephalon of wild‐type E13.5 embryos electroporated at E12.5 with the indicated plasmids, and quantification of Casp3+ cells (M). Dashed line indicates apical surface, and dotted lines indicate borders of the cortical plate (CP). Nascent rosettes (arrows) are next to ectopic ventricular neurons (arrowheads in K′) and basal mitoses, without significant apoptosis in VZ (L′, M). Mean ± SEM; t‐test; ns, not significant, *P < 0.05. N = 3–6 replicates per group.
- N
Distribution of neurons (Tuj1, red) in the rostral telencephalon of wild‐type E14.5 embryos electroporated at E12.5 with a combination of plasmids encoding Irs2, let‐7a, let‐7b and let‐7c, and Gfp. Dashed line indicates apical surface. Formation of rosettes in Irs2‐expressing embryos is rescued by overexpression of let‐7. Inset shows the same field of view, with location and extent of electroporation.
- A
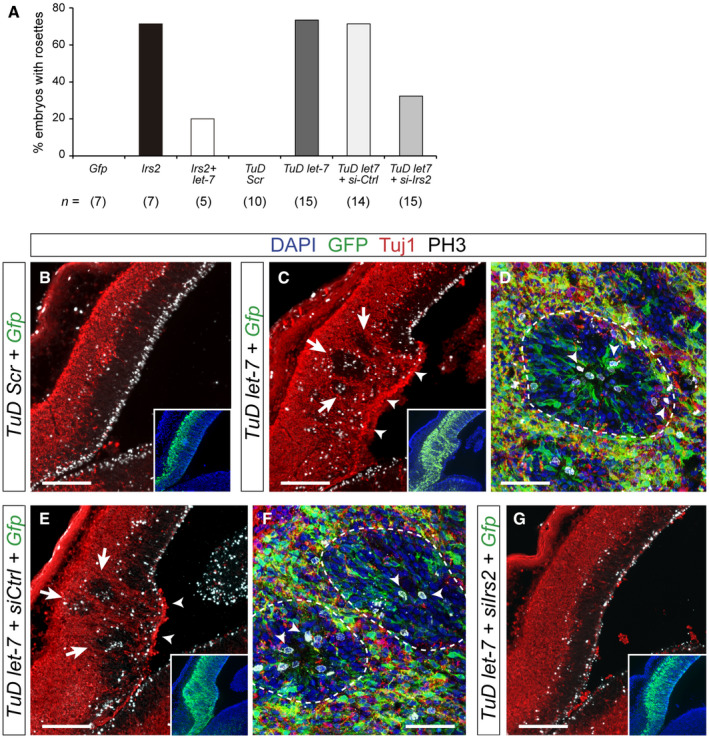
Frequency of rosette formation in the experimental conditions indicated. n, number of embryos per condition.
- B–G
Distribution of neurons (Tuj1, red), GFP (green), and mitoses (PH3, white) in the rostral telencephalon of wild‐type E14.5 mouse embryos electroporated at E12.5 with the indicated plasmid combinations. Inset shows the same field of view, with location and extent of electroporations. In (C) and (E), arrows indicate rosettes and arrowheads indicate neuronal ventricular ectopias. (D) and (F) are high magnification details of individual rosettes (dashed lines), where arrowheads indicate apical and basal mitoses. Loss of endogenous let‐7 drives the formation of rosettes and ventricular neuronal ectopias (C), which is rescued with the additional loss of Irs2 (G).
- A
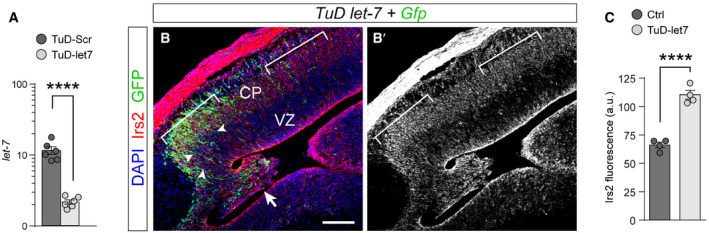
qPCR quantification of endogenous levels of mature let‐7 in HEK cells upon transfection with TUD‐Scr or TUD‐let7 encoding plasmids. Mean ± SEM and individual data points are shown on a logarithmic scale; n = 6 replicates per group; t‐test, ****P < 0.0001.
- B, C
Sagittal section of a wild‐type embryo electroporated with TuD let‐7 + Gfp plasmids at E12.5 and analyzed at E14.5 for the immunodetection of Irs2 protein (red, white), and quantification (C). Brackets indicate the electroporated area of neocortex (green) and the adjacent control area compared. Mean ± SEM and individual data points are shown; n = 4 replicates per group; t‐test, ****P < 0.0001. Levels of Irs2 almost doubled upon expression of TuD‐let7. Rosettes are indicated by arrowheads, and the typical ventricular neuronal ectopia caused by the loss of let‐7 is indicated by an arrow.
- A
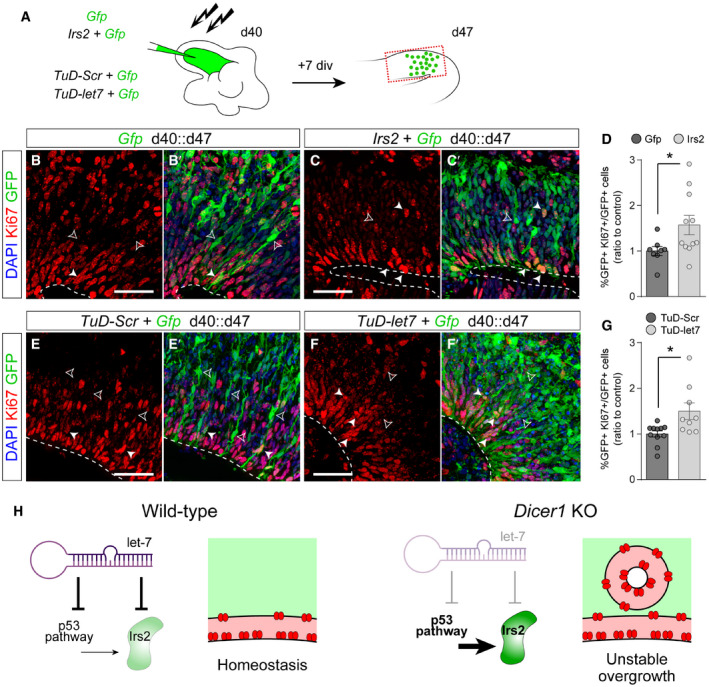
Schema of experimental design. At 40 days in culture, human cerebral organoids were electroporated with one of the indicated DNA plasmid combinations, followed by seven additional days in culture prior to analysis.
- B–G
Stains and quantifications of human cerebral organoids electroporated with the indicated construct combinations, to reveal the frequency of electroporated cells remaining as progenitors (%GFP+Ki67+/GFP+). Histograms represent mean ± SEM; symbols in plots indicate values for individual organoids; chi‐square test, *P < 0.05. N = 8–11 replicates per group. Dashed lines indicate ventricular surface, solid arrowheads indicate Ki67+/GFP+ cells, and open arrowheads indicate Ki67−/GFP+ cells. Scale bars, 50 μm.
- H
Schematic drawing of conclusions from this study. let‐7 expressed in the early telencephalic neuroepithelium represses the expression of p53 and Irs2, which maintains the cellular homeostasis and epithelial integrity. Loss of let‐7, as in Dicer1 mutants, de‐represses the expression of Irs2 and of p53 pathway components, which further increase Irs2 levels. High Irs2 enhances progenitor cell proliferation and loss of apical adhesion, altering neuroepithelial homeostasis and integrity, and leading to the formation of hyperproliferative rosettes.
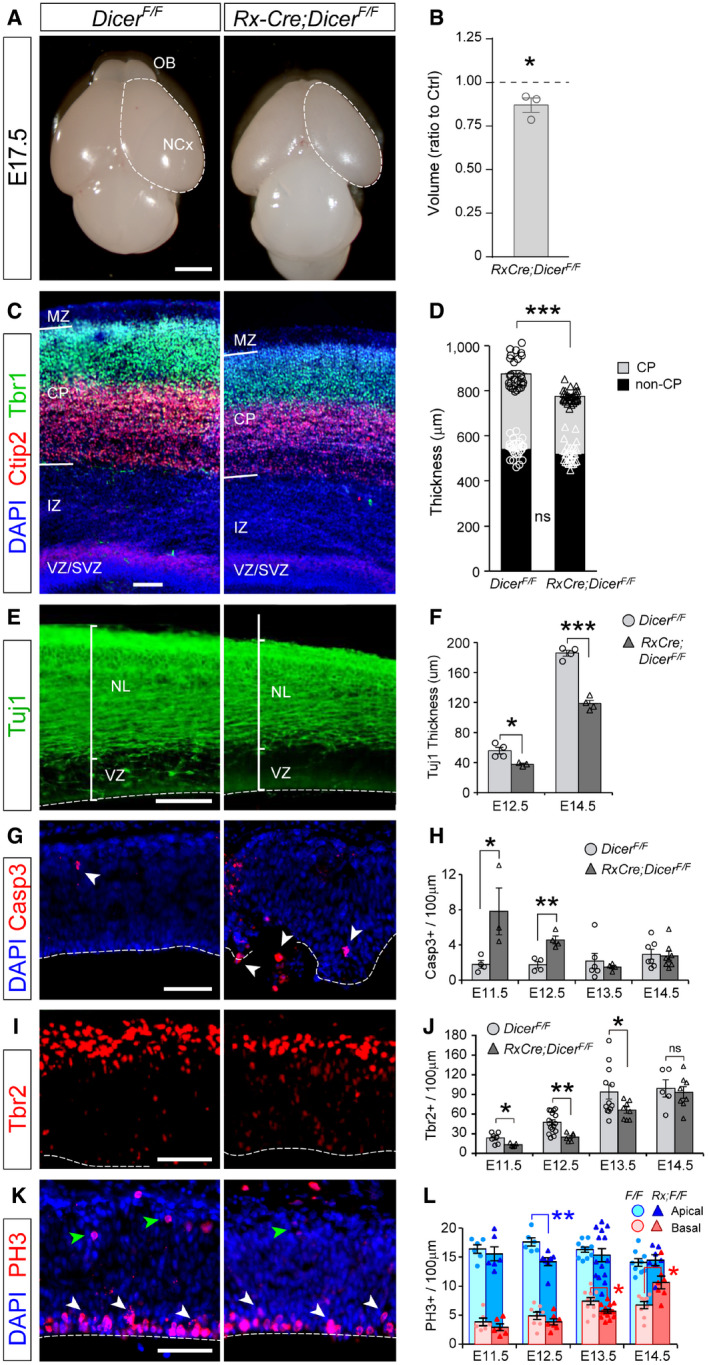
- A
External view of the brains of control (Dicer F/F) and Rx‐Dicer mutant littermates (Rx‐Cre;Dicer F/F) at E17.5, showing the reduction in cerebral cortex (NCx) size and apparent loss of olfactory bulb (OB) in mutants. Dashed lines indicate border of NCx.
- B
Quantification of telencephalic volume (values relative to control littermates). N = 3 replicates.
- C, D
Location and thickness of cortical plate (CP), superficial (Tbr1+), and deep (Ctip2+) cortical layers, in control and Rx‐Dicer mutants, and quantifications. N = 27 replicates per group. Black symbols = CP, white symbols = non‐CP. MZ, marginal zone; IZ, intermediate zone.
- E, F
Thickness of the layer containing neurons (Tuj1+) in the E14.5 cerebral cortex of control and Rx‐Dicer mutant embryos, and quantifications. Dashed line indicates apical surface. NL, neuronal layer. N = 4 replicates per group.
- G–L
Distribution and quantification of apoptotic cells (Casp3+), Tbr2+ cells, and apical and basal mitoses (PH3+) in the cerebral cortex of E12.5 control and Rx‐Dicer mutant embryos. Dashed line indicates apical surface; white arrowheads indicate apical mitoses, and green arrowheads indicate basal mitoses. N = 4–14 replicates per group.
Similar articles
-
Disruption of early events in thalamocortical tract formation in mice lacking the transcription factors Pax6 or Foxg1.J Neurosci. 2002 Oct 1;22(19):8523-31. doi: 10.1523/JNEUROSCI.22-19-08523.2002. J Neurosci. 2002. PMID: 12351726 Free PMC article.
-
Loss- and gain-of-function analyses reveal targets of Pax6 in the developing mouse telencephalon.Mol Cell Neurosci. 2007 Jan;34(1):99-119. doi: 10.1016/j.mcn.2006.10.008. Epub 2006 Dec 8. Mol Cell Neurosci. 2007. PMID: 17158062
-
Telencephalic neural precursor cells show transient competence to interpret the dopaminergic niche of the embryonic midbrain.Dev Biol. 2011 Jan 15;349(2):192-203. doi: 10.1016/j.ydbio.2010.11.003. Epub 2010 Nov 9. Dev Biol. 2011. PMID: 21070763
-
MiRNAs in early brain development and pediatric cancer: At the intersection between healthy and diseased embryonic development.Bioessays. 2021 Jul;43(7):e2100073. doi: 10.1002/bies.202100073. Epub 2021 May 16. Bioessays. 2021. PMID: 33998002 Review.
-
Embryonic stem cell microRNAs: defining factors in induced pluripotent (iPS) and cancer (CSC) stem cells?Curr Stem Cell Res Ther. 2009 Sep;4(3):168-77. doi: 10.2174/157488809789057400. Curr Stem Cell Res Ther. 2009. PMID: 19492978 Review.
Cited by
-
MicroRNAs Instruct and Maintain Cell Type Diversity in the Nervous System.Front Mol Neurosci. 2021 Apr 29;14:646072. doi: 10.3389/fnmol.2021.646072. eCollection 2021. Front Mol Neurosci. 2021. PMID: 33994943 Free PMC article. Review.
-
Secondary loss of miR-3607 reduced cortical progenitor amplification during rodent evolution.Sci Adv. 2022 Jan 14;8(2):eabj4010. doi: 10.1126/sciadv.abj4010. Epub 2022 Jan 12. Sci Adv. 2022. PMID: 35020425 Free PMC article.
-
MicroRNAs: emerging driver of cancer perineural invasion.Cell Biosci. 2021 Jun 29;11(1):117. doi: 10.1186/s13578-021-00630-4. Cell Biosci. 2021. PMID: 34187567 Free PMC article. Review.
-
Notch directs telencephalic development and controls neocortical neuron fate determination by regulating microRNA levels.Development. 2023 Jun 1;150(11):dev201408. doi: 10.1242/dev.201408. Epub 2023 Jun 5. Development. 2023. PMID: 37272771 Free PMC article.
-
Evolution of genetic mechanisms regulating cortical neurogenesis.Dev Neurobiol. 2022 Jul;82(5):428-453. doi: 10.1002/dneu.22891. Epub 2022 Jun 22. Dev Neurobiol. 2022. PMID: 35670518 Free PMC article. Review.
References
Publication types
MeSH terms
Substances
Associated data
- Actions
Grants and funding
- SEV-2017-0723/Spanish State Research Agency
- PGC2018-102172-B-I00/Spanish State Research Agency
- SAF2015-69168-R/Spanish State Research Agency
- 309633/EC | H2020 | H2020 Priority Excellent Science | H2020 European Research Council (ERC)
- Fundación Tatiana Pérez de Guzmán el Bueno (Tatiana Pérez Foundation of Guzmán el Bueno)
LinkOut - more resources
Full Text Sources
Molecular Biology Databases
Research Materials
Miscellaneous
